Debris flows in the northern Tien Shan, Central Asia: regional database, meteorological triggers, and trends

Introduction
Debris flows (DF) threaten life and infrastructure in mountains and adjacent plains1,2. Steep slopes, heavy precipitation, rapid snowmelt, abundance of unconsolidated material, and earthquakes facilitate DF formation3. Climatic warming leads to increasing share of liquid precipitation at higher elevations in spring and autumn extending the DF season and shifting the DF triggering zone to higher elevations4. In glacierized basins, there are additional factors such as intensive melting of glaciers and sub-surface ice and, importantly, expansion of glacial lakes5. The oversaturation of soils and moraine complexes increases the risk of lake dam failure5 and leads to the instability of adjacent slopes and potential overtopping of lakes6 resulting in Glacier Lake Outburst Floods (GLOF) and associated DF.
There are complex relationships between hydro-meteorological triggers, climate change, and GLOF and related DF7,8,9. As a result of climatic warming, the abundance of glacial lake increases and lake dam failures and GLOF, leading to DF, occur at higher elevations and earlier in the year. These trends can be exacerbated by the high-elevation heat waves10. However, the response times of GLOF and related DF to climate change and lake evolution are non-linear and the globally, the observed deglaciation may have reduced GLOF activity overall9,11 although there are significant regional variations12.
The DF, which are not related to GLOF, are weather-dependent and can be directly attributed to heavy or prolonged precipitation, higher temperatures, and intensive snowmelt1. Previous studies focused on the meteorological aspects of such DF in the Himalayas13, European Alps14,15, and Tien Shan and Pamir16,17 establishing empirical thresholds of DF formation including antecedent cumulative rainfall, rainfall intensity related to its duration (ID thresholds)13,18,19,20, and snowmelt17,20. There are strong regional and local variations between the thresholds triggering DF resulting from multiple factors including topography, mineralogy and geology, freezing-thawing or wetting-drying cycles, and regional precipitation regimes4.
The multitude of factors triggering DF, encompassing extreme weather and geophysical hazards, make them compound hazards causing cascades of devastating impacts downstream1. GLOF and the related DF events have been documented world-wide5,21,22,23 although data from remote regions and earlier years are limited. Databases of shallow landslides are under development24,25 and geomorphological and meteorological controls over shallow landslides were assessed3,4,19. Less well documented are DF which are not related to GLOF but result from shallow landslides and entrainment of material during the downstream travel resulting in expansion of the impacted area. Their occurrence is often inferred from geomorphological data which cannot be directly attributed to meteorological triggers and used in the assessment of trends4.
All types of DF (resulting from or unrelated to GLOF) are major hazards causing extensive damage in the mountains of Central Asia22,26. Currently, research in the region focuses on GLOF and related DF (we note that all GLOF events produce DF in the region) because of the rapid glacier retreat27,28,29 and the increasing abundance of glacial lakes30,31,32. Several studies assessed hazard potential of lakes31,33,34,35,36,37 and analysed individual GLOF events7,22,38,39,40. DF, which are not caused by GLOF, received less attention although historical data are abundant26,37 and catalogues of DF were partially compiled for Kazakhstan41 and Uzbekistan16.
Climatic warming is observed throughout Central Asia42 increasing with elevation43, and future warming and extension of the frost-free season are projected by the CMIP644 and regional45 climate models. Uncertainty in precipitation projections is considerable but an increase in warm season precipitation and share of rainfall is projected for the mountains44. Assessments of meteorological and climatic controls over DF of different geneses and their frequency are limited in the region16,17. In Uzbekistan, increasing frequency of DF not caused by GLOF is projected46 but projections are not available for other regions and links between climate change and GLOF-related DF have not been examined. More detailed evaluations are needed for successful risk management and adaptation, both in the region and globally, but they require understanding of changes in climatic conditions conducive to GLOF and DF11,47. This, in turn, requires comprehensive regional and global data sets, which at present contain many gaps9,12,21. Historical data on GLOF and DF dating back to the 1880s are available from the national disaster-prevention agencies, e.g. the Kazakhstan State Agency for Mud Flow Protection (KSAMP). Both archival and published41 data can be used to extend global catalogues of GLOF and DF, assess their responses to climate change, and improve forecasts.
The aim of this paper is to examine spatial and temporal trends in the frequency of GLOF-related DF and DF of other geneses, and meteorological and climatological aspects of their formation in the northern Tien Shan, Kazakhstan. We focus on four types of DF because they have different triggers and respond differently to climatic oscillations: GLOF-related, glacial (caused by strong glacial melt but not a lake outburst), pluvial (caused by heavy rainfall) and hybrid (caused by heavy precipitation and snowmelt) (‘Methods’). The objectives are to: (i) compile homogenised records of GLOF and DF of various geneses; (ii) examine temporal and spatial trends in their frequency; (iii) derive meteorological thresholds leading to the formation of GLOF-related and GLOF-unrelated DF; and (iv) quantify the observed changes in the occurrence of the identified thresholds to assess changing risks.
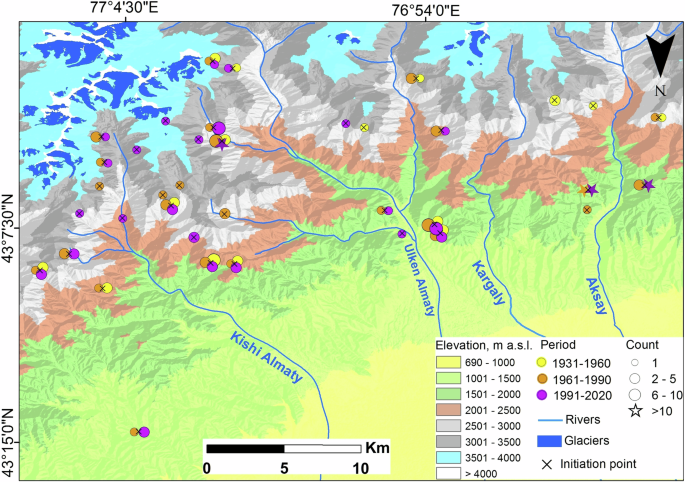
Records of GLOF events and GLOF-related DF in the Ile-Kungey and Jetysu Alatau are used but analysis of the DF not caused by GLOF is deliberately restricted to the central Ile Alatau (Fig. 1) where meteorological data are available and homogenization can be achieved (‘Methods’). In this region, comprised of the Kishi Almaty (KA), Ulken Almaty (UA), Kargaly, and Aksay basins (Fig. 1), glacial lakes and sources areas of DF of other types are located in proximity to densely populated areas including the city of Almaty (population of about 1.8 million) located on the direct path of the past22,41 and potential future DF. Therefore, even moderate events can have devastating consequences.

Locations of GLOF sources and frequency of GLOF and related DF events are shown for the Ile-Kungey and Jetysu Alatau. The region, for which DF events not caused by GLOF were documented, is indicated. Numbers denote the locations of the meteorological stations: (1) Bolshoe (Big) Almaty Lake (BAL), (2) Mynzhylki, (3) Tuyuksu. Digital Elevation Model (DEM) derived from the Shuttle Radar Topography Mission (SRTM) is used as background (available from https://dwtkns.com/srtm30m/). Glacial mask was derived from Landsat 8. The map was produced using ArcGIS ProVersion 2.7.
Results
Changing frequency of GLOF and DF in the Ile-Kungey and Jetysu Alatau
Overall, 55 GLOF events, all followed by DF, were registered in the region since 1887 (Fig. 1). Their frequency peaked in July (32 events) followed by August (10) and June (10) (Fig. 2a). Glacial DF exhibited the same seasonal pattern. Only two GLOF events were registered in September in 1980 and 1982 in the Jetysu Alatau (Fig. 2a). The number of GLOF-related and glacial DF peaked in the 1971–1980 period which was characterized by a prolonged positive anomaly in air temperature, the strongest negative values of glacier mass balance43 and the highest rates of glacier retreat29 in the 20th–21st centuries. The frequency of GLOF and GLOF-related DF declined in the 1990s and, importantly, it did not pick up in the 21st century despite the observed increase in summer temperatures, glacial runoff43, and abundance of glacial lakes31,32. Similar decrease in frequency of glacial DF has been observed in 1991–2020 in comparison with 1961–1990 when 13 and 48 DFs respectively were registered in the central Ile Alatau.
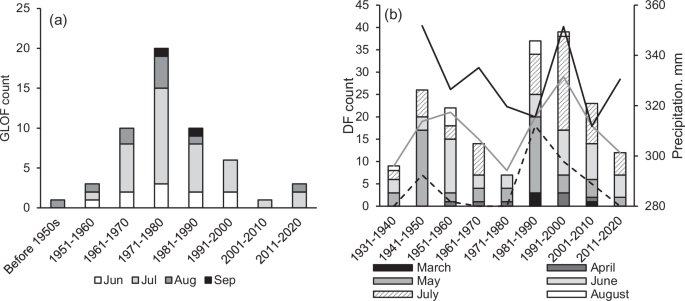
a GLOF events in the Ile-Kungey and Jetisu Alatau and b pluvial and hybrid DF in the UA and KA catchments (Fig. 1). Decadal means of March-August precipitation totals (Mynzhilki station; Fig. 1) are shown.
In the central Ile Alatau (Fig. 2), 292 pluvial DF and 46 hybrid events were identified between 1931 and 2020. DF of both types occurred in May–July accounting for 88% of all events in line with the observed annual precipitation maximum (Methods). In April–June, a transition from solid to liquid precipitation occurs depending on elevation but to date, there has been no consistent increase in frequency of DF in spring. Frequency of DF followed variability in precipitation: it was low in the 1970s in line with a negative anomaly in precipitation, increased in the 1980s–2000s when the warm season precipitation increased43 and declined to its pre-1960s level in the last two decades (Fig. 2b). The number of spring events peaked in 1941–50 (17 events) and 1981–90 (20 events) (Fig. 2b) because the precipitation totals in May exceeded 90th percentile in the 1937–2021 record in 1946 and 1947, and 1981 and 1983 at Mynzhylki station (Fig. 1).
In the KA and UA basins, mobilization points of pluvial and hybrid DF were positioned between 1200 and 3600 m a.s.l. with an average elevation of 2408 ± 667 m a.s.l. The range of elevations, where DF of these types were observed, has expanded upwards since the 1960s (Figs. 3, 4). The occurrence of DF above approximately 2500 m a.s.l. is not affected by human activity. The DF count within the elevation range of 2500–3600 m increased from 20 in the 1931–1960 period to 35 in the 1961–1990 and 47 in the 1991–2020 period.
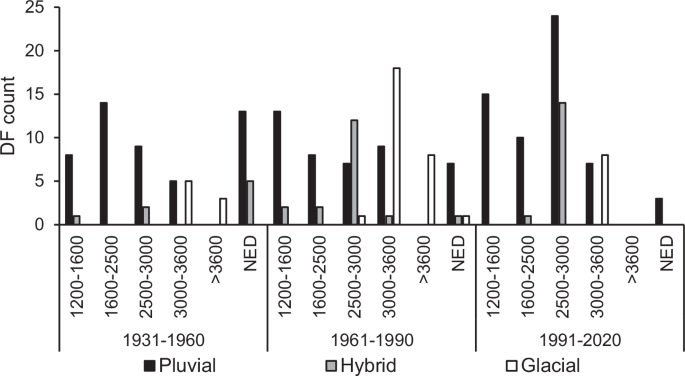
The elevation bands (Y-axis, m a.s.l.) have been selected according to the KSAMP operational practice. Note that elevation ranges are not uniform. NED is ‘No Elevation Data’.
In individual catchments, trends can be different from those observed across the region distorting climate-related trends. The frequency of pluvial DF nearly tripled in the Aksay basin since the 1970s (Fig. 4). Here, DF formation is related to the extensive deep landslides formed in 1887 as a result of an earthquake (‘Methods’). They are confined to a limited elevation band centred at 1781 ± 199 m a.s.l. and their frequency is controlled by the availability of sediment and intensifying erosion. Similar local anomalies affecting regional trends were reported for the French Alps14,48.
Digital Elevation Model (DEM) derived from the Shuttle Radar Topography Mission (SRTM) is used as background (available from https://dwtkns.com/srtm30m/). Glacial mask was derived from Landsat 8. The map was produced using ArcGIS ProVersion 2.7.
Meteorological thresholds
The cumulative distribution functions (CDF) of 10 (∑10) and 20 (∑20) day cumulative positive temperatures (Degree Day Temperature; DDT), and 10-day precipitation and changes in snow depth were generated for four DF categories and non-DF days. Glacial DF occurred at the highest temperatures followed by the GLOF-related events with the 10th percentiles (Q10) of ∑10 DDT of 70.5 oC and 50.4 oC, respectively (Table 1). The difference between ∑10 DDT and ∑20 DDT temperatures characterising the occurrence of glacial DF and other types of DF and non-DF days was statistically significant (p < 0.01). Only ∑20 DDT-characterising GLOF-related DF events were significantly different from those leading to pluvial and hybrid DF or days with no DF (p = 0.04).
Probabilities of exceedance of the identified temperature thresholds were increasing over time. For glacial DF, ∑10 DDT Q50 threshold was 88 oC (Table 1). Probability of ∑10 DDT (calculated for all days in JJA) exceeding this threshold was 11% in 1937–1960 but 18% and 26% in 1961–1990 and 1991–2021, respectively (Fig. 5a).
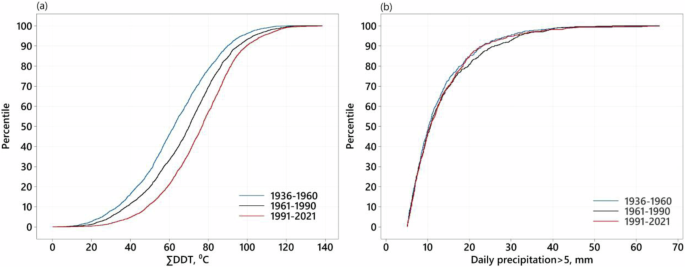
a ∑10 DDT and b daily precipitation > 5 mm.
There was no difference in antecedent precipitation between days with GLOF and related DF and days with no DF showing that overall, antecedent precipitation does not control GLOF in the region. There were, however, several exceptions. Three GLOF events occurred under the conditions of low temperatures and high precipitation on 20 June 1970 (Lake No 5, Talgar catchment) and 6 June 1980 (Lakes No 19 and 20, Esik catchment) when cumulative DDTs were 32 oC. In the latter case, ∑10 precipitation registered by several regional stations varied between 80–110 (rising to 100–130 mm for the 11-day period) and the non-exceedance probability of the ∑10 precipitation (using BAL and Mynzhylki data) for 6 June was 0.93 based on the 1937–2021 precipitation record for this date.
Cumulative precipitation preceding the pluvial (p < 0.01) and hybrid (p = 0.01) events significantly exceeded those for days with GLOF-related, glacial DF and no DF (Table 1). The hybrid DF, caused by a combination of rainfall and snowmelt, occurred at lower precipitation thresholds than pluvial DF, however, snowmelt rates preceding hybrid DF were significantly higher. The median of the 10-day change in snow depth preceding hybrid DF registered above 2500 m a.s.l. in May was 25 cm. For pluvial DF and days without DF, it was 10 and 15 cm, respectively (Fig. 6). The largest snow depth decreases recorded on 25 May 1941 (∑10 50 cm) and 10 May 1989 (∑10 30 cm) coincided with pluvial DF when antecedent rainfall was 66 mm and 35 mm, respectively.
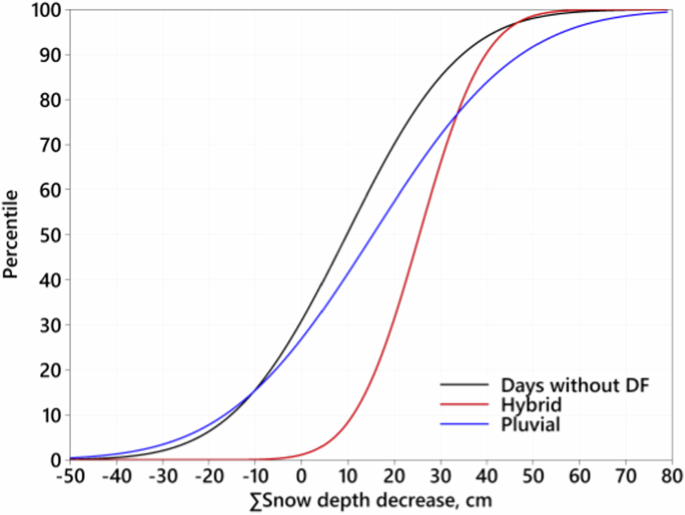
CDF of 10-day change in snow depth at Mynzhylki station (3010 m a.s.l.) in May for hybrid and pluvial DF and days without DF above 2500 m a.s.l. Positive (negative) values refer to snowmelt (accumulation).
There was no statistically significant change in JJA precipitation between 1937–1960 and 1991–2021 overall (Fig. 5b) and no periodical variations in high-intensity precipitation (>40 mm day−1) throughout the record which is also confirmed by a range of regional meteorological stations43.
Intensity—duration thresholds
Threshold relationships between rainfall intensity (mm day−1) and duration (Methods) were established for pluvial DF for the KA and UA (1) and Aksay (2) catchments:
where I is rainfall intensity (mm day−1) on the day D when maximum cumulative average intensity in the 10-day period was observed (‘Methods’).
The negative exponents show that with increasing duration of water supply, lower-intensity is required for DF initiation (Fig. 7). In KA and UA catchments, absolute value of the exponent (characterising the steepness of the threshold curve) was high in comparison with other mid-latitude regions19 pointing at a large difference between short- and long-term water supply causing DF formation. Day 1 rainfall caused 63% of all pluvial DF events. The best fit median rainfall intensity was 28 mm day−1 for Day 1 of the 10-day period. Day 1 rainfall intensities varied between 11 mm day−1 and 65.5 mm day−1 (Fig. 7a). For five-day and ten-day rainfall duration, the best fit median thresholds were 7 mm day−1 and 4 mm day−1, respectively. R2 for the log-transformed equation was 0.57 (p < 0.01). The ID relationship was weaker in the Aksay catchment (where steep slopes and an abundance of sediments result in very frequent DF) with R2 of 0.45 (p < 0.01) for the log-transformed equation. The median Day 1 rainfall was 22.5 mm day−1 but rainfall intensity as low as 5.3 mm could be responsible for DF formation. Rainfall on Day 1 was responsible for 64% of all pluvial DF events.
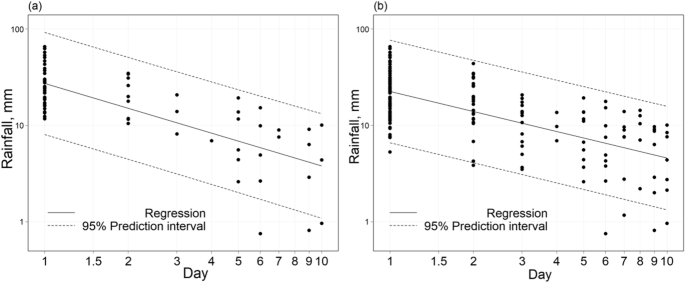
a UA and KA catchments and b Aksay catchment.
For the hybrid events, the R2 value was considerably lower at 0.17 in both regions and the best fit median value was 15 mm day−1 for Day 1 but the same as for the pluvial DF for ten-day duration.
Discussion
Frequency of hazards related to climate change and glacier retreat in mountains are projected to increase4,49, however, the observed trends and their attribution do not always support this assumption9,11,12. Uncertainty arises from the complexity of responses but also from the lack of reliable data highlighting the need for expansion of regional databases50. The original data, encompassing nearly a century of observations in the northern Tien Shan, were inevitably inhomogeneous. By re-classifying the complete record of DF using consistent criteria (Methods), homogeneous data sets of four types of DF were developed for the central Ile Alatau. The pre-1950s record in other regions were affected by sparse observations. New indicators (e.g. records of unmanaged glacial and pluvial DF) were developed to assess the changing frequency of hazards in the context of climate change and variability. Overall, 55 GLOF events (all followed by DF) were recorded in the region which is fewer than reported before41 because of the previous misclassification. Uncertainty in meteorological thresholds was assessed by calculating them for different types of DF and catchments to account for local variations. The Aksay catchment should be excluded from regional analysis as its very specific conditions (steep erodible slopes and abundance of sediment material formed due to the 1887 earthquake; Study Area) distort regional climate-related trends. The established thresholds can be used in the improvements of DF forecast in combination with new methods of rainfall forecast in complex terrain51 which are currently being implemented in the region52 and in the assessments of impacts of climate change. Including snow water equivalent (SWE) as predictor will improve forecasts further especially for the hybrid DF and eliminate the need for separating pluvial and hybrid DF.
Provision of information about DF to stakeholders enables more efficient risk management and, therefore, improves resilience. This research was conducted in close collaboration with KSAMP and stakeholders whose requirements for a simple and quick data analysis, discussed at workshops conducted in Almaty, Kazakhstan in 2018 and in Tashkent, Uzbekistan in 2021 and ascertained via surveys, were an important consideration. Information about GLOF and DF events used in this study is available via an online GLOF and Debris Flow Platform (https://research.reading.ac.uk/glof-predicting-debris-flow/) which is designed to be expanded to include data from other regions of the Tien Shan. An app with a GUI, DF-Met, enabling quick analysis by users (Methods), is available via the platform.
Globally, changes in GLOF frequency are not directly related to observed climatic warming11 and magnitude of GLOF-related DF events declined in several glacierized regions9,12. In the northern Tien Shan, the formation of GLOF is linked to prolonged (20 days and longer; Table 1) positive temperature anomalies. These conditions were frequently observed between 1973 and 1984 when 22 GLOF were recorded, all causing significant damage to infrastructure22. Global increase in GLOF activity between 1930s and 1970s was attributed to a delayed response to the post Little Ice Age warming resulting from a combination of glacier, limnological, and GLOF response times11. Temporal trends in GLOF frequency in the Tien Shan agree with this pattern but climatic variability was an important factor enhancing GLOF formation in the 1970s.
In the last two decades, glacier runoff increased in the glacierised catchments43. There was an increase in lake abundance resulting from their dynamic behaviour involving both growth and drainage, detachment from glaciers and formation of new contact lakes31,32. The abundance of contact and glacial-detached lakes increased by 9% and 13%, respectively, between 2000 and 2014 while increase in lake area was not statistically significant at 95% confidence level31. Previously, GLOF were registered at lakes of both types. Despite the growing trend in abundance and the fact that on average, lakes are not becoming smaller, only four GLOF occurred since 2000: on 4 July 2005 (Kaskelen basin), 17 July 2014 (Middle Talgar basin), and 23 July 2015 and 14 August 2019 when Lake Kargaly (Kargaly basin) emptied twice although lake level lowering had been applied since 2016. Discharged volumes were significantly lower (2000–6000 m3) than during the events in the 1970s (8000–9000 m3) although the available statistics are too small for a reliable conclusion53,54.
GLOF mitigation is a minor factor in analysis of global records11,12. However, it makes a difference in the Ile Alatau but not in the other regions of the Tien Shan. Before 2000, two lakes were managed in the Ile Alatau on a regular basis. Since 2010, all dangerous lakes are monitored and levels of 14–20 lakes are lowered annually accounting for 10% of all glacial lakes in the Ile Alatau. Artificial drainage (by pumping the water out of the lakes and/or construction of the artificial outflow channels (Fig. 8)) was applied to 60 lakes in the last 50 years on a regular or short-term basis. However, there has been no increase in GLOF frequency in the Jetysu Alatau where only four out of over 600 lakes are managed, and in the Kungey Alatau where currently lakes are not managed.
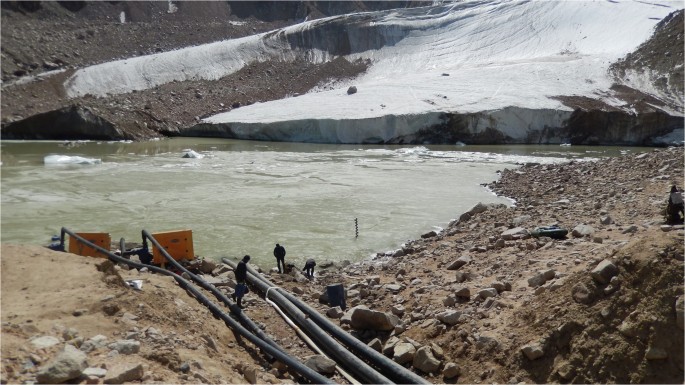
Preventive artificial drainage of Lake 13-bis in the UA catchment (43.039oN; 77.044oE). Photo: M. Shahgedanova.
In the central Ile Alatau, glacier area, and volume are projected to decrease by 40% by the 2050s in comparison with 2000, stabilising afterwards45. The loss of glacier mass and area and their retreat to higher elevations are projected for other regions of the Tien Shan55,56. Future projections of glacier lakes developed using GlabTOP2 model revealed significant potential for lake expansion in the northern Tien Shan31,57. Regular lake monitoring and bathymetric surveys confirm that lakes form in 70% of the sub-glacial overdeepening identified by GlabTOP2 following glacier retreat. Positioning of glacier mass on steeper slopes and close to the drainage divides can constrain both the formation and size of lakes12. However, it is well known that outbursts of small lakes can cause significant damage and modelling suggests that many new lakes are likely to be larger than the existing ones in the Kungey and Jetysu Alatau31,57.
The frequency of glacial DF, which is a natural indicator of the impacts of climate and glacier change of DF occurrence, declined in the well-monitored central Ile Alatau in 1991–2020 (Fig. 2). The occurrence of glacial DF is explicitly linked to high temperatures (Table 1) and the observed climatic changes are conducive to the occurrence of more frequent events. Based on the ∑10 DDT Q50 threshold (Table 1; Fig. 5a), glacial DF can be expected to occur on a quarter of all days in summer in 1991–2021, but only eight events were recorded in the central Ile Alatau. Two glacial DF events occurred on 25 July 2015 in UA and KA catchments when ∑10 DDT at 3010 m a.s.l. was 152 oC, the highest for this specific date since record began in 1937. July 2015 was the warmest on the 1937–2021 record coinciding with one of the largest El Niño events. The monthly mean temperature (11.5 oC) exceeded the long-term average by 3.5 oC at 3010 m a.s.l. and the position of the zero isotherms exceeded 5000 m a.s.l. implying that glacier melt occurred across entire surfaces of the glaciers53.
Glacier thinning, retreat to higher elevations, and melting of ice contained in moraines may explain the decoupling between the changing climate and glacial DF frequency. In the Jetysu and Ile Alatau, glaciers have lost 49% of their cumulative area in 1956–2016 and 1955–2022, respectively58. Most sites of glacial DF formation are now located below glacier tongues. Surface lowering of the Central Tuyuksu glacier and other glaciers of the Tuyuksu group in KA catchment was 23.2 ± 2.2 m and 17.8 ± 2.2 m in the 1958–2016 period as averaged across all elevations. It exceeded 50 m in the ablation zone and over the surrounding moraines pointing at melting of buried ice59. Downwasting of glaciers and their retreat to steeper slopes restricted the formation of englacial or sub-moraine water pockets and the occurrence of glacial DF.
High rainfall intensity observed on the days of pluvial DF was their main trigger in agreement with the earlier conclusions19 that shorter duration and higher intensity rainfall is the main cause of landslides and DF at higher elevations. The exponent of −0.87 in KA and UA catchments (Eq. 1) exceeded the range of −0.70 to −0.81 reported for other mid-latitude regions19 implying a steeper change in the DF-triggering rainfall intensity over time. The median ID thresholds obtained in this study were in the range of other median thresholds reported in literature for regions with similar elevations and rainfall regimes19,20,60. Minimum threshold values were low adding uncertainty to forecasts of DF. Several events triggered by the longer-duration and lower-intensity rainfall were outside the 95% prediction interval (Fig. 7) and the derived ID relationships were not as strong as in other studies13. This may be attributed to the abundance of material on steep slopes (especially in the Aksay catchment) and saturation of soils during the period of snow (April–June), glacier (July–August), and ground ice (August) melt. In spring and early summer, the occurrence of hybrid DFs was preceded by snowmelt rates significantly exceeding those observed on days with no DF (Fig. 6), and several events were caused by very heavy rainfall which led to rapid snowmelt. In Tajikistan and Kyrgyzstan, 40% of DF events were attributed to snowmelt17. It also was an important factor in the formation of DF in Norway where water supply intensity, combining rainfall and meltwater, was used to derive the ID equations20. A lack of spatially distributed snowmelt data (and snow density measurements for the duration of the record) does not allow us to incorporate it in the ID equations and regression analysis which is a limitation of this study. A lack of rainfall measurements (limited to daily totals at two meteorological stations in the KA and UA catchments) may not be able to capture the occurrence of higher rainfall events in the catchments with steep elevation gradients, and neither does modelled data with spatial resolution of 12–25 km45.
Temporal variations in the frequency of pluvial and hybrid DF events were different from those of GLOF and glacial DF (Fig. 2). There was no long-term trend in their frequency which mostly followed variability in warm season precipitation (Fig. 2b). Q50 of daily rainfall triggering DF were calculated as 22–28 mm day−1, depending on catchment. Probability of JJA daily precipitation of 15–35 mm increased in 1961–1990 (peaking in 1961–70) but this is not directly reflected in the DF record (Fig. 5b). The lowest probability was in the 1930s when DF frequency was at its lowest (Fig. 2b) although the quality of observations may be a factor.
The main identified trend was the expansion of pluvial and hybrid DF to higher elevations, i.e. 2500–3600 m a.s.l. in 1991–2020 in comparison with the earlier years when data quality was equally reliable (Fig. 3). This change can be attributed to the earlier onset of snowmelt in the middle mountains and to an increase in rainfall (as opposed to snowfall) in late spring and early summer. There are statistically significant trends in the timing of snowpack disappearance (Fig. 9) and in the number of days with rainfall in excess of 10 mm per day at Mynzhylki (3010 m a.s.l.) for the 1937–2021 and at Tuyuksu (3438 m a.s.l.) for the 1972–2021 periods in June. Rainfall in excess of 10 mm per year was registered on average on 4 and 5.5 days at Mynzhylki in 1961–1990 and 1991–2021, respectively. In May, the overall number of days with rainfall increased from an average of 7.3 in 1961–1990 to 13.5 in 1991–2021 and while low rainfall events usually do not trigger DF directly, they contribute to the saturation of soils especially in combination with snowmelt.
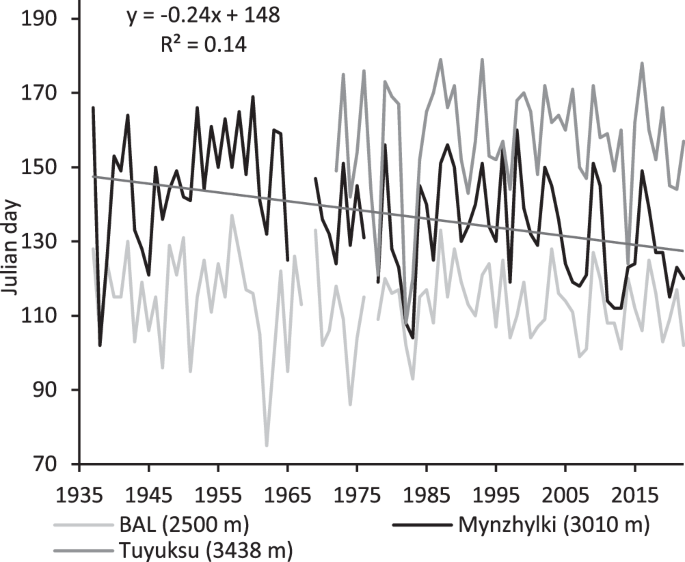
Straight line and the equation illustrate linear trend at Mynzhilki station. Trends at the BAL and Tuyuksu stations are not statistically significant at 95% confidence level.
To date, DF frequency in the marginal (March–April) months remained low but in 2020, as precautionary measure, KSAMP extended its active DF season, when both monitoring is conducted and rescue service is put on alert, to March–September.
The following conclusions can be made about spatio-temporal trends in different types of DF and their climatic drivers in the northern Tien Shan. Firstly, the frequency of GLOF and GLOF-related DF did not change with the observed climatic warming and glacier retreat. Secondly, frequency of glacial DF was affected by climatic variability and increased in response to strong positive temperature anomalies in the past. However, it has declined following the observed glacier retreat in the last two decades. Thirdly, frequency of pluvial and hybrid DF was controlled by variability in precipitation and did not exhibit long-term linear trend. However, the upper boundary of DF occurrence has extended upwards in response to increasing temperatures and frequency of liquid precipitation, and earlier onset of snowmelt.
The observed reduction in frequency of GLOF and GLOF-related DF does not imply that this trend will not change. Future projections of glacier lake formation in the northern Tien Shan showed that potential for GLOF remains high31,32,57. The response time of GLOF to climatic warming and lake formation and evolution implies that they may become more frequent later in the 21st century11. High-elevation heatwaves may contribute to their formation as shown by GLOF-related and glacial DF observed in the extremely hot July 2015 (El Niño year). Monitoring and expanding lake management measures beyond the Ile Alatau is necessary to prevent GLOF and protect expanding population and infrastructure. Artificial drainage of lakes helps alleviate the risk of GLOF although only in the short-term47 and planning of land use and development, taking into account locations and characteristics of the present-day lakes, future lake projections, and rates of glacier retreat31 is required to reduce risks in the long-term.
Prevention of pluvial and hybrid DF is challenging due to their high frequency and wide extent. Risk is mitigated through expensive engineering interventions, mostly in the central Ile Alatau and to a lesser extent elsewhere but nature-based solutions for slope stabilization61 may be applied too. Many DF occur repeatedly in the same locations. Expanding the developed georeferenced database of DF (as opposed to general zonation of DF risks) beyond the central Ile Alatau will help local authorities to implement these measures, as was pointed out at the stakeholder workshops. New methods of rainfall forecasting for complex terrain in combination with a wider range of thresholds representative of different types of DF and regions52 may help improve DF forecasts. In 2019, a wider network of rain gauges providing hourly precipitation data was installed in the central Ile Alatau. Generating spatially distributed snowmelt data and expansion of rainfall monitoring will help improve data analysis, early warnings, and forecasts of DF.
Future trends in DF depend on changes in intense rainfall, availability of unconsolidated material, and slope stability. Frequency of pluvial and hybrid DF events is expected to increase in the mountains of Central Asia46. Continuing glacier retreat and increases the abundance of surficial materials are likely to create new source areas of DF formation. The duration of the rainfall season and the amount of rainfall are projected to increase in the Tien Shan. The former has already been registered, however, uncertainties in projections of precipitation and especially short and intense rainfall, are large. These factors increase exposure of local communities to the pluvial DF hazard. A targeted adaptation programme is required and it will benefit from the reliable observational data, forecasts, and future projections, improving resilience in the region.
Methods
Study Area and DF characteristics
The study region (Fig. 1) is characterised by strong elevation gradients with mountain peaks reaching 5000 m a.s.l. In the mountains, positive temperatures are observed between May and September depending on elevation. Precipitation maximum occurs in April–May in the foothills shifting towards May–July in the mountains, where snow accumulation peaks in spring. The snow and glacier melt period is May–August extending to September in individual years. Runoff peaks in the warm season, due to snowmelt in May–July and glacier melt in July–August. The observed climatic warming has been particularly strong in spring and autumn extending the seasonal duration of positive temperatures43.
Glaciers occupied 565 km2 and 465 km2 in the Ile-Kungey Alatau in 2008 and in Jetysu Alatau in 2011, respectively29. There are numerous glacial lakes—about 640 in the Jetysu and over 150 in the Ile Alatau and their abundance is increasing31,32. All lakes are moraine- or rock-dammed and there are no ice-dammed lakes in the region. Over 50 lakes were classified as dangerous in the Jetysu Alatau and 17 in the Ile Alatau22,31,32,34.
Historical earthquakes affected distribution of landslides and DF in the region. The powerful earthquake which occurred in 1887 resulted in GLOF and multiple DF across the study area41. Extensive sediment deposits formed and slope erosion intensified generating potential detachment points and increasing the likelihood of future landslide and DF formation. In particular, the collapse of slopes of Mount Akzhar in the Aksay catchment created a landslide covering an area of 0.5 km2 and screes which, until present, are active sources of DF. There is evidence of catastrophic DF resulting from a lake outburst attributed to an earthquake and dated to 20,000 B.P. in the UA catchment41.
Four types of mechanisms of DF formation are distinguished (Table 2). While GLOF and DF they cause are mitigated in the Ile Alatau, the non-GLOF DF serve as natural indicators of impacts of climate change and variability although impacts of anthropogenic changes (development of the region and changing land use) cannot be excluded below approximately 2500 m a.s.l.
Assessing needs of stakeholders through the stakeholder-engagement workshops
Two stakeholder-engagement workshops were held to assess the needs of practitioners, build upon their expertise, and co-produce the outputs. A workshop ‘Modelling future glacial lakes and their morphometric parameters in the Ile, Kungey and Jetysu Alatau’ coordinated by the KSAMP was conducted in Almaty, Kazakhstan in August 2018 and attended by 24 stakeholders, predominantly representatives of local authorities and regional divisions of the risk-reduction agencies. Answers to two specific questions posed in the survey – ‘How information about glacial lakes and related hazards can be best delivered to stakeholders?’ and ‘Which other information about hazards will be useful for practitioners?’—showed that there is a strong need for an open and easily accessible georeferenced database of not only major GLOF but less impactful but still damaging and, importantly, frequent events such as non-GLOF DF. The participants stressed that data on locations, dates, and frequency of DF will be used by the local authorities and planning agencies especially when designing local projects including activities in tourism industry. The need for an app, enabling calculation of meteorological indices and statistics relevant to DF formation and indicating likelihood was also stressed. The prototype of the database was presented and approved at a workshop ‘Improving preparedness and reducing vulnerability to debris flow in Central Asia’ conducted in Tashkent, Uzbekistan in March 2021 and attended by 18 participants including representatives of the risk-reduction agencies, National Hydro-meteorological Services (NHMS) of Uzbekistan and Kazakhstan, and researchers from Central Asia. An application, DF-Met, enabling statistical analyses of meteorological data was developed using C#, presented at the workshop, and made available to the stakeholders. Representatives of the NHMS, however, stressed that it was not possible to provide open access to meteorological data which should be obtained from NHMS directly.
DF data homogenisation and compilation of the database
GLOF and DF statistics were obtained from two main sources: (i) the database maintained by KSAMP (partly digitised) and (ii) Anthology of Debris Flows in Southeast Kazakhstan41 (non-digitised). The latter is partly derived from the KSAMP database, however, the two sources were complementary: the Anthology42 did not utilise all available KSAMP resources but used extensive research materials amassed at the Kazakhstan Institute of Geography and Water Resources. The original KSAMP database provided dates of DF occurrence, location of initial mobilisation points (with varying degree of accuracy), DF type according to the triggering mechanisms, and category (magnitude) of events based on the reported damage.
A database of events recorded in the two sources was compiled in digital format and repetitions were removed. In addition, historical documents including field records and reports held at KSAMP (including its regional divisions) and the Institute of Geography and Water Resources, local academic and media publications were used as auxiliary materials following the recommendations for the development of historical databases50. We particularly focused on the days with or preceded by the heavy precipitation and heatwaves searching the archival and published documents for the reports of DF events around these days.
GLOF and GLOF-related DF were thoroughly documented in the KSAMP records. KSAMP holds documents detailing characteristics (including any hazardous events and implemented preventive measures) of each lake identified as dangerous in the region and of most other lakes in the Ile-Kungey ranges. However, in the original KSAMP database and in the Anthology42, georeferencing of other types of DF was often imprecise. For example, in the pre-1980s KSAMP records and throughout the Anthology42, the location of the non-GLOF DF was given as a sub-catchment (i.e. tributaries of the main rivers) included approximate elevations and recognisable features (e.g. mountain peaks, lakes, settlements, bridges, etc). These descriptions enabled initial positioning of the DF events within an approximately 1 km2 area. In the KSAMP records and in the Anthology42, DF were not categorised in a consistent way. Glacial DF were identified as a separate type until the 1990s when this category was abolished and DF were recorded either as GLOF-related or hybrid events (which have different triggers and thresholds).
The compiled DF data were georeferenced; GLOF-related DF for the whole study area and non-GLOF DF for the central Ile Alatau (Fig. 1). If the exact locations of DF mobilisation points were not available or were spurious, the auxiliary materials (historical aerial and satellite imagery; reports of field surveys) were used to determine locations of the DF formation centres—eroded areas supplying material for the identified DF62.
Following georeferencing, the records of GLOF-related DF across the region and non-GLOF DF in the central Ile Alatau were homogenised: the DF events were re-classified by consistently applying the criteria defining their types (Table 2) to the meteorological conditions leading to their formation (daily precipitation and air temperature data from the regional meteorological stations were used), locations, and characteristics of the mobilization points62.
The final digital catalogue contained 55 georeferenced GLOF and related DF events and 60 glacial DF registered in the Ile-Kungey and Jetysu Alatau (Fig. 1) in the 1887–2020 and 1931–2020 periods, respectively; and 303 georeferenced non-GLOF DF registered in the central Ile Alatau (Figs. 1, 4) in the 1931–2020 period. The exact locations of 40 mobilisation points of non-GLOF DF events were not established although in each case, river sub-basin in which the events occurred was known. The catalogue included coordinates, elevation, date of occurrence, type and category of event, meteorological data for the day of the DF and the selected antecedent period, and in the case of GLOF, details of lake management. The homogenised data were presented as an online database developed using ArcGIS Pro version 2.7 (https://research.reading.ac.uk/glof-predicting-debris-flow/). The DF formation centres identified and discussed in a previous publication62 were also included.
The catalogue was used to assess statistics of DF and meteorological thresholds. Multiple DF of the same or different types occurred within a time period of several days in a single or multiple catchments. If an outburst from the same lake was recorded as lasting for two or more consecutive days, it was recorded as a single event and the day of the initial outburst was assigned. If GLOF were registered at more than one lake or there were more than one non-GLOF DF originating from different sources on the same day, they were registered as separate events for the purpose of DF statistics. The long-term temporal trends in frequency of the non-GLOF DF were assessed for the UA and KA catchments only because of the consistency in monitoring.
Meteorological data and thresholds
Daily rainfall, temperature and snow depth from three meteorological stations were used: BAL (2500 m a.s.l.) and Mynzhylki (3010 m a.s.l) for the 1937–2021 and Tuyuksu (3438 a.s.l.) for the 1972–2021 periods. The BAL and Mynzhylki data were obtained from the Kazakh National Hydrometeorological Service. The Tuyuksu station is run the Central Asia Regional Glaciological Centre Under the Auspices of UNESCO (Kazakhstan) where the data are held. At all stations, daily mean temperature values were calculated from the 3-hourly and snow depth from twice-daily measurements. Precipitation is measured twice a day at 09:00 and 21:00 h local time and daily precipitation totals refer to the period between 21:00 of the day when DF was registered and the previous day. Gridded data sets were not used because the central Ile Alatau is a relatively small region and, importantly, very steep elevation gradients significantly limit the ability of gridded data sets to resolve spatial variations in meteorological data46. A newly-developed application, DF-Met was used for statistical analyses of meteorological data.
Positive air temperature, precipitation and changes in snow depth were used to quantify thresholds leading to GLOF and DF formation. Snow density was not available for the duration of the records and, therefore, it was not possible to convert changes in snow depth to SWE. Sums of positive daily air temperature (degree day temperature; DDT), cumulative precipitation and changes in snow depth over 10-day (∑10) day antecedent periods leading to any given day with or without DF were derived. ∑10 was selected in line with previous studies41 and in addition, ∑20 was used to characterise response of GLOF to positive temperature anomalies. DDTs were calculated from the averages of daily mean temperatures recorded at the BAL and Mynzhylki stations to account for temperature change with altitude. They were not extrapolated to the elevations of detachment points because the application of a constant lapse rate does not provide any additional information helping to single out days with DF63. Averages of daily precipitation totals measured at BAL and Mynzhylki and the highest of two values were used to calculate cumulative precipitation.
Cumulative distribution functions (CDF) of ∑10 and ∑20 were generated for four DF categories and non-DF days and threshold non-exceedance probability was calculated as
where R is a rank of the value of either sum of DDT or cumulative precipitation in the ascendant period leading to any given day with or without DF (taken as day 1 of the cumulative period) and n is a total number of observations in the sample. ANOVA was used to assess difference between the samples for statistical significance.
Both rainfall and air temperature in the study area are characterised by strong seasonal variations which may exceed the differences between days with and without DF. CDFs of ∑10 and ∑20 were constructed for each day between 1 April and 30 September 1937–2021. While analysis of the whole data set provides information about the thresholds overall, the daily samples enable practitioners to assess the probability of threshold exceedance on a given day and the likelihood of DF occurrence.
Intensity-duration relationship
The intensity-duration ID relationships are quantified by the power law
where (I) is rainfall intensity and (D) is duration, and show water supply in mm day−1 over a corresponding duration. The ID relationships were defined for the pluvial DF events recorded in the KA and UA (151 events), and Aksay (141 events) catchments (Fig. 1) using the highest of the BAL and Mynzhylki measurements. To calculate ID thresholds, cumulative rainfall (mm) and cumulative average rainfall intensity (mm day−1) were calculated for each day of a 10-day period prior to each DF event (where Day 1 is day of the DF event)20. The maximum cumulative average intensity in the 10-day period was selected for each event representing maximum antecedent rainfall intensity. In the original application of this method developed for Norway20, rainfall intensity was combined with snowmelt. The absence of any other data but snow depth at the regional meteorological stations did not allow us to incorporate snowmelt in the ID equations which is a limitation of this study.
Responses