Decarbonizing urban residential communities with green hydrogen systems
Main
According to the International Energy Agency (IEA), the global energy sectors need to achieve net-zero emissions by 2050 to reach the target of limiting global warming to 1.5 °C in 21001. Currently, about one-third of global power is consumed in urban buildings2. The rapid deployment of clean energy technologies is a core pathway for transitioning urban building energy from fossil fuels to cleaner energy sources3. With surging energy demand caused by accelerating urbanization, growing evidence shows that planning centralized renewable energy production, including solar and wind farms outside the cities, faces significant constraints from technically feasible lands owing to their limited renewable energy density4,5. Thus, behind-the-meter community energy systems that support integrating household rooftop photovoltaic technologies will effectively reduce external energy demand from urban residential communities, thereby alleviating the land pressure associated with centralized renewable production6. In addition, a large body of research supports the notion that communities with coordinated action provide critical spatial, temporal and social pathways for integrating household renewable sources with local energy storage systems together using distribution technologies to realize higher economic, environmental and social interests in energy communities7,8. Therefore, an accelerated market introduction of community energy systems into urban areas is considered a pivotal option to utilize inner-city resources for decarbonizing cities.
Community energy systems powered by renewable sources depend on cost-effective energy storage technologies to address the severe energy mismatch caused by high homogeneous production and demand in urban residential communities9, requiring high efficiency for short-term extreme energy events and high capacity for cross-seasonal energy patterns10. Growing research shows that battery storage technologies, such as lead-acid batteries and lithium-ion batteries, excel in short-term energy storage owing to their high round cycle efficiency, whereas hydrogen storage technologies, such as pure hydrogen storage, adsorption storage and chemical storage, are more suitable for cross-seasonal energy storage owing to their high energy density11. Community green hydrogen systems, which employ both battery and hydrogen as storage options for household rooftop photovoltaic systems, provide enhanced storage flexibility by alternating short- and long-term storage media, thus benefiting long-term community sustainability12. The IEA report points out that advanced economies need to take the lead and reach net-zero emissions earlier to buy more time for the energy transition in developing economies1. However, the urban decarbonization efforts undertaken by the USA and Canada in North America fall far short of what is needed to achieve net-zero global energy-related carbon dioxide emissions by 205013. These nations must further explore the cost and potential of community green hydrogen systems as ‘emerging’ technologies for widespread commercial deployment in urban areas.
Energy models are widely used to understand the effects of energy systems on residential communities and inform potential development directions for energy planners14. However, academic and policy spheres highlight concern that deep uncertainties of energy input are fundamental modeling limitations for energy models, causing inappropriate assessment and adversely impacting policy targets when ignoring modeling limitations15. Part of energy input uncertainties stems from both climate conditions and human behaviors. In future periods, energy models will confront heightened challenges associated with the evolving climate conditions that result from continuing climate change16. Furthermore, these models frequently encounter difficulties in capturing the notoriously heterogeneous nature of human behavior17. The differing sources and propagation effects of uncertainties in climate–human systems present significant obstacles to effectively quantify their superimposed effects on energy systems. To address these issues, methods such as sampling18 and generative adversarial networks19 have been adapted to generate a wide range of energy input scenarios for modeling these uncertainties.
Besides climate–human systems, another significant source of uncertainties emerges from the community design layer, including community compositions and renewable energy levels. Community compositions account for different residential building types and their corresponding numbers within residential communities, whereas renewable energy levels represent the deployment numbers of energy systems within residential communities20. These two factors impact the diversity of energy input scenario types for energy models in the design phase, influenced by various geographical, sociological and psychological considerations. Current studies have considered that the uncertainties of the community design layer significantly impact the overall economic and environmental benefits of the community21,22,23. Thus, energy models must integrate detailed community design layers into energy planning. However, meeting this requirement poses a dilemma for energy models, navigating the delicate equilibrium between spatial dimensions and calculating tractability. To strike a balance between the diversity of household energy profiles with the robustness of urban energy planning, historical data-driven energy input scenarios24 and city-related virtual communities25 are developed.
System-deployment pathways of community energy systems in communities determine different household participation forms, highly affecting shared benefits and participation motivation among interconnected households26. Community green hydrogen systems, one of the promising community energy systems at a nascent stage, have unclear system-deployment pathways for their cost-effective expansion in complex urban communities. Thus, a high-fidelity energy model is essential for systematically analyzing the impacts of deployment pathways on these not-yet-large-scale deployed systems at the urban community scale. Unfortunately, existing energy models lack the capability to integrate multi-scale inputs from community systems, such as climate conditions, human behavior and community archetypes27. In addition, they face challenges in addressing the compound impacts of multi-source uncertainties at both the household and community levels28.
In this Article, we introduce a bottom-up energy model linking climate, human behavior, community archetypes and energy system models, aiming to ensure cost-effective deployment pathways of community green hydrogen systems for highly diverse urban residential communities. Figure 1 depicts a summary of three interconnected phases of the proposed energy model. First, we developed a multi-scale combined uncertainty approach to obtain a set of community energy production and demand profiles, including detailed household energy information with potential occurrence probability to reflect inevitable uncertainties from household and community layers. Next, we formulated three system-deployment pathways based on an urban planning perspective to characterize strategies for household collaboration within the community. These pathways were merged with community energy profiles to serve as community inputs to the energy system model related to green hydrogen systems. Last, the robust energy system model yielded a collection of optimal system designs that reflect the cost-effective impacts of deployment pathways on green hydrogen systems under multi-source uncertainties. We extensively investigated seven North American climate zones to understand the general and overall effects of deployment pathways on community energy system design.
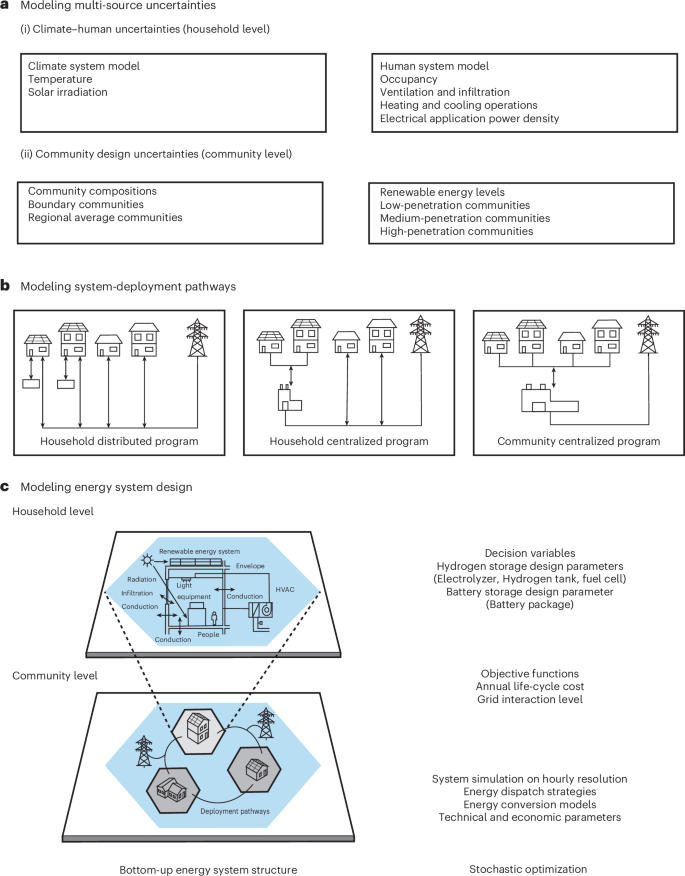
a, A set of community energy scenarios with 8,760 time steps is derived by applying multi-source uncertainties to a simple building simulation model. a(i), The climate–human uncertainties considered. a(ii), The community design uncertainties considered. b, Each household in the community energy scenario is connected using system-deployment pathways. c, The energy system is integrated into the community using a bottom-up approach. A comprehensive description of the model is presented in Methods.
Results
Impacts of multi-source uncertainty on energy scenarios
The USA and Canada are divided into eight standardized climate zones based on the American Society of Heating, Refrigerating and Air-Conditioning Engineers’ classification29. Most of their cities are located in the previous seven climate zones. The climate conditions and building regulations of cities within each climate zone are largely homogeneous. Thus, one sample of cities was selected from each climate zone to capture the typical regional energy performance. The community green hydrogen systems in these cities were evaluated using the developed energy model. To quantify the compounded impacts of multi-source uncertainties in urban communities, this study introduces these uncertainties into the bottom-up building energy modeling layer by layer, depending on their impact pathway in the energy calculation process. Thus, we begin by quantifying the impacts of climate–human uncertainties on energy input scenarios at the household level (details about climate–human uncertainties are presented in Methods).
Figure 2 shows the effect of multi-source uncertainties on energy input scenarios at the household level. Climate and human uncertainties show a more uneven and significant effect on the energy demand side rather than on the energy production side from the median and interquartile range perspective. This is because the energy demand side is influenced by a compound impact of climate and human uncertainties, whereas the energy production side is influenced by climate uncertainties only. On the energy demand side, the annual median household energy demand exhibits a valley-shaped pattern due to alternating heating and cooling demand as climate zones progress backward with varying interquartile ranges. Vancouver demonstrates the lowest median energy demand with a narrower interquartile range at the bottom of the valley due to minimal heating and cooling demands, whereas Miami and Edmonton exhibit higher median energy demand values and wider interquartile ranges at the top of the valley due to their respective highest cooling and heating demand. In addition, climate and human uncertainties notably influence more on the high-energy-demand scenarios, including climate zones and urban community structures. On the energy production side, the median annual household energy production decreases as climate zones progress backward, with a nearly uniform interquartile range. Miami and Edmonton have the highest and lowest energy production performance, respectively.

a,b, The distribution of annual energy demand (a) and annual cooling and heating demand (b) in seven cities. c, The distribution of monthly peak energy demand for Edmonton. The annual energy production and the monthly peak energy demands for other cities are shown in Supplementary Note 9. The annual energy data are recorded on an hourly basis. OB and TB represent boundary community samples consisting of bungalows and two-story houses, respectively. Heat and cool refer to heating and cooling demand, respectively. Box plots are created using a dataset with 1,000 samples. The central box shows the interquartile range, with the median shown as a line and the mean depicted as a rectangular shape within the box. The lines indicate the maximum and minimum values excluding outliers, and the dots represent outlier data points.
Source data
We then superimpose the effects of community design layer uncertainties onto the energy input scenarios at the household level using a community characteristic matrix that integrates household and prosumer scales (detail about community design layer uncertainties is presented in Methods). The household scale represents the clustering process of boundary and average community energy scenarios from previously obtained input scenarios, whereas the prosumer scale denotes the labeling process of independent households as prosumers or consumers within obtained community samples. Figure 3 shows the impacts of multi-source uncertainties on the energy input scenarios at the community level, depicted using the electrical self-production rate. The electrical self-production rate reflects the expected potential for energy self-sufficiency of independent households within community samples.

a, The distribution of monthly electrical self-production rates (monthly ESR) in Edmonton (Climate Zone 7). b, The impacts of climate uncertainties on the distribution of annual electrical self-production rates (annual ESR) for energy demand behavior from low to high in Edmonton (Climate Zone 7). c, The effects of human uncertainties on the distribution of annual electrical self-production rates (annual ESR) for weather temperature from hot to cold in Edmonton. d, The compound impacts of climate and human uncertainties on the distribution of annual electrical self-production rates (annual ESR). The results for other cities are shown in Supplementary Note 9. The electrical self-production rate above 1 means energy production exceeds energy demand and vice versa. OB and TB represent boundary community samples, which are composed of bungalows and two-story houses, respectively. By contrast, Ave represents regional characteristic samples, which are composed of regional-average building stock data. In the box plot, a–d are created using a dataset with 1,000 samples, 20 samples, 50 samples and 50 samples, respectively. The central box shows the interquartile range, with the median as a line and the mean as rectangular in the box. The lines indicate the maximum and minimum values excluding outliers, and the dots represent outlier data points.
Source data
The change patterns of monthly energy self-sufficiency rate shift from valley-shaped patterns to ridge-shape patterns as climate zone moves back. The lowest monthly electrical self-production rates always occur during periods of peak energy demand. In hot climate zones, the lowest monthly electrical self-production rates occur in summer, indicating that seasonal energy transitions happen from spring to summer in these regions. By contrast, in moderate or cold climate zones, the lowest monthly electrical self-production rates occur in winter, indicating that seasonal energy transitions happen from summer to winter in these regions.
The effects of climate uncertainties and human uncertainties on annual median electrical self-production rates differs when single-factor uncertainty is considered. The effects of climate uncertainties on the annual median electrical self-production rates gradually increase as the energy demand behaviors of human scenarios shift from low to high. This suggests that households with higher energy consumption are more affected by climate uncertainties. In addition, the effects of human uncertainties on the annual median electrical self-production rates are not homogeneous as weather temperature in climate scenarios changes from hot to cold. This is due to annual energy demand, which is a key factor influencing the annual median electrical self-production rates, which depends on the relative change in heating and cooling demand when weather temperature varies.
The annual median electrical self-production rates in all community samples exhibit a ridge-shaped pattern across all climate zones under the compound effects of climate and human uncertainties. Vancouver shows the highest electrical self-production rate at the peak of the ridge, whereas Miami and Edmonton exhibit lower electrical self-production rates at the base. In addition, electrical self-production rates within the cities show a consistent decreasing trend among the three community samples, with bungalow community samples exhibiting the highest electrical self-production rates, followed by average community samples and two-story community samples. This pattern suggests that energy demand plays a dominant role in shaping electrical self-production rates across various climate zones, regardless of energy production levels, such as the higher energy production in Miami and lower energy production in Edmonton. However, we also observed that the annual peak electrical self-production rates vary among cities. Despite this, the peak value in moderate climate regions is higher than in extremely hot or cold regions. In addition, within urban communities, the climate zones to which the city belongs exert a more substantial influence on electrical self-production rates than the internal community archetypes.
Effect of system-deployment pathways on energy affordability
The community green hydrogen systems in North American cities were assessed using an energy model that provides all the non-dominant sets of optimal system designs for initial commercial-scale deployment via Pareto front analysis. Our analysis centers on how different deployment pathways of energy systems affect energy affordability of urban communities, measured as levelized cost of electricity (LCOE) calculated from compromise solutions of system design options for each group. The primary approach for decision-making from the Pareto front utilizes the Euclidean-distance-based method LCOE provides a levelized present price per unit energy value, making it suitable for comparing differences in the cost of system energy generation across various urban residential sectors and deployment pathways. Figure 4 shows the effects of three deployment pathways on potential changes in LCOE in the seven selected cities. Two key insights emerge.

a–g, The impacts of HDP, HCP and CCP on LCOE for Miami (a), Houston (b), Las Vegas (c), Vancouver (d), Toronto (e), Montreal (f) and Edmonton (g). OB and TB represent boundary community samples, which are composed of bungalows and two-story houses, respectively, whereas Ave represents regional characteristic samples, which are composed of regional-average building stock data. With each plot, the community characteristic matrix in each city includes three types of household scale and their respective five prosumer scales. The LCOE is expressed in Canadian dollars (CA$).
Source data
First, as observed from a horizontal perspective, household distributed program (HDP) follows a small upward trend as the prosumer scale increases within an equivalent household scale in all urban community cases. By contrast, household centralized program (HCP) and community centralized program (CCP) show the opposite trend, decreasing significantly. This is due to the fact that with more household participation, HDP faces resource congestion caused by household competition, resulting in greater costs, whereas HCP and CCP can fully utilize the scale effect of household cooperation to reduce costs. Additionally, the similarity in the LCOE change trend across all cities indicates that climate zones have a trivial impact on the ways in which the three deployment pathways affect LCOE, although LCOE tends to be lower in moderate climate zones compared to hot or cold climate zones. Furthermore, the increased rate of LCOE in HDP has remained relatively stable as the prosumer scale increases, whereas the decreased rate of LCOE in HCP and CCP gradually slows down. This indicates that despite increased household participation, the increased resource congestion in HDP does not accelerate cost deterioration, whereas the advantages of scale economies in HCP and CCP gradually diminish.
Second, as observed from a vertical perspective, the LCOE of different household scales within each deployment pathway decreases in the order of bungalow boundary, regional-average and two-story house boundary community samples across all urban community cases. This reveals that urban communities with high electrical self-production rates bring more cost advantages regardless of climate zone and deployment pathways. Additionally, in all city samples, HDP and HCP demonstrate a greater cost advantage compared to CCP at a 20% prosumer scale under the same household scale. With a prosumer scale exceeding 40%, both HCP and CCP demonstrate a cost advantage. Notably, HCP outperforms CCP across different city samples, and the performance gap between the two pathways narrows as the prosumer scale increases. The difference shows that consumer scale can contribute to the cost burden, which decreases as consumer scale decreases. HCP shows better cost advantage than HDP and CCP at low prosumer scale in certain cities, such as Houston, Las Vegas and Vancouver. However, the cost benefits diminish as more households with low electrical self-production rates join. This is attributed to the fact that consortia of households with high electrical self-production rates can readily export energy for profit through scale effects, thus reducing energy costs. Therefore, it can be concluded that HDP and HCP approaches are suitable for low-participation communities, whereas HCP and CCP are more appropriate for high-participation communities.
Analysis system design costs on energy affordability
System design costs are the primary driver for changing the LCOE of community green hydrogen systems. A quantitative understanding of the effects of the three pathways on system design costs is essential for evaluating how these pathways influence LCOE. Here we now examine the impact of deployment pathways on the system design costs to account for our previous findings on LCOE changes. Figure 5 illustrates the potential household system cost changes under three types of deployment pathway across the seven selected cities.

a–e, The changes of system design costs under three deployment pathways for Miami (a), Houston (b), Las Vegas (c), Toronto (d) and Edmonton (e). f,g, LCOE change ratio and changed LCOE at a 10% decrease in system design costs in Edmonton (Climate Zone 7). OB and TB represent boundary community samples, which are composed of bungalows and two-story houses, respectively, whereas Ave represents regional characteristic samples, which are composed of regional-average building stock data. The positive value in f signifies that the change in direction between system component costs and LCOE is consistent. The results of other cities are in Supplementary Note 9.
Source data
First, we find that the changes in system design costs align with the variations in LCOE observed across the three pathways. HDP in all cities has resulted in a slight increase in system costs as the prosumer scale increases. The decline in consumer energy demand within the community has prompted prosumers operating under the independent pathways to transition to larger system designs and reduce community energy trades. Consequently, this has resulted in a slight increase in LCOE. By contrast, both HCP and CCP have a significant effect on reducing household system design costs as the prosumer scale increases. The substantial increase in energy storage demand significantly expands hydrogen storage in these two cooperation pathways. This shows that cheap hydrogen tanks replace a significant portion of batteries in energy storage as the scale increases. Therefore, hydrogen storage becomes a primary system design factor in reducing the LCOE for HCP and CCP.
Second, we notice that higher energy storage demands lead to a higher hydrogen storage ratio, leading to lower LCOE when comparing system design costs at the same household scale across the three pathways. This is because the advantage of scale in hydrogen costs offsets the drawback of linear increases in battery storage costs as energy storage demand increases. In the initial phase, both HDP and HCP demonstrate higher energy storage demand than CCP, resulting in a higher hydrogen storage ratio and better LCOE performance. However, as the prosumer scale increases, the higher storage demand leads to an inevitable growth in the hydrogen storage ratio for both HCP and CCP. Meanwhile, the storage structure limitations of HDP result in its hydrogen storage ratio remaining nearly constant, ultimately causing it to be quickly surpassed by HCP and CCP in LCOE performance. This can be further justified by the trivial difference across different household scales within the same pathway, where the hydrogen storage ratio decreases slightly along bungalow, regional-average and two-story house boundary samples owing to the decrease in energy storage demand.
Third, we find that the effects of changes in system design costs on LCOE varies across three pathways when adjusting system component prices. HDP is particularly susceptible to fluctuations in system costs. Similarly, HCP is also particularly sensitive to system costs when the prosumer scale is small, but this sensitivity gradually diminishes as the prosumer scale increases. CCP, by contrast, is less affected by system costs, although the impacts of system costs do gradually increase. This also highlights the proportional relationship between system design costs and annual life-cycle costs. Therefore, system design costs are the most important factor in LCOE changes for HDP and HCP. Furthermore, the potential for system cost changes to influence LCOE change patterns is negligible across the three pathways, demonstrating that adjusting system component prices has minimal impact on system design parameters. We conclude that whereas uncertainties in system design costs may influence the LCOE values for the three pathways, they do not alter the fundamental trend of LCOE.
Discussion
System-deployment pathways of community energy systems are increasingly important for stimulating community participation because the decentralized nature of these systems provides community households, as critical stakeholders, with more avenues for engagement in future energy communities30. However, conventional energy models fail to consider the impacts of varying deployment pathways on diverse communities, risking inaccurate estimates of community participation scales31. In this work, we built a bottom-up energy model that established links between energy systems and local urban communities, incorporating necessary technological details related to climate, human behavior, building archetypes and energy system characteristics. This energy model is applied to the role of system-deployment pathways in developing cost-effective community green hydrogen systems for diverse urban residential communities from a design and operation perspective. The evaluation results will complement critical market participation information to inform fully potential expansion pathways to energy planners.
Our study shows that for urban communities utilizing behind-the-meter community green hydrogen systems, differences in community electrical self-production rates, influenced by climate zones and community types, significantly impact the overall value of energy costs rather than their change trend under different deployment pathways. Energy costs are lower in moderate climate zones than in extremely hot or cold ones. Additionally, community samples with high electrical self-production rates consistently exhibit lower costs relative to those with low electrical self-production rates at the deployment pathway. These findings underscore the potential for communities characterized by high electrical self-production rates and moderate climate zones to attain low energy costs.
Our study underscores the critical importance of selecting the right deployment pathway for achieving cost-effective decarbonization by community green hydrogen systems in urban communities, with impacts consistent across all climate zones. The cost differential between the best and worst pathways for the same household scale can be as high as 60%. A household centralized program stands out as the preferred deployment pathway for most communities, consistently driving cost reductions by harnessing scale effects. In communities with low prosumer scale, household distributed programs may demonstrate better cost advantages initially, but as prosumers increase, resource competition escalates, leading to higher energy costs. Conversely, community centralized programs are better suited for communities with high prosumer scales, where consumer scales always significantly negatively impact on energy costs.
Our study shows that variances in energy storage demands across different deployment pathways serve as the principal determinant of their respective energy cost trends. In community green hydrogen systems, increased energy storage demands trigger a scale effect in hydrogen storage costs, consequently mitigating system design costs. Our findings indicate that household centralized programs exhibit higher energy storage demand than household distributed programs and community centralized programs, demonstrating greater cost advantages in most communities. This underscores the critical importance of incorporating more prosumers in the design of deployment pathways to expand energy storage demand. In addition, our study shows that household distributed and centralized programs are more sensitive to uncertainties in system design costs than community centralized programs. Although these uncertainties may impact the energy costs for all three pathways, they do not alter the fundamental trend of energy costs.
There are several essential avenues for expanding upon this work. Extending our research to include future climate periods beyond 2050, such as those projected for 2050–2100 under representative concentration pathway 8.5, would offer valuable insights into the long-term performance of various system-deployment pathways for green hydrogen systems16. This extended analysis would help anticipate and address the challenges posed by further worsening climate change, including ongoing shifts in climate patterns and increased frequency of extreme climate events. By examining deployment strategies across a broader range of future climate conditions, we can better understand their cost effectiveness and resilience, ultimately informing more robust and adaptive energy transition strategies. Additionally, expanding discussions on developing community green hydrogen systems to include social justice and ethical concerns is crucial, as energy policy and technology decisions impact communities in diverse ways beyond technical feasibility and cost effectiveness32. Energy inequalities arising from the energy transition can exacerbate disparities and hinder access to opportunities for specific communities within the energy market33. Future studies can integrate social concerns into energy models to enhance our understanding of the deployment pathways needed to support equitable and inclusive urban energy transitions, ensuring that the benefits of green hydrogen systems are accessible to all urban communities.
Finally, the quantitative results can be mapped to other global cities that are similar to the studied North American cities in terms of climate zones and electrical self-production rates. Nevertheless, even without direct mapping, the proposed energy model can conduct practical quantitative analyses based on local climate and community conditions.
Methods
Analytical approach
This study aims to explore the impacts and implications of system-deployment pathways on deploying cost-effective green hydrogen energy systems for different urban communities. Therefore, energy system design should cover all potential community energy input scenarios subject to multiple uncertainties to ensure robust and optimal outcomes. However, climate change exhibits a distinct probabilistic nature, that is, extreme climate conditions are significantly less likely to occur than typical ones. The energy input scenarios should reflect this variability in weather probabilities to ensure reasonable realism. Therefore, we use stochastic optimization to formulate and integrate the objective function into the energy model34. In this process, each energy scenario is treated independently, and then their results are combined based on the probability of occurrence to obtain the mathematical expectation of the outcome.
The overview of modeling multi-source uncertainties
Energy models are subject to inherent input parameter uncertainties derived from complex real-world communities. It is crucial for energy models to transparently disclose the impacts of community uncertainties on energy system inputs and provide reliable energy input scenarios for subsequent evaluation. Parameterizing the compound impacts of these uncertainties on energy input scenarios for the energy model is challenging owing to the complexity of sources and the differences in their influence pathways. Thus, we distinguish the community uncertainties into two levels: climate–human uncertainties at the household level and community design layer uncertainties at the community level (Supplementary Note 1). As a bottom-up energy model, we quantify uncertainties layer by layer from the household level to the community level and superimpose them to quantify compound impacts.
Modeling climate–human uncertainties
To parameterize the climate–human uncertainties at the household level, we distinguish climate and human systems into two treatments based on their different sources. We then associate them into compound scenarios to account for their superimposed impacts on energy input. Climate uncertainty stems from the unpredictable nature of climate period paths and their corresponding extreme weather events, leading to the loss of potential risk information on weather-dependent energy production and demand in defined climate scenarios35. Current climate change further increases uncertainty, exacerbating climate risk to energy systems due to the increasing frequency of extreme climate events and ongoing shifts in climate patterns36. Thus, we developed a method to synthesize future representative weather datasets based on regional climate model data to capture potential climate uncertainty information related to weather patterns and extreme weather events (Supplementary Note 2). This method can derive an arbitrary number of stochastic hourly resolution weather data to decrease the simulation time without destroying month-scale weather features. Thus, this method maximizes our ability to generate enough weather data to measure climate uncertainty information and then trims these data to representative weather scenario sets with occurrence probabilities, which facilitates compatibility with stochastic energy system optimization.
Human uncertainty comes from the complex stochastic nature of human behavior and their interaction with energy systems in which the greater control freedom for the residential occupants makes the uncertainty of energy demand profiles even more significant. Deterministic occupant behavior variables not only lead to overestimating or underestimating energy demand profiles at the household level but also decrease the diversity of energy demand profiles at the community level. Thus, in human systems, we sample human-related operational information from assumed probability distributions and parameter ranges based on urban statistical data, ignoring the behavioral logic of the occupants17. We explore seven aspects of human behavior uncertainties that affect building energy demand profiles. These features encompass the full range of human-involved operational parameters in building energy simulations. Owing to the aleatory nature and weak relationship of uncertainty from approach, we specified independent probability functions and then drew random samples from these features using Latin Hypercube Sampling37,38 (Supplementary Note 3). We specify uniform distribution as probability functions to equal probabilities of each interval in uncertainty variables because there is no explicit reason to value one probability distribution over another. Meanwhile, we extracted the boundary of these variables from the urban residential energy surveys39. Every random human behavior scenario was then associated with each climate scenario to create a compound scenario pool to treat the uncertainties in both climate and human properly.
In this study, we created seven sets of composite climate–human uncertainty scenario pools in North America (climate zones 1–7), where each scenario pool yielded a total of 20,000 household-level production and demand profiles, that is, 20 climate scenarios and 1,000 human scenarios.
Modeling regional household benchmark buildings
Besides climate–human scenarios, an urban residential archetype is crucial in generating household energy scenarios using dynamic energy simulations. We extracted physics-based benchmark building models based on local urban information: urban building survey data and building standards of climate zones (Supplementary Note 4). In this study, we created a set of benchmark bungalows and two-story houses in each city for aggregating artificial urban communities. We combined building information modeling and building energy modeling to generate household energy scenarios systematically. Specifically, building information modeling crafts benchmark archetypes with level of detail 2, incorporating fundamental construction information such as building typologies, floors, roofs, external walls and windows, all sourced from urban building surveys. Concurrently, building energy modeling analyzes building energy output by associating benchmark archetypes and climate–human scenarios. This process incorporates energy characteristic factors such as envelope construction, internal loads, heating, ventilation and air conditioning systems and renewable energy systems, with specifications adhering to building standards within the local climate zone. Once completed, the EnergyPlus engine executes energy simulations to analyze hourly resolution dynamic energy performance.
Modeling community design layer uncertainties
Parameterizing uncertainties within the community design layer in bottom-up energy models entails creating detailed community models that encompass the full array of urban community features. Extracting community samples from cities to parameterize uncertainties falls into a dilemma between scenario scopes and feature completeness due to the intricate nature of urban community features. Owing to the lack of boundary samples, the representative samples derived from regional-average community features may not provide complete uncertainty information for extrapolation to all urban communities. Thus, we create a set of artificial communities using a community characteristic matrix: household scale and prosumer scale. The household scale quantifies uncertainties in community composition using boundary and mean urban community features, whereas the prosumer scale accounts for uncertainties in renewable energy using linear scale expansion. These matrix parameters define the boundary and node samples to mimic community feature information, which provides fully quantitative information on community design layer uncertainties. In this study, the community scale was assumed to be 50 households. Each community characteristic matrix for the local climate zone considered three types of household scale and five sets of prosumer scale.
The community design layer uncertainties were parameterized in two sequential generation layers (Supplementary Note 5). In the household layer, we generated household energy scenarios based on uncertainties and benchmark buildings at the household layer. Subsequently, in the community layer, we clustered the household energy scenarios into labeled community energy scenarios for subsequent energy system optimization. We designed a total of 100 labeled community energy scenarios for each city, that is, five labeled community scenarios for each climate scenario and a total of 20 climate uncertainty scenarios.
Modeling system-deployment pathways
From a government planning perspective, we model three system-deployment pathways that coordinate households into energy community, including household distributed programs, household centralized programs and community centralized programs40. These potential community collaboration programs govern energy allocation and trades to ensure effective and equitable energy flows among households in their local communities. This requires that energy models include energy dispatch strategies and pricing mechanisms under different system-deployment pathways. To distinguish the roles of households clearly in energy models, we defined intra-household layers and intra-community layers based on control logic relationships rather than physical relationships. The intra-household layers refer to energy interactions between modules within the system, whereas the intra-community layers refer to energy interactions between different systems. Consequently, energy dispatch strategies are present in both layers, whereas pricing mechanisms are exclusive to the intra-community layers.
We detail energy dispatch strategies using a two-stage logical framework, which defines energy flow structure in intra-household layers and energy sharing structures in intra-community layers from the rational household perspective (Supplementary Note 6). In this study, our analysis of multiple deployment pathways focuses on intra-community layers that reflect collaborative solutions in local community energy markets. Thus, each deployment pathway features the same energy flow structure but differs in energy sharing structure. The energy flow structure in three deployment pathways identifies 12 operating states of the intra-household layer to manage energy flow hierarchy in system modules under varying module capacity and power states, with the goal of eliminating module interference. To exploit the storage advantages of the community green hydrogen systems in large storage capacity and long timescale, we managed the battery module as a short-term energy storage option and the hydrogen module as a long-term energy storage option. Energy sharing structures are used to govern the energy trade methods between prosumers and consumers in the intra-community layer. These structures distinguish trade entities based on ownership of energy systems and trade paths based on internal energy sharing pricing. Household distributed programs describe prosumer-owned deployment pathways, which specify each prosumer as an energy trade entity with a three-layer trade path. Household centralized programs describe prosumer-grouped deployment pathways, which combine all prosumers as energy trade entities with a two-layer trade path. Community centralized programs describe community-owned deployment pathways that coordinate all households as energy trade entities with a one-layer trade path.
The pricing model is essential for determining energy sharing pricing between buyers and sellers in intra-community layers to facilitate energy sharing. We utilize the terms ‘buyers’ and ‘sellers’ to delineate household roles in the pricing model, as prosumers may adapt their behaviors to function as either sellers or buyers based on their net energy profiles. We assume that all sellers have equal privilege and are equally influential participants within the energy communities, implying that all sellers should collectively determine energy sharing prices. In accordance with the basic principles of economics, disparities in demand response can result in price fluctuations. This signifies that the market price for buyers favors the electricity sale price, whereas the market price for sellers favors the electricity purchase price. Thus, we use a dynamic internal pricing model that uses local feed-in tariffs to define trade prices using the production and demand ratio of shared energy and price boundaries. Further details can be found in ref. 41. To maintain consistency with the time resolution of the energy model, the internal prices of the pricing model are adjusted in tandem with the hourly production and demand ratio within the boundary limitations. Moreover, the predicted time horizon of the pricing model is set to one hour ahead, with local electricity prices acting as the benchmark prices42,43. In this study, electricity sale prices were assumed to be 70% of electricity purchase prices. Notably, we disregarded the energy price fluctuation and local government price incentives during the operating cycle of the energy model.
Outline of green hydrogen systems in urban communities
As in refs. 44,45, energy systems, long-term climate resilience systems designed for urban communities, must be considered cross-seasonal and large-capacity energy storage due to the high homogeneity of households in both energy production and demand. Compared to conventional battery storage systems46, community green hydrogen systems provide higher storage and operation flexibility, which can schedule multi-storage resources in the most efficient way to address uncertainty, especially during extreme energy events. Specifically, community green hydrogen systems can achieve synergistic benefits from both the superior efficiency of battery storage and the high energy density and low leakage rate of hydrogen storage. From a technical perspective, the design of community green hydrogen systems for urban communities must prioritize safety and portability. Safety is paramount, given the risk of hydrogen leakage and spontaneous combustion47. Portability calls for compact equipment and installation methods that are both straightforward and minimally invasive. To meet these criteria, we have chosen photovoltaic panels as the energy production modules and paired them with lithium-ion battery packages and liquid organic hydrogen carrier equipment for energy storage modules (Supplementary Note 7).
Modeling design optimization for energy systems
Design optimization in energy models involves sizing optimal system components of community green hydrogen systems to inform evaluation results for metrics of interest. As discussed earlier, multi-source uncertainties should be incorporated to ensure the robustness and stability of evaluation outcomes. Scenario pools are utilized as part of stochastic optimization in design optimization, capturing compound impacts of uncertainty factors. These scenario pools comprise a set of community energy scenarios with occurrence probabilities. Once the energy input scenarios are established, design optimization maps decision space variables onto the objective space through cyclic simulation under inherent system constraints. Specifically, decision variables encompass the rated capacity of the battery package and hydrogen tank, along with the rated power of both the fuel cell and electrolyzer. Meanwhile, the objective variables consist of system affordability and independence, quantified as annual life-cycle costs (LCC) and grid interaction level (GIL), respectively. In this study, the multi-objective particle swarm algorithm was used to calculate the design optimization part, as it has demonstrated effectiveness in handling multi-scenarios and multi-objectives simultaneously48.
Formulating objective functions
The annual LCC represents the equivalent annual cost of community green hydrogen systems over their lifespan in urban communities, including equivalent investment costs, equivalent operation and maintenance costs, carbon tax and community trade costs, as formulated in equation (1). Notably, it is imperative to note that all the techno-economic data deployed in this study are derivatives of prevailing current social and technical conditions. The details of objective functions are shown in Supplementary Note 8, including each term of LCC and techno-economic data of community green hydrogen systems.
where, n, s and t denote the system number, expected community energy scenarios and time series; N, Ns and T denote the total system number (prosumer number in HDP, 1 at HCP and CCP), total scenario number and total simulation time; ρs is the probability of scenario s; CRF denotes the capital recovery factor; Cinv and Com denote the initial investment cost and operation and maintenance cost per system; Cn,s,t,tax, and Cn,s,t,community denote the carbon tax and community interaction cost at time t in scenario s for system n.
GIL quantifies the level of independence of community energy systems by evaluating interactions with the power grid. The objective for urban residential communities is to minimize their interactions with the grid. This approach not only maximizes the role and benefits of communities but also helps to improve the stability of the urban power grid. This study evaluates GIL based on the amount of electricity imported from and exported to the grid, as shown in equation (2).
where, Pn,s,t,gridsell and Pn,s,t,gridbuy denote the amount of electricity sold to the grid and the amount of electricity purchased from the grid at time t in scenario s for system n.
Reporting summary
Further information on research design is available in the Nature Portfolio Reporting Summary linked to this article.

Responses