Decline in pitting corrosion resistance of 316 L stainless steel induced by Cr-depleted layer during tribocorrosion

Introduction
Austenitic stainless steel is widely used in marine environment, including ship equipment, marine resource extraction systems, and deep-sea diving instruments, due to its excellent corrosion resistance and good mechanical properties1,2. However, it is susceptible to pitting corrosion issues resulting from Cl– aggression in marine environment3. In specific applications, such as bearings, pumps, and hydraulic transmissions, stainless steel components must operate under frictional condition. In this situation, a new type of failure known as tribocorrosion arises from the synergy between mechanical wear and electrochemical corrosion4. This synergy notably accelerates the degradation rate of stainless steel5,6. Moreover, pitting corrosion can still occur during tribocorrosion, and the behaviour of pitting corrosion is notably altered.
It was found that the pitting corrosion resistance of 304 and 316 L stainless steels was significantly reduced during tribocorrosion: the corrosion pits with high density formed far below the pitting potential7,8. This poses a considerable threat to the safe and long-term serviceability of stainless steel. The pitting corrosion behaviour under tribocorrosion conditions differs markedly from that under normal conditions, particularly during the process in which a metastable pit transforms into a stable one. Our prior study confirmed that the corrosion pits generated during tribocorrosion still originated from regular metastable pits, but the transformation from metastable pit to stable pit no longer relies on the growth of the metastable pit9. The presence of stress corrosion cracking (SCC) in the metastable pit created a diffusion barrier that preserved the aggressiveness of the electrolyte, facilitating in the transformation of the metastable pit into stable one. Consequently, the prior occurrence of metastable pitting corrosion at low potential was a key factors in reducing the pitting corrosion resistance of stainless steel during tribocorrosion.
Chromium (Cr) is a vital alloying element that enhances the stainless properties and pitting corrosion resistance of stainless steel by forming a chromium oxide-rich passive film. However, Cr depleted regions with thickness ranging from tens to hundreds of nanometers are often observed at the grain boundaries of austenitic stainless steel due to carbide precipitation. This depletion results in a weakened of passive film on these regions and a subsequent decrease in pitting corrosion resistance10,11. Notably, a Cr-depleted layer exceeding ten nanometers in thickness of was identified on the surface of stainless steel after tribocorrosion in our previous study9. This layer is believed to contribute to the formation of metastable pits at low potentials; however, this hypothesis has yet to be confirmed through experimentation. Additionally, other factors, such as surface roughness and nanocrystallization, have not been ruled out as contributors, aside from the Cr-depleted layer. First, mechanical wear during tribocorrosion roughens the surface of stainless steel, creating more occluded sites that require a lower current to initiate and sustain diffusion control. This phenomenon can lead to the growth of metastable pits, which may even transform into stable pits at lower potentials12,13. Second, the stainless steel surface undergoes nanocrystallization during tribocorrosion due to repeated surface deformation14. The nanocrystallized surface (NS) contains a significant number of crystal defects, primarily grain boundaries and dislocations, into the stainless steel. This increases the reactivity of the stainless steel and provides additional nucleation sites for metastable pits15. Overall, the formation of a rough NS with Cr-depleted layer is likely responsible for the sharp decrease in the pitting corrosion resistance of the stainless steel during tribocorrosion. However, the effects of surface roughness, nanocrystallization, and depletion of Cr on metastable pitting corrosion are have not yet been clearly distinguished and evaluated.
The aim of this study is to investigate the impact tribocorrosion, specifically surface roughening, surface nanocrystallization, and the formation of a Cr-depleted layer, on the metastable pitting corrosion behaviour of stainless steel. The current signals associated with metastable pitting corrosion are often overshadowed by the overall corrosive current during tribocorrosion. To make them distinguishable, four types of 316 L stainless steel samples with different surface and subsurface characteristics were prepared. The metastable pitting corrosion behaviour of these samples was investigated using electrochemical methods under non-frictional conditions. The parameters analysed included metastable pit peak current, metastable pit lifetime, metastable pit radius, and metastable pit stability product, all of which were statistically evaluated. This study aims to contribute to the development of guidelines for the use and design of stainless steel in the marine environments subjected to tribocorrosion.
Results
Surface and subsurface characteristics
Figure 1 illustrates the surface morphologies and surface profiles of the as-prepared samples. As expected, the polished sample displayed the smoothest surface and the lowest surface roughness, with only a few minor scratches visible in the high-magnification SEM image (Fig. 1a to c). In contrast, the sanded sample exhibited a significant number of scratches, resulting in a noticeably increase in roughness (Fig. 1d to f). The samples subjected to cathodic and anodic potentials demonstrated similar scratched surface morphologies and roughness when compared to the sanded sample (Fig. 1g to l). The 2D surface profiles indicated that the grooves on the sanded sample, as well as the cathodically worn and anodically worn samples, had a comparable width-to-depth ratios, which could influence the pitting corrosion behaviour by altering the diffusion conditions16.

SEM morphologies and 3D/2D surface profiles of the as-prepared 316 L stainless steel samples: (a–c) polished; (d–f) sanded; (g–i) cathodically worn; (j–l) anodically worn.
The TEM observation results for the as-prepared stainless steel samples are shown in Fig. 2. In the topmost region of the polished sample, a slight deformation microstructure was observed (Fig. 2a), along with the presence of dislocations (Fig. 2b). Additionally, beneath the surface, the dark-field image and selected area electron diffraction (SEAD) result revealed the presence of sub-grains with an average size of 30.4 nm and limited orientation (Fig. 2c). These sub-grains originated from the dislocation cells17 and retained the original face-centred cubic (FCC) crystal structure. This deformed microstructure resulted from the sanding and polishing processes18. The sanded sample exhibited a comparable subsurface microstructure with the polished sample; however, the average grain size was larger, measuring 47.6 nm (Fig. 2d–f). In contrast, the two worn samples showed distinctly different subsurface microstructures (Fig. 2g–l). The deformed layers were significantly thicker, and the deformation was much more pronounced than in the sanded and polished samples. The gradient distribution of frictional shear stress was responsible for a change in the gradient of the deformation microstructure. The dislocation density increased gradually, while the grain size decreased with depth. Specifically, the upper region underwent complete nanocrystallization, with an average grain sizes of 12.7 nm (cathodic) and 5.4 nm (anodic). The crystal structure of these nanocrystallines underwent a complete transformation to body-centered cubic (BCC), indicating a strain-induced martensitic transformation19. No carbides or other inclusions were observed in any of the samples.
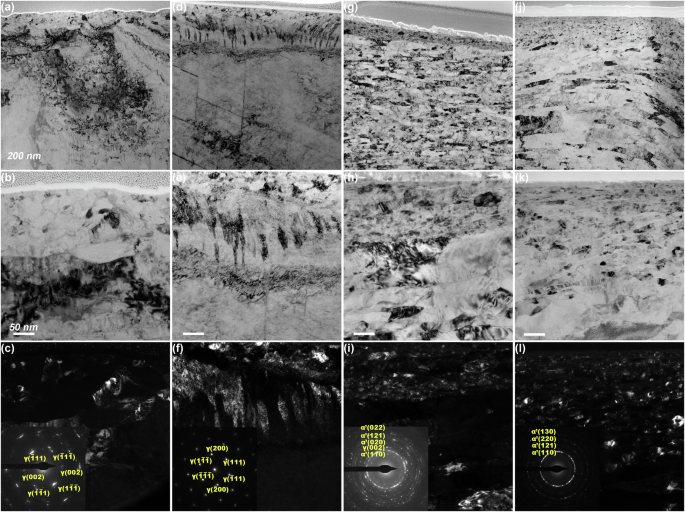
TEM light-field images, dark-field images and SAED results of the different 316 L stainless steel samples: (a–c) polished; (d–f) sanded; (g–i) cathodically worn; (j–l) anodically worn.
EDS line scanning was employed to analyze the subsurface chemical composition. Figure 3 presents the high-angle annular dark field scanning transmission electron microscopy (HAADF-STEM) image alongside the elemental linear scanning results of the upper regions of the four stainless steel samples. Due to the unavoidable oxidation of the FIB-prepared cross-section samples during the transition from FIB to TEM, the oxygen measurements were unreliable and could not be compared horizontally (as the oxidation times and the chemical activities of the subsurface were not the same); Nevertheless, the passive films could still be identified by the variations in oxygen content. Peaks were observed in the oxygen profiles, attributed to presence of oxides in the passive films (Fig. 3b, e, h and k). In order to analysis the chemical composition in the metallic matrix, the oxygen element was excluded the elemental line scanning results (Fig. 3c, f, i and l). The polished sample, sanded sample, and cathodically worn sample exhibited consistent chemical compositions beneath the passive film. However, a Cr-depleted layer ~30 nm thick was detected beneath the passive film on the sample worn with anodic potential. The average Cr content in this layer was 11.05 at.% which was significantly lower compared to the other samples (~18 at.%). The surface and subsurface characterization results demonstrate the successful preparation of stainless steel samples with distinct surface and subsurface characteristics. The cathodically worn sample and anodically worn sample will henceforth be referred to as NS and Cr-depleted NS, respectively.
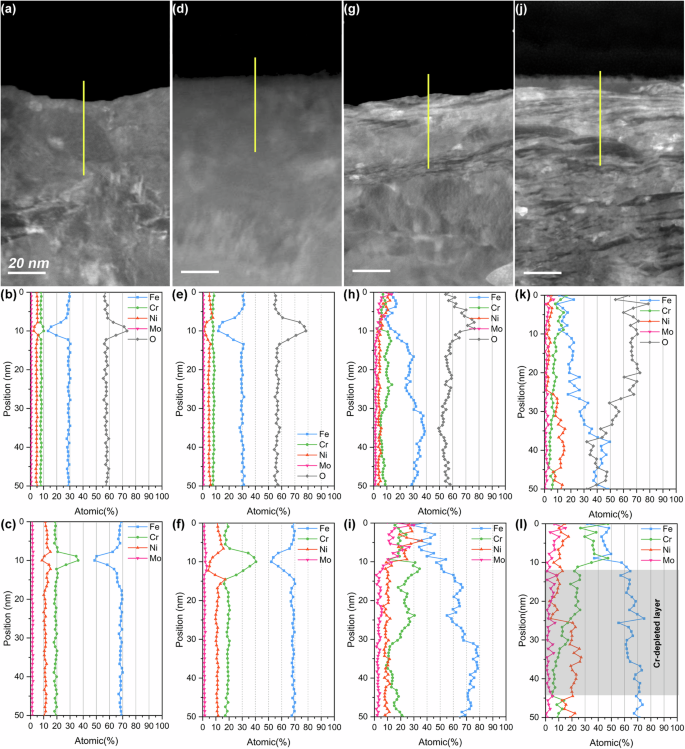
HAADF-STEM images and elemental line scan results (containing and excluding oxygen element) of the different 316 L stainless steel samples: (a–c) polished; (d–f) sanded; (g–i) cathodically worn; (j–l) anodically worn.
Metastable pitting corrosion behaviours
Figure 4 illustrates the potentiodynamic polarization curves of the four stainless steel samples. The current peaks observed below the Ep indicate the presence of metastable pitting corrosion. The potential at which the first metastable pitting current peak appears is referred to as the metastable pitting corrosion potentials (Em), which reflects the minimum thermodynamic driving force required to initiate a metastable pit20. Table 1 presents the Em and Ep values obtained from the various samples. The sanded sample exhibited lower Em and Ep values compared to the polished sample, suggesting that the rough surface negatively impacts pitting corrosion resistance. Notably, there was no visible metastable pitting signal on the NS, which displayed an Ep nearly identical to that of the polished sample, despite having a similarly rough surface to the sanded sample. Furthermore, the stable pit on the NS could be partially passivated after reaching the Ep. It was observed that the NS demonstrated superior pitting corrosion resistance compared to both the sanded and polished samples, implying that the surface nanocrystallization masked the adverse effect of the rough surface. Conversely, the Cr-depleted NS exhibited the lowest Em and Ep values, indicating the poorest pitting corrosion resistance. The results of the potentiodynamic polarization tests suggest that the Cr-depleted layer is the key factor contributing to the reduced pitting resistance of stainless steel during tribocorrosion.
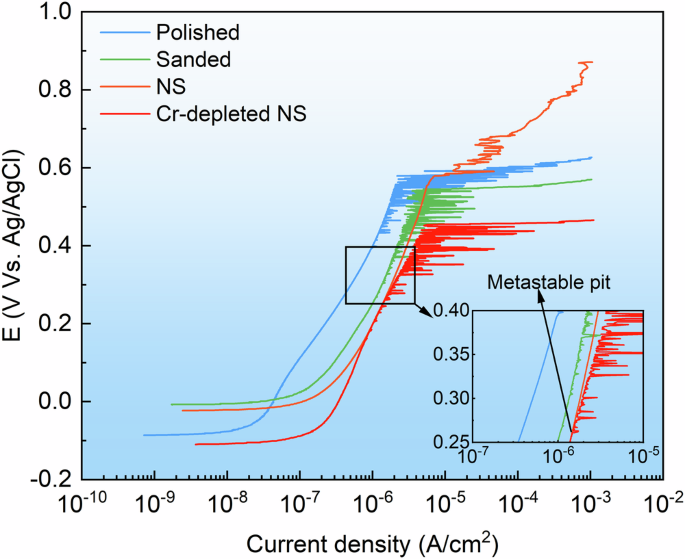
Polarization curves of the 316 L stainless steel with different surface and subsurface characteristics in 3.5 wt.% NaCl solution.
More detailed information on the metastable pitting corrosion behaviour was obtained from the potentiostatic tests. Figure 5 displays the anodic current transients observed on the stainless steel samples at various potentials. Each current peak was induced by the growth and subsequent repassivation of individual metastable pits. The surface and subsurface characteristics significantly influence the current transients. At a potential of 300 mV, metastable pitting corrosion was observed on the sanded sample and the Cr-depleted NS. The polished sample exhibited evidence of metastable pitting corrosion, but with lower heights and fewer current peaks compared to the sanded sample and the Cr-depleted NS at 400 mV. As the potential increased, both the height and number of current peaks rose in these samples, with a notably greater amplitude increase observed on the Cr-depleted NS. No metastable pitting current peaks were detected on the NS at any of the tested potentials.

Anodic current transients captured at (a) 300 mV, (b) 400 mV, and (c) 500 mV.
Apart from the height and number of the current peaks, the shape characteristics of the current peaks were also influenced by both the surface and subsurface properties. Figure 6 illustrates the typical current transient of a single metastable pit across different stainless steel samples. Each event exhibited a gradual increase in current, followed by a sudden drop, indicating the growth and repassivation of individual unstable pits21,22. The observed current peaks on both the polished and sanded samples displayed consistent characteristics. However, the current transient on the Cr-depleted NS exhibited a double-peak characteristic. If the current rises again to a second peak after dropping to half of the first peak, it is indicative of the overlapping characteristic current of two simultaneous metastable pitting corrosion events23. In this study, the drop in the first peak was less than half, therefore, the double-peak current transient was attributed to a single metastable pit. This double-peak current transient may be associated with the gradual dissolution of the Cr-depleted layer and the underlying nanocrystalline material. Further discussion on this topic will be provided later.
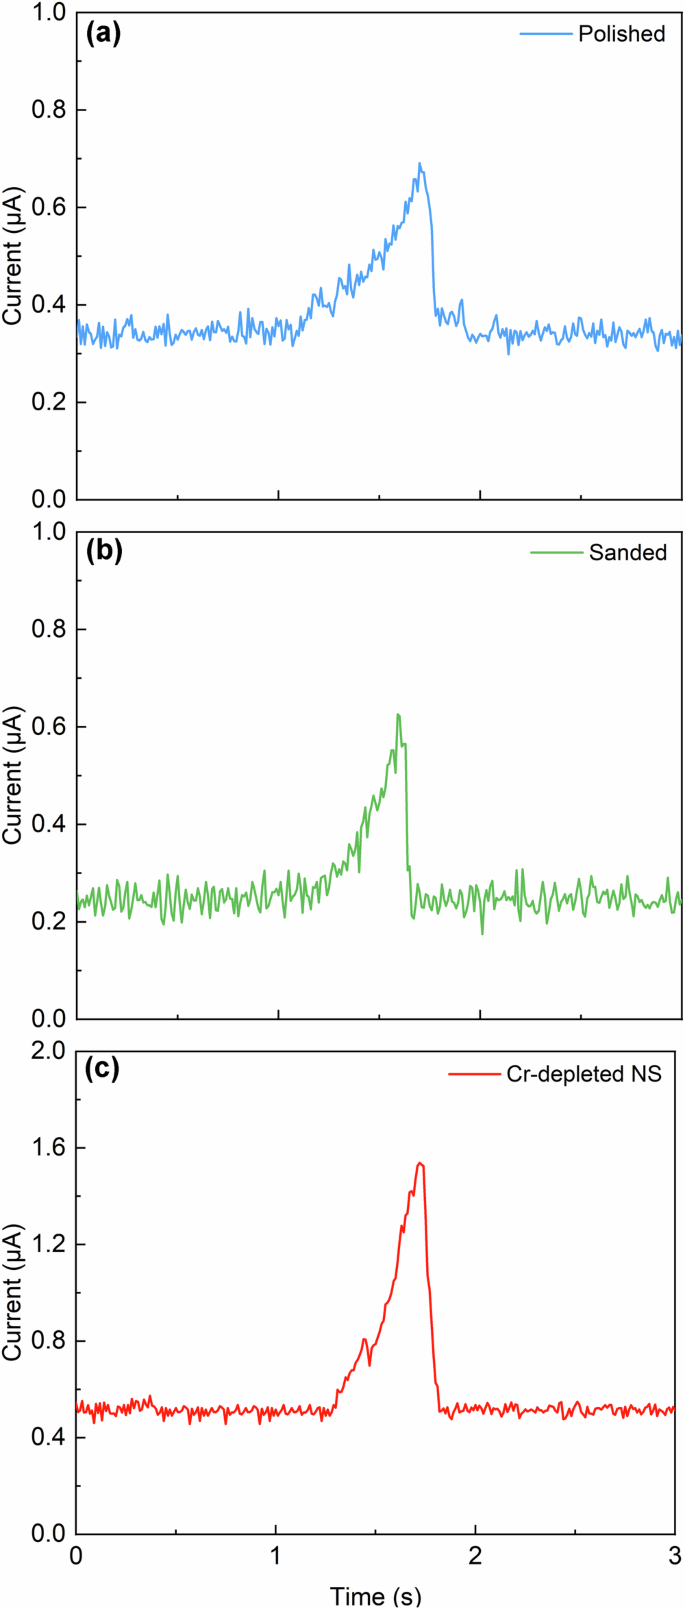
A potential of 400 mV was applied on the (a) polished sample, (b) sanded sample and (c) Cr-depleted NS, and the typical current transient of single metastable pit was recorded.
Figure 7 presents a comparison of metastable pitting frequencies across different samples and time intervals. It was observed that the metastable pitting frequency decreased over time, attributed to the consumption of nucleation sites for metastable pits24. Additionally, an increase in the metastable pitting frequency was noted with rising potential across all samples, which can be explained by the activation of more nucleation sites under the greater thermodynamic driving forces20. The sanded sample exhibited a higher frequency than the polished sample. Furthermore, the Cr-depleted NS demonstrated a significantly higher frequency than the other two samples across all time periods and potentials.
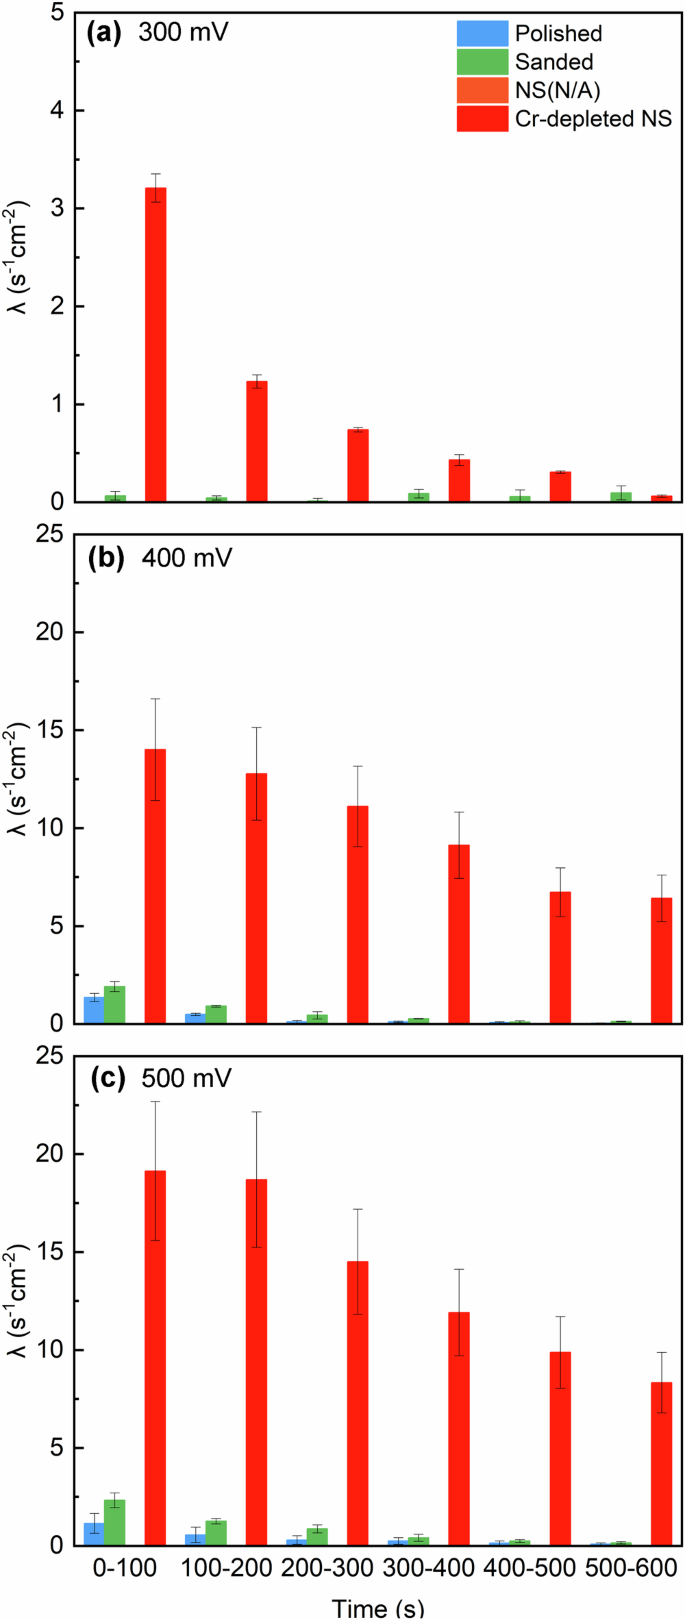
Metastable pitting frequency on the different stainless steel samples at (a) 300 mV, (b) 400 mV and (c) 500 mV.
The peak current (ipeak) is a critical factor in the growth of metastable pits. It is calculated by subtracting the background current (ibase) from the maximum current of each individual metastable pit. Figure 8a illustrates the cumulative distribution of ipeak across various stainless steel samples at different potentials. The peak current of metastable pits tended to increase with rising potential in all samples. The polished sample exhibited the lowest median value of peak current, while the Cr-depleted NS showed the highest median value across all potentials.
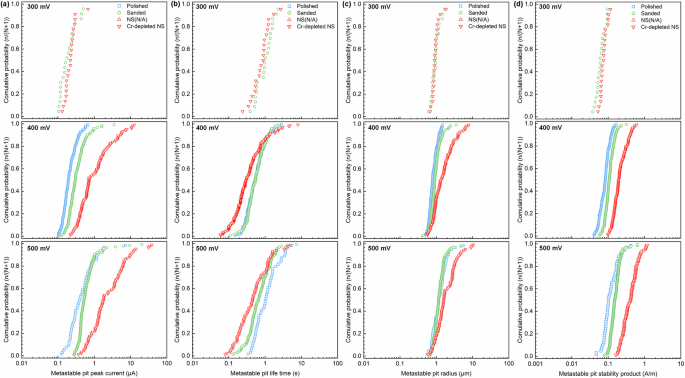
Cumulative distributions of (a) metastable pit peak current, (b) metastable pit life time, (c) metastable pit radius, and (d) pit stability product on the different stainless steel samples at different potentials.
The lifetime is another important parameter for the kinetics of metastable pit growth. It can be determined by calculating the total time between the initiation and repassivation of each individual metastable pit. Figure 8b presents the cumulative distribution of metastable pitting lifetimes at different potentials. The lifetime exhibited a trend of initially decreasing and then increasing with rising potential across all samples. The polished sample had a median lifetime nearly identical to that of the sanded sample at 400 mV; however, the former exhibited a longer lifetime than the latter at 500 mV. The Cr-depleted NS displayed the shortest metastable pit lifetime at all tested potentials. The sanded sample and Cr-depleted NS exhibited a higher peak of metastable pitting but a shorter metastable pitting lifetime compared to the polished sample. The growth of metastable pits is governed by the outward diffusion of the cations in the pit16. Rapid dissolution in the occluded site on the sanded sample and Cr-depleted NS may lead to the formation of salt precipitates in the pit. These precipitates can induced the repassivation of the metastable pit, thereby reducing its lifetime25,26.
Figure 9 illustrates the cross-sectional image of a metastable pit formed on the Cr-depleted NS at 400 mV. A semi-spherical shape with a radius of ~1.8 μm is clearly visible. Due to the low density and small size of the metastable pits on the sanded and NC samples, theese pits are challenging to locate and observe.

Cross-sectional SEM image of the metastable pit on the Cr-depleted NS formed at 400 mV.
Based on the semi-spherical shape of the metastable pit, the radius of the metastable pits (rpit) can be calculated using the charge transferred during the period of metastable pitting. This period is defined from the initial increase in current at time t0 to the repassivation of the metastable pitting corrosion at time t1, which represents the life time of the metastable pit. This calculation is performed in accordance with Faraday’s law27:
where M represents the molar mass of 316 L stainless steel (56.32 g mol−1), n denotes the number of electrons involved in the corrosive reaction (2.97), F stands for the Faraday constant (96485 C mol−1) and ρ is the density of the stainless steel (7.98 g cm−3). Figure 8c illustrates the cumulative distribution of rpit across the different samples. The sanded sample and Cr-depleted NS showed comparable metastable pit radius at 300 mV. As the potential increased, the metastable pit radius also expanded, which a more pronounced increase observed on the Cr-depleted NS compared to the other two samples. The polished and sanded samples showed no significant difference in metastable pit radius.
Metastable pits grow in an unstable, diffusion-controlled manner if they survives from the nucleation stage. The concentration of metal cations in the pit must be >3 M to maintain the aggressiveness of the electrolyte for sustaining pit growth; otherwise, the metastable pit will cease to grow and become passviated26. The upper limit of metal cation concentration (4 M) is determined by the solubility of the metal salt. Exceeding this limit will result in the precipitate of metal salt, leading to the passivation of metastable pits. Consequently, the pit stability product, defined as the product of the pitting current density (i) and the pitting radius (a), is proposed as a criterion to estimate whether or not a metastable pit can grow stably. A pit stability product rangeing from 0.3 A m−1 – 0.6 A m−1 is necessary for stable pit growth.
Figure 8d illustrates the cumulative distribution of pit stability products obtained from the stainless steel sample at various potentials. All the pit stability products were increased with rising potential. This phenomenon is attributed to the accelerated dissolution rate of stainless steel at the higher potentials, resulting in a greater cation concentration in the pit. The sanded sample exhibited a higher median value of pit stability products compared the polished sample across all potentials; however, the majority of the pit stability products remained below than 0.3 A m−1. This indicated that the most of the metastable pits on both the polished and sanded samples could not grow stably at potentials below 500 mV. In contrast, the pit stability products on the Cr-depleted NS were significantly higher than those of the previous two samples. Particularly, some the pit stability products at 400 mV and over 50% of the pit stability products at 500 mV exceeded 0.3 A m−1, suggesting that the metastable pits on the Cr-depleted NS were more susceptible to growth than those on the polished and sanded samples.
Passive film characteristics
A passive film with a strong chloride-resistance can inhibit the initiation and growth of metastable pits. The chloride-resistance of passive film is closely related to its chemical composition and structure28.
XPS analysis was conducted to understand the influence of surface and subsurface characteristics on the chemical composition of the passive film. Figure 10 presents the XPS analysis results for each element on the passivated stainless steel samples. The observed substances on all samples were identical, with all the passive films comprising of Cr2O3, CrO3, Cr(OH)3, Fe2O3, FeO·OH, NiO, MoO2 and MoO3. However, the intensity of each substance was varied, indicating distinct chemical compositions of the passive films. Detailed compositions of the passive films formed on different samples are illustrated in Fig. 11. The passive film on the sanded sample contained similar compositions compared to the polished sample. The NS exhibited a higher content of Cr-oxides and lower content of Fe-oxides compared to both the polished and sanded samples, suggesting its enhanced resistance to chlorides. Notably, the Cr-depleted NS had a lower Cr content in its passive film than the NS.
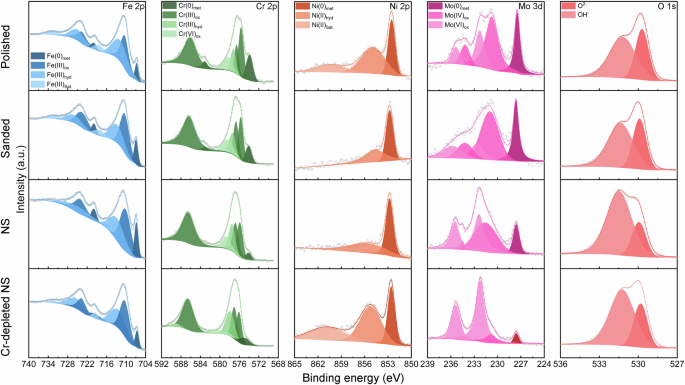
XPS spectra of on passivated 316 L stainless steel with different surface and subsurface characteristics.
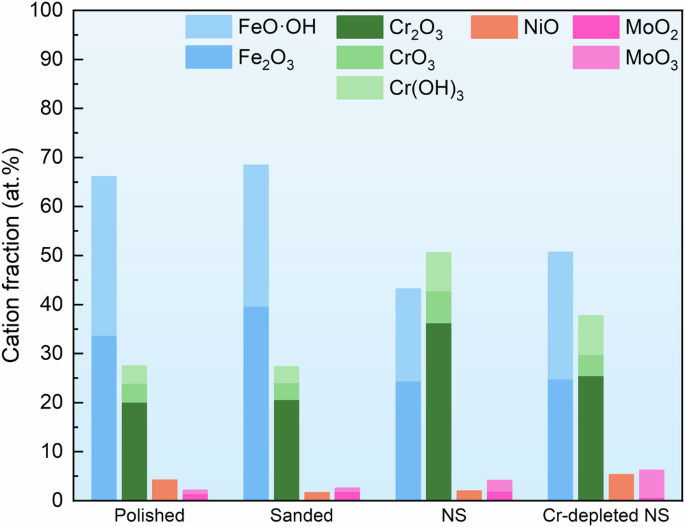
Proportions of each substance in the passive films formed on the 316 L stainless steel with different surface and subsurface characteristics.
There is a strong correlation between the semiconducting properties of a passive film and its corrosion resistance. The passive film formed on stainless steel is a heavily doped semiconductor, which can be analysed using the Mott-Schottky method to determine the defect density of the passive film29. The space charge capacitance (CCS) of the semiconductor electrode exbibited a Mott-Schottky relationship with the potential (E) as described by the following equations30:
where, ε represents the dielectric constant of the passive film, ε0 denotes the permittivity of free space, e stand for the charge of an electron, ND and NA denote the donor and acceptor densities, A signifies the tested area, E represents the applied potential, EFB is the flat-band potential, k is the Boltzmann constant, and T represents the absolute temperature31,32. Figure 12a illustrates the Mott-Schottky plots of the stainless steel samples exhibited various different surface and subsurface characteristics. Two linear segments with negative and positive slopes were observed between −900 mV to −700 mV and −200 mV to 300 mV, respectively. This indicates the presence of both n-type and p-type semiconductors on the passivated stainless steel. Previous studies have reported that the Cr-oxides exhibit p-type semi-conductive property while Fe-oxides possess n-type semi-conductive properties33. This finding aligns with the earlier XPS analysis, which indicated that the passive films were primarily composed of Cr2O3, Fe2O3 and FeO·OH. The emergence of p-type and n-type semi-conductive characteristics results from the presence of cation vacancies and oxygen vacancies in the oxides, respectively34. Consequently, the defect density in the passive film can be determined by calculating the acceptor density (NA) in the p-type semiconductor and the donor density (ND) in the n-type semiconductor. The results are presented in Fig. 12b. When comparing the polished and the sanded samples, it was observed that surface roughening increased the defect density of the passive film. However, under the influence of surface nanocrystallization, the NS exhibited a decreased defect density. Notably, the passive film formed on the Cr-depleted NS had a significantly higher defect density than the others, particularly in Cr2O3. Specifically, a higher defect density in the passive film was associated with reduced pitting corrosion resistance.
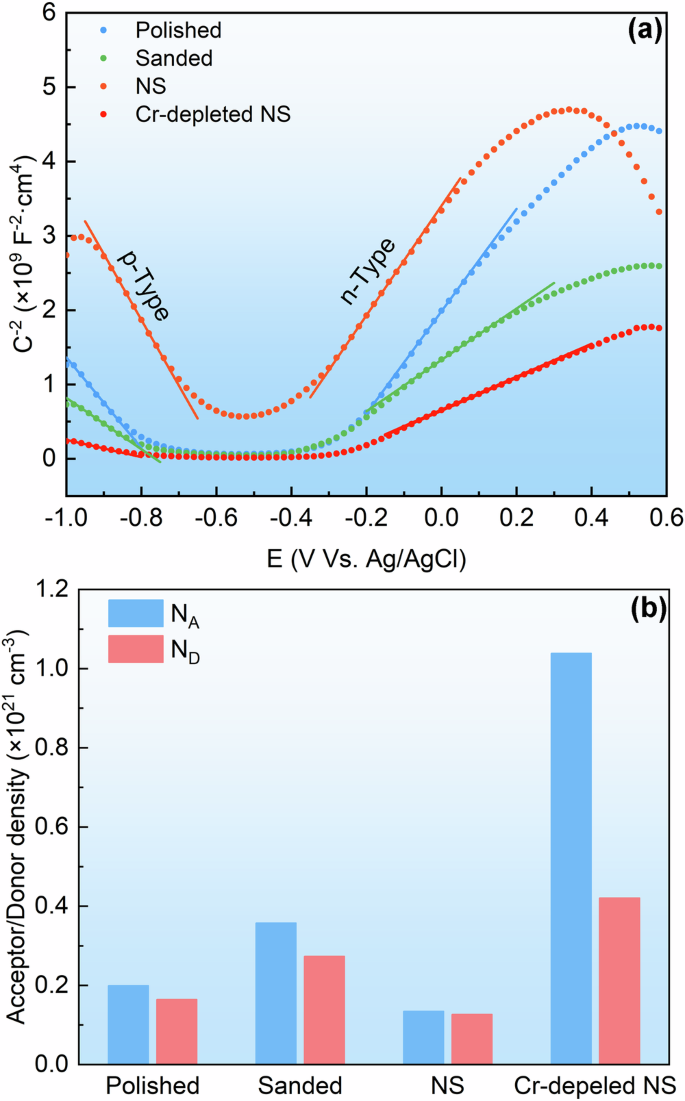
a Mott-Schottky plots on different stainless steel samples and (b) acceptor and donor densities in the passive films formed on the samples.
Discussion
The sanded stainless steel sample showed inferior pitting corrosion resistance compared to the polished sample. TEM characterization results revealed that the sanded sample exhibited a similar subsurface microstructure and chemical composition to that of the polished sample. Consequently, it was concluded that surface roughening diminished the pitting corrosion resistance of stainless steel. This finding is consistent with previous reports on stainless steel35, titanium alloys36, aluminium alloys37,38, and high-entropy alloys39. For pit growth to occur, it is essential to maintain a near-saturated local chemistry and to operate grow at a current density close to the diffusion-limited anodic current density12. The scratches on the sanded sample created more occluded sites, necessitating a lower current to initiate and sustain the diffusion control, which could be achieved by a lower potential13. This was evidenced by the sanded sample exhibiting significantly lower Em and Ep values in the potentiodynamic polarization tests, as well as higher pit stability products in the potentiostatic tests compared to the polished sample. Conversely, the sanded sample displayed a higher frequency of metastable pitting than the polished sample. This discrepancy can be attributed to the presence of a passive film with a greater density of defects in the sanded sample. These point defects can act as the nucleation sites for metastable pits33.
It is believed that surface roughening has a similar impact on both the NS and Cr-depleted NS, as they exhibit comparable scratched morphologies and surface roughness. However, the NS exhibited notably better pitting corrosion resistance than both the sanded and the polished samples. This indicates that the positive influence of surface nanocrystallization on pitting corrosion resistance outweighs the negative effects of surface roughening. In contrast, the Cr-depleted NS displayed markedly poorer pitting corrosion resistance compared to the sanded sample, suggesting the depletion of Cr in the surface layer has a detrimental impact on pitting corrosion resistance.
No metastable pitting current signal was observed below the Ep on the NS during the potentiodynamic polarization test. Despite having a surface that was similarly scratched to that of the sanded sample, the Ep of the NS exhibited only a slight decreased compared to the polished sample. Further more, unlike the other three samples, the stable pit on the NS could be incompletely repassivated after reaching the Ep. These results suggest that surface nanocrytallization can enhance the pitting corrosion resistance of the stainless steel, which aligns with earlier studies40. This improvement may be attributed to two factors: the enhancement of passive film and the acceleration of passive rate. First, the passive film formed on the NS exhibited a higher Cr content and significantly lower defect density, particularly (in Cr2O3). This enhancement effectively improved the chloride-resistance of the passive film, thereby impeding the initiation of metastable pits. According to the point defect model (PDM), the growth of oxide passive film depends on the diffusion of cations and anions through vacancies in the film34,41,42. The numerous grain boundaries and dislocations in the NS could serve as the rapid diffusion pathways for Cr43, providing an abundance of Cr cations. This could enrich the Cr content in the passive film and reduce the defect density of the passive film by annihilating cation vacancies. Conversely, the high proportion of crystal defects in the NS substaintially increased the stored energy, resulting in increased surface reactivity44. This led to a rapid repassivation rate, which facilitated the inhibition of metastable pitting growth45,46.
Although the Cr-depleted NS exhibited the similar surface morphology, roughness, and nanocrystalline microstructure compared to the NS, it demonstrated significantly poorer pitting corrosion resistance. This indicates that the presence of the Cr-depleted layer was the decisive factor in the decline of pitting corrosion resistance of stainless steel during tribocorrosion. The development of metastable pit on the Cr-depleted NS was schematically drawn in Fig. 13. It has been reported that the pitting potential of Fe-Cr alloy sharply decreased when the Cr content fell below 13 at.%, which is attributed to the reduction of Cr content in the passive film47,48. In this study, the average Cr content in the Cr-depleted layer in this study was only 11.05 at.%, similarly resulting in a significant decrease in Cr content in the passive film. On the other hand, the presence of the Cr-depleted layer significantly increased the defect density in the passive film, leading to a higher number of pitting nucleation sites. This phenomenon may be attributed to the insufficient availability of Cr cations to occupy the cation vacancies. Consequently, metastable pits with high density could nucleate at low potentials due to localized broken-down of the passive film (Stage I). Subsequently, the Cr-depleted layer under the passive film was quickly dissolved, leading to the initial current peak (Stage II). Subsequently, the nanocrystallized substrate with high Cr content beneath the Cr-depleted layer was exposed, which led to a decreased current (Stage III). However, the dissolution of the Cr-depleted layer created a high concentration of cations in the pit. The electrostatic attraction and hydrolysis of these cations resulted in the formation an aggressive electrolyte with a high chloride concentration and a low pH26. The nanocrystallines would continued to dissolve in the pre-existing aggressiveness electrolyte, causing the second current peak to form (Stage IV). As the material in the pit was temporarily unable to be passivated in such an aggressive electrolyte, the higher reactivity of the nanocrystallized stainless steel would instead accelerate its dissolution rate49. This resulted in a higher pit stability product, which supported pit growth and increased metastable peak current. Ultimately, the metastable pits could initiate with high density and grow on stainless steel at relatively low potentials during tribocorrosion.
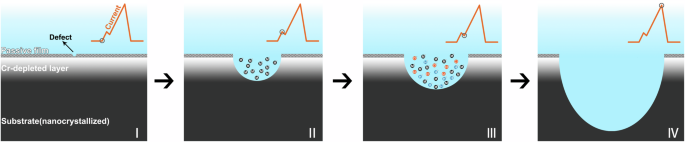
Stage I: metastable pit nucleation; Stage II: rapid dissolution of the Cr-depleted layer; Stage III: formation an aggressive electrolyte with a high chloride concentration and a low pH; Stage IV: subsequent dissolution of the nanocrystallized substrate.
Based on the noticeable contrast between the stainless steel worn at cathodic and anodic potentials in pitting corrosion behaviour, the formation of the Cr-depleted NS under the synergism between wear and corrosion was the key factor to cause the sharp decline in the pitting corrosion resistance during tribocorrosion. Figure 14 illustrates the schematic representation of the formation of the Cr-depleted NS. Mechanical wear initially thins or removes the passive film, leading to depassivation. Simultaneously, the subsurface undergoes deformation, resulting in the formation of defects such as dislocations and grain boundaries. Repassivation of the surface begins after wear, leading to the reformation of passive film, which depletes the inner Cr atoms. The high-density defects in the nanocrystallized microstructure act as rapid diffusion pathways for Cr, allowing Cr atoms from the deeper regions to diffuse outward. The repeated cycles of depassivation and repassivation actions ultimately lead to a significant loss of Cr from the matrix, resulting in a depletion of Cr in the NS. Furthermore, these repeated actions ensure that this Cr-depleted NS will never experience exhaustion, indicating that the decline in pitting corrosion resistance of the stainless steel is a permanent phenomenon during tribocorrosion.
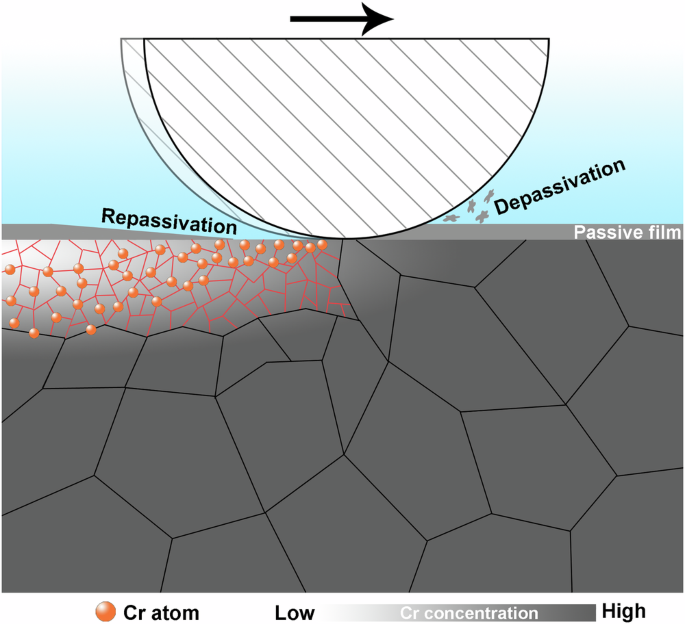
The repeated cycles of depassivation-repassivation actions lead to a significant loss of Cr from the matrix, resulting in a depletion of Cr in the NS.
In summary, the impact of tribocorrosion on the pitting corrosion resistance of 316 L stainless steel was investigated by comparing four pre-prepared samples with varying surface and subsurface characteristics in this study. The effects of surface roughening, surface nanocrystallization, and the presence of a Cr-depleted layer on metastable pitting corrosion behaviour were confirmed. Although mechanical wear increased surface roughness, which reduced the pitting resistance of stainless steel to some extent by creating more occluded sites that required lower current to generate and maintain the diffusion control, and by increasing the defect density in the passive film, which provided additional nucleation sites. Surface roughening was not the primary reason for the significant reduction in pitting resistance during tribocorrosion. The pitting corrosion resistance of the stainless steel was enhanced by the surface nanocrystallization resulting from purely mechanical wear. The nanocrystallized microstructure featured a substantial number of grain boundaries and dislocations, which served as rapid diffusion pathways for Cr. This led to the formation of a passive film characterized by fewer defects and a higher Cr content, thereby reducing the number of metastable pitting nucleation sites and improving the chloride-resistance of the passive film. The significant decline in pitting corrosion resistance of the stainless steel during tribocorrosion was primarily attributed to the formation of a Cr-depleted layer on the nanocrystallized surface, resulting from the synergistic effect of wear and corrosion. This Cr-depleted layer led to a notable increase in defect density and a decrease in Cr content in the passive film, which in turn increased the number of pitting nucleation sites and reduced the chloride-resistance of the passive film. More importantly, the rapid dissolution of the Cr-depleted layer created a high concentration of cations, which facilitated the subsequent pitting growth on the highly reactive nanocrystallized material with beneath the this layer. Consequently, a high density of metastable pits could initiate and grow at low potentials.
Methods
Materials
An AISI 316 L stainless steel cold-rolled sheet, with a thickness of 2 mm, was utilized in this study. The chemical composition of the stainless steel is presented in Table 2.
Samples preparation
The stainless steel sheet was cut into pieces with dimensions of 20 mm × 6 mm × 2 mm. Subsequently, each cut piece was embedded in a plastic ring using epoxy resin, with one side of the slice, measuring 20 mm × 6 mm, left exposed. SiC sandpapers ranging from 400 – 2000 grit were employed to sand the exposed surface. Finally, various methods were ustilized obtain four types of samples, each exhibiting unique surface or subsurface characteristics (see Fig. 15 for details). All of the preparation processes were conducted at room temperature.
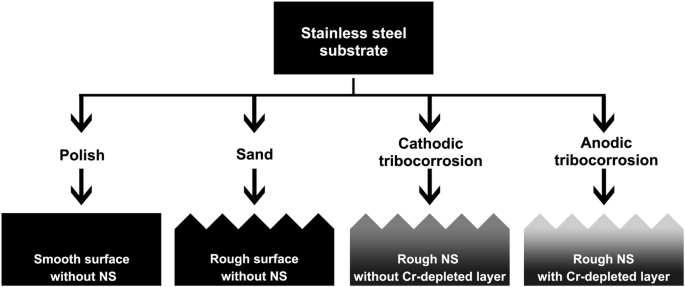
316L stainless steel was polished, sanded, worn under cathodic protection, and worn at anodic potential, respectively, to obtain samples with different surface or subsurface characteristics.
Smooth surface without NS
The sanded sample was polished with 1 μm diamond paste to achieve a smooth surface, which served as the blank control. Rough Surface without NS: The sanded sample was sanded with 3000-grit sandpaper to create a rough surface, similar to the next two samples. Rough NS without Cr-depleted Layer: The sanded sample was first polished and then subjected to wear in a tribocorrosion setup with a cathodically protective potential. The schematic diagram of the setup is presented in Fig. 16a, where an electrolytic cell was assembled on a tribometer. The sample, an Ag/AgCl electrode, and a platinum electrode acted as the working, reference, and count electrodes, respectively. During preparation, the polished sample was placed in the electrolytic cell, followed by the addition of 100 mL of a 3.5 wt.% NaCl solution for immersion. The sample was then subjected to a cathodic protection potential of −0.8 Vvs.Ag/AgCl using an electrochemical workstation (Vertex.C, IVIUM) with a three-electrode system. At this potential, the cathodic reaction rate is dependent on the diffusion rate of oxygen, and the hydrogen evolution reaction has not yet occurred; therefore, the effect of hydrogen charging may be negligible. After stabilizing for 10 min, a load of 10 N was applied on the counter-part (a ZrO2 ball with a diameter of 10 mm), the tribometer reciprocated at a frequency of 1 Hz with an amplitude of 8 mm. The current curve during the preparation was shown in Fig. 16b. A cathodic current was observed, indicating that the anodic corrosion reaction was inhibited and the surface was only affected by mechanical wear. After 60 min, the reciprocation was halted, and the sample was extracted and washed with deionized water. The unworn region was coated with silicone rubber, leaving only the worn region was exposed in the subsequent electrochemical tests. Rough NS with Cr-depleted Layer: The preparation process followed a similar pattern to the previous sample, except that an anodic potential of 0.2 Vvs.Ag/AgCl was applied. An anodic current was detected during the preparation (Fig. 16b). The sharp increase of current under the frictional conditions indicated the occurrence of tribocorrosion.
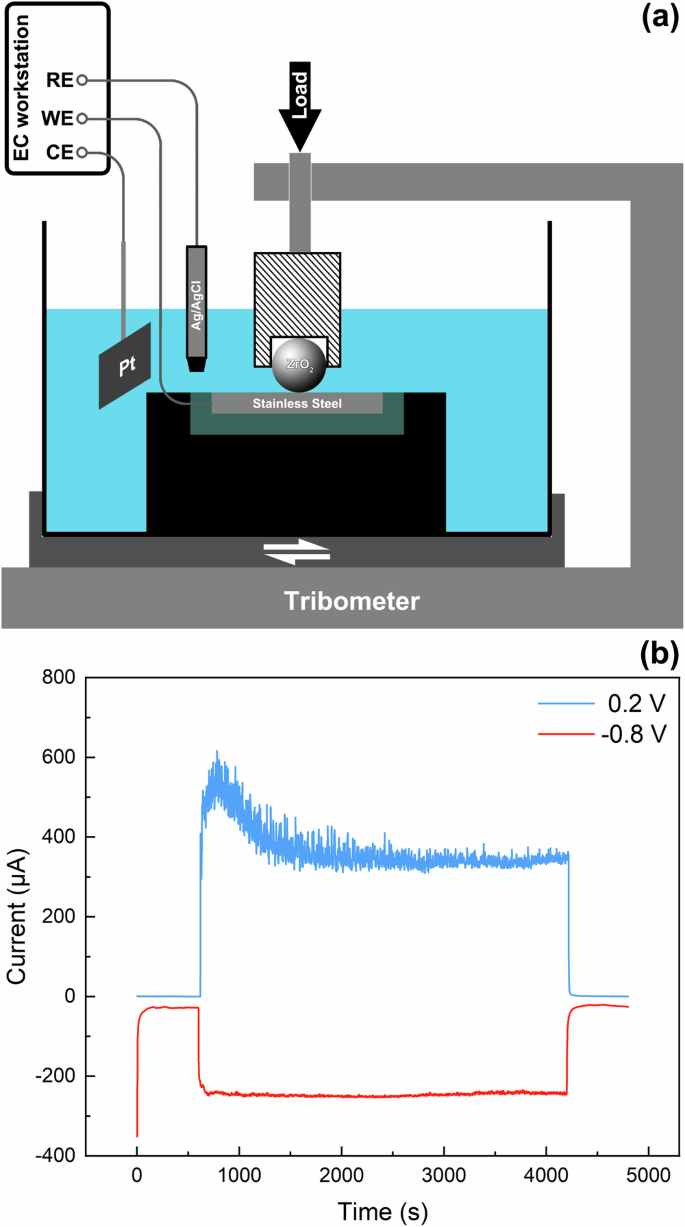
a Schematic diagram of the tribocorrosion set-up and (b) current evolutions during the preparation for the NS with Cr-depleted layer (0.2 V) and NS without Cr-depleted layer (−0.8 V).
It is important to note that obtaining NS or Cr-depleted NS with a smooth surface was not feasible due to the possibility that the nanocrystalline layer or the Cr-depleted layer could be altered or even removed during the roughness reducing process. As an alternative, the sanded sample was used to evaluate and eliminate the impact of roughness by comparing it with both the smooth sample and the worn samples.
Surface and subsurface characterizations
The surface morphologies of samples were examined using a field-emission scanning electron microscope (FESEM, SUPRA55, Zeiss). Surface profiles and roughness were measured through a white light interferometer (Contour GT-K1, Bruker). To characterize the subsurface microstructure and chemical composition, cross-sectional samples were prepared by using a focused ion beam (FIB, Helios Nanolab 600, FEI). The cross-sectional views of the samples were subsequently analyzed with a transmission electron microscope (TEM, Tecnai F20, FEI). The chemical composition of the samples was analyzed using the integrated energy-dispersive X-ray spectrometer (EDS).
Electrochemical tests
Potentiodynamic polarization tests were initially conducted to determine the metastable pitting corrosion potential (Em) and the pitting corrosion potential (Ep). In these test, the sample was first stabilized in a 3.5 wt.% NaCl solution at open circuit potential (OCP) for 600 s. Subsequently, the scanning commenced from the stabilized OCP at a rate of 1 mV s−1 until the current density exceeded 1 mA cm−2.
Potentiostatic polarization tests were conducted to acquire current transients associated with metastable pitting. Based on the potentiodynamic polarization results, three potentials (300, 400 and 500 mV) were selected for the potentiostatic tests, where metastable pitting corrosion could potentially occur. A constant potential was applied to the sample for 600 s and its corresponding current response was recorded at a frequency of 100 Hz. Since the occurrence of metastable pitting corrosion is a probabilistic event, the probability of pitting corrosion, P(E), was calculated using the following function50:
where n represents the nth sample, and N denotes the total number of tests, this function was also applied other parameters, including metastable pit life, metastable pit peak current, metastable pit radius, metastable pit, and the metastable pit stability product. Each electrochemical test was repeated for five times.
Passive film characterizations
X-ray photoelectron spectroscopy (XPS, Thermofisher ESCALAB 250Xi) analysis was employed to determine the chemical composition of the passive film. Prior to analysis, the sample underwent passivation for 600 s at 200 mV in the NaCl solution, followed by washing with deionized water and dring in air. The defect density of the passive film was measured using Mott-Schottky analysis. The sample was first passivated at 200 mV in a 3.5 wt.% NaCl solution for 600 s before measuring the capacitance at different potentials, using an alternating potential amplitude of 10 mV with 103 Hz and a step potential of 20 mV.


Responses