Deep learning models in classifying primary bone tumors and bone infections based on radiographs
Introduction
Primary bone tumors (PBTs) are a diverse group of heterogeneous tumors that primarily develop in the skeletal system1. Despite their relatively low incidence, these malignancies present significant morbidity and mortality rates2,3. Remarkably, bone tumors rank as the third leading cause of cancer-related deaths among individuals under the age of 20 in the United States4. Currently, the treatment options for bone tumors remain formidable, traditional treatment options such as chemotherapy and surgical interventions, face significant challenges1,5. For instance, chemotherapy often leads to severe side effects and has a limited success rate due to chemoresistance in specific type of bone tumors like osteosarcoma6,7, while surgical options may result in functional impairments, residual metastasis, and even deformities or disabilities8,9,10. These challenges underscore the need for improved treatment strategies. Radiography is the suggested primary auxiliary examination choice and commonly employed in orthopedic diagnosis as they generally provide a clear evaluation of the lesion’s location, internal matrix, margins, and associated periosteal reactions11. These destruction signs reflect the biological activity of the lesion, thus allowing for evaluation of the malignancy assessment12. However, PBTs exhibit diverse compositions and may present with overlapping radiological and histological features13,14. Consequently, the same PBTs may appear differently on radiographs, and different PBTs may exhibit similar radiographic images15. Due to the rarity of PBTs, cultivating a professional radiologist often encounters the problem of a long training cycle and insufficient expertise16. Bone infections primarily encompass osteomyelitis and joint infections. Notably, clinically distinguishing PBTs from bone infections is challenging for the similarities in clinical practice (e.g., fever, soft tissue swelling, periosteal reaction), leading to potential confusion and challenges in accurate diagnosis17,18. Therefore, the preoperative differential diagnosis of PBTs and bone infections is crucial for precise diagnosis and timely treatment.
Traditional diagnostic methods heavily rely on the expertise and subjective judgment of radiologists and pathologists, which can lead to potential errors and delays in treatment options19,20,21. Furthermore, if imaging studies are not interpreted by musculoskeletal radiologists who specialize in this field, discrepancies in readings can occur, reaching up to 28%22. In recent years, the emergence of deep learning algorithms especially convolutional neural networks (CNNs) has significantly impacted clinical practices such as assisted diagnosis and drug discovery23,24. These advancements have also demonstrated improvements in cancer prognosis25. The application of deep learning in cancer diagnosis has considerably enriched the field, showcasing astounding efficiency in solving complex problems with a lower error rate than humans26,27. For bone tumors, the development of multitask deep learning models has enabled accurate and simultaneous bounding box placement and segmentation of PBTs in radiographs, and can effectively differentiate benign and malignant PBTs with performance comparable to senior radiologists28. Due to the rarity of PBTs, deep learning models in this domain are constrained by limited access to large-scale cohort datasets, resulting in scant efforts to differentiate between bone tumors and other bone pathologies. Furthermore, prevailing models emphasize algorithmic versatility and data diversity, yet they fall short in sufficiently incorporating crucial clinical patient data and prioritizing the interpretability of model outcomes. This trend runs counter to the fundamental ethos of algorithmic design, sometimes it is necessary to pause and delve into a profound comprehension of our meticulously crafted models with professional radiologist interpretation, thereby aligning our efforts with the original essence of algorithmic innovation.
Therefore, the main objective of this study was to create an ensemble deep learning framework using multicenter radiographs and extensive clinical features to accurately differentiate between PBTs and bone infections. While comparing the performance of the ensemble model with four imaging models merely utilizing radiographs, which were built upon four distinct neural networks: EfficientNet B3 (E3), EfficientNet B4 (E4), Vision Transformer (ViT), and Swin Transformers (SWIN). Subsequently, these models’ effectiveness was assessed and compared with the diagnostic accuracy of radiologists. In addition, six professional radiologists, categorized into three seniority groups, provided insights and discussions on the clinical implications of the developed models. The research methodology and study flowchart are illustrated in Fig. 1.
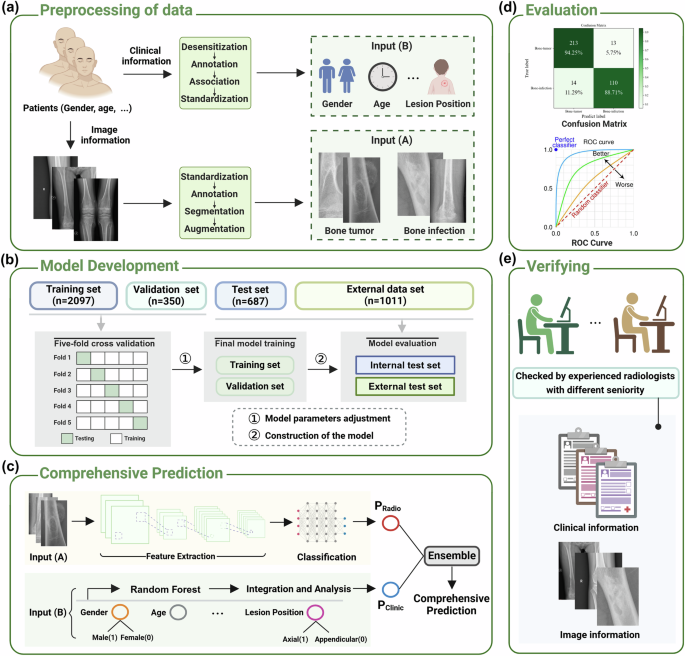
a Preprocessing of data. The input of the models mainly includes image information based on radiographs defined as input (A) and clinical information defined as input (B). b Model development. c Comprehensive prediction. PRadio and PClinic refers to the results of the four imaging models (E3, E4, ViT, and SWIN) and the clinic model, respectively. d Evaluation. This part is mainly composed of ROC curve and confusion matrix. e Verifying. The results of models are compared with radiologists with different seniority. n number of the radiographs, E3 EfficientNet B3, E4 EfficientNet B4, ViT vision transformer, SWIN swin transformers. Note: Fig. 1 was Created with BioRender.com.
Results
Characteristics of study participants
This retrospective study included 1992 patients (median age, 29 years; range, 1–88 years; 796 female) from three hospitals diagnosed of PBTs or bone infections with histopathology reports available as reference (Table 1). The distribution of 1208 patients with PBTs were described in Supplementary Table 1, with 767 benign subtypes, 251 malignant subtypes and 190 intermediate subtypes according to the 2020 World Health Organization (WHO) system for the classification for tumors of bone. While for 784 patients with bone infection, bone tuberculosis counted the highest proportion (Supplementary Table 2). 1569 patients from Hospital 1 were utilized as internal dataset and divided into a training set (N = 1044), a test set (N = 354) and a validation set (N = 171) (Fig. 2a) (screening criteria in Fig. 2b); 423 patients from Hospital 2 and Hospital 3 were used for external validation (Supplementary Fig. 1). Clinical characteristics like age, lesion location, pain, swelling, trauma, C-reactive protein (CRP), erythrocyte sedimentation rate (ESR), alkaline phosphatase (ALP) among all of the bone infection and PBT patients had significantly different distributions (Table 1). The clinical characteristics of patients with PBTs and bone infection were summarized specifically in Supplementary Tables 3 and 4. We further found that clinical characteristics like age, lesion location, pain, swelling, trauma, C-reactive protein (CRP), erythrocyte sedimentation rate (ESR), alkaline phosphatase (ALP) also had statistical differences in the internal dataset (Supplementary Table 5).
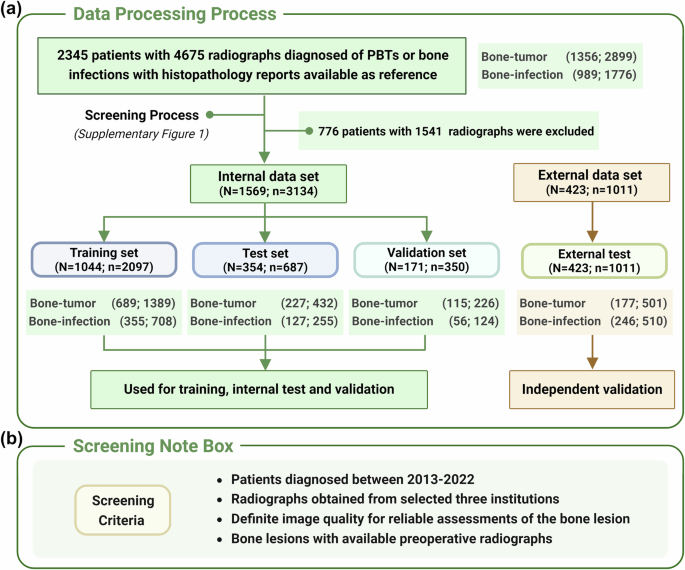
a Data processing process and data distribution across different datasets. b Screening criteria of the research. n number of the radiographs, N number of the patients. Note: Fig. 2 was Created with BioRender.com.
Classification performance of models
In the internal test set, the ensemble model outperformed four imaging models (E3, E4, ViT and SWIN) on the binary classification to distinguish PBTs from bone infections respectively (P < 0.001 for E3, E4, and ViT; P = 0.835 for SWIN; DeLong test) (Table 2 and Supplementary Fig. 2). Specifically, the ensemble model reached an AUC of 0.948 (95% CI, 0.931–0.963) and an accuracy of 88.1% for binary classification, whereas the E3, E4, ViT and SWIN-based models achieved AUCs of 0.903 (95% CI, 0.878–0.927), 0.912 (95% CI, 0.890–0.934), 0.903 (95% CI, 0.880–0.927), and 0.946 (95% CI, 0.929–0.963) as well as accuracies of 84.3%, 84.6%, 84.3%, and 87.2%, respectively (Table 2). The ROC curves and the confusion matrices also demonstrated the best categorizing ability of the ensemble model (Fig. 3 and Supplementary Fig. 3).
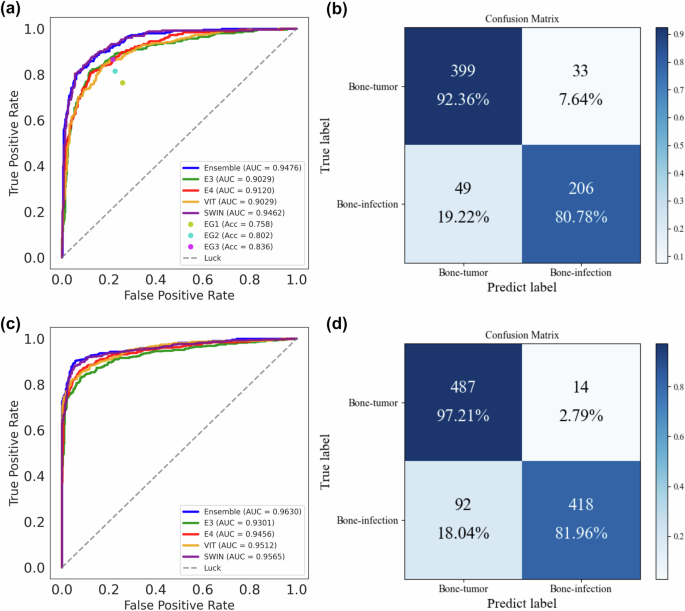
a, b ROC curve and confusion matrices of all models and radiologists’ interpretations on the internal test set. c, d ROC curve and confusion matrices of all models on the external test set. Note: EG1= expert 1+ expert 2 (junior radiologist group); EG2= expert 3+ expert 4 (medium seniority group); EG3= expert 5+ expert 6 (senior radiologist group). EG expert group, E3 EfficientNet B3, E4 EfficientNet B4, ViT vision transformer, SWIN swin transformers, AUC area under the curve, Acc accuracy.
In the external test set for validation, the ensemble model also outperformed the four imaging models, which proved the consistency and applicability of the ensemble model (P < 0.001 for E3 and E4; P = 0.002 for ViT and SWIN; DeLong test) (Table 2 and Supplementary Fig. 2). Specifically, the ensemble model reached an AUC of 0.963 (95% CI, 0.951–0.973) and an accuracy of 89.5% for the classification, while the four imaging models reached AUCs of 0.930 (95% CI, 0.914–0.946), 0.946 (95% CI, 0.932–0.960), 0.951 (95% CI, 0.939–0.964), and 0.957 (95% CI, 0.944–0.969) as well as accuracies of 86.6%, 87.4%, 87.1%, and 88.5%, respectively (Table 2). The confusion matrices and ROC curves in Fig. 3 further visually demonstrated the superior discrimination capability of the ensemble framework. In addition, the result in internal validation set further confirmed the stability and consistency of the ensemble model (Supplementary Fig. 4).
Comparison of performance between the ensemble framework and radiologists
In this study, six professional radiologists were divided into junior expert group (EG1), medium seniority group (EG2), and senior expert group (EG3). The comparative analysis was conducted using the internal test set. As shown in Fig. 3, the ensemble framework significantly outperformed all three radiologist groups (P < 0.001 for EG1, EG2, and EG3; Cochran’s Q test) (Table 2). The SWIN-based imaging model demonstrated comparable performance to the ensemble model (P = 0.835; DeLong test) (Table 2) and also outperformed the three radiologist groups. The other three imaging models (E3, E4, and ViT) achieved superior performance compared to EG1 and EG2, and were comparable to EG3. In addition, we calculated and provided other metrics, including accuracy, sensitivity, specificity, positive predictive value (PPV), negative predictive value (NPV), and F1 Score, to facilitate a comprehensive comparison of the performance between the ensemble framework and the radiologists (Table 3).
Inter-reader reliability
Considering the subjectivity of individual sample predictions and large workload of the monotonous radiographs (n = 687), inter-reader reliability among radiologists was much lower than that of the models. We compared the best performing model—the ensemble model with experts of diverse seniority, Cohen κ between expert 6 (radiologist with the highest seniority) and the ensemble had the best consistency: 0.596 (95% CI, 0.560–0.633) (Table 4). The Fleiss κ value among radiologists achieved 0.401 (95% CI, 0.364–0.438) on the internal test set, while the Fleiss κ value among models achieved 0.800 (95% CI, 0.770–0.830) (Table 4). Furthermore, we used Cohen κ value to evaluate consistency between pairs of expert groups (EG1, EG2, and EG3) and consistency between the ensemble model and the other four imaging models. We found as seniority increased, the consistency of judgment rose in radiologists, but the overall consistency of judgment was still lower than that of the models. The Fleiss κ value among EG1, EG2, and EG3 reached 0.267 (95% CI, 0.234–0.300), 0.295 (95% CI, 0.261–0.329), and 0.581 (95% CI, 0.544–0.618), respectively (Table 4). In contrast, the Fleiss κ value among the ensemble model and the imaging models reached 0.805 (95% CI, 0.775–0.835), 0.793 (95% CI, 0.763–0.823), 0.783 (95% CI, 0.752–0.814), and 0.908 (95% CI, 0.886–0.930), respectively (Table 4). This indicates that a strong disagreement exists among junior radiologists when facing classification of PBTs and bone infection solely on radiograph data.
Visual interpretation of models
In order to accurately interpret the predictions made by the models, we employed techniques such as GradCAM and ScoreCAM to visualize the specific regions within the input data that the model utilizes for its decision-making process (Fig. 4). By identifying and highlighting these key areas, we are able to gain a deeper understanding of how the model arrives at its predictions and make informed assessments about its performance and reliability. In general, the analysis of the highlighted regions on the heat maps reveals that the model primarily focused on identifying PBT or bone infection lesions, such as hemorrhage, necrosis, calcification, cystic lesions, and inflammatory exudation. These findings are in line with the segmentation results, indicating that the model was able to achieve a high level of accuracy in classifying these specific types of lesions. This demonstrates the effectiveness of the model in accurately identifying and categorizing pathological features, ultimately leading to satisfactory classification performance. The distinctions between GradCAM and ScoreCAM are clearly evident in the generated heat maps. GradCAM primarily emphasizes the areas of bone hyperplasia and sclerosis, neglecting those of bone destruction. Conversely, ScoreCAM directs its attention toward both osteogenic and osteoclastogenic regions, resulting in a more precise delineation of lesion boundaries.
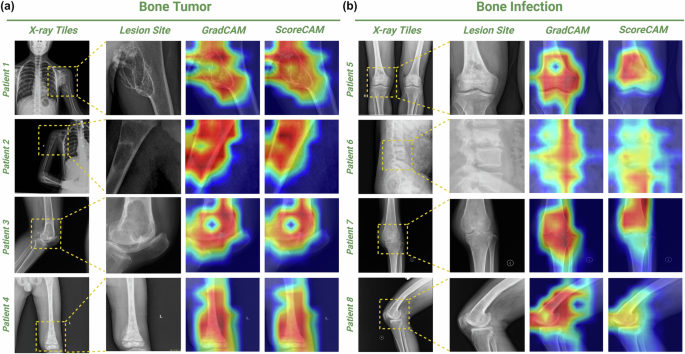
a Visualization of PBTs. Patient 1, a 10-year-old girl with chondrosarcoma on the left proximal humerus; Patient 2, a 10-year-old boy with a simple bone cyst on the right humerus; Patient 3, a 65-year-old female with giant cell tumor of bone on the left distal femur; Patient 4, a 9-year-old boy with osteosarcoma on the left distal femur. b Visualization of Bone infection. Patient 5, a 72-year-old male with chronic suppurative osteomyelitis of the lower right femur; Patient 6, a 31-year-old male with tuberculosis of lumbar vertebrae 3 and 4 with spinal canal stenosis; Patient 7, a 68-year-old female with tuberculosis of left knee joint; Patient 8, a 65-year-old male with right distal femoral osteomyelitis. Starting from the left, the first column is the original flat film image. The second column is an area cut as small as possible against the edge of the lesion. The third column is the GradCAM-generated heat map. The fourth is the heat map generated by ScoreCAM.
Radiologist interpretation
Diagnosis of the ensemble model and radiologists across different types of PBTs and bone infections were explicated in Supplementary Tables 6 and 7, specifically. Some bone tumors were classified incorrectly by experts but correctly by the model (Fig. 5). Giant cell tumors of bone (Fig. 5a) may exhibit obvious aggressiveness, resulting in the blurring of the boundary between the lesion and normal bone, wormlike and ethmoidal bone destruction, and soft tissue masses beyond the bone envelope. There is partial image overlap with malignant bone tumors and infections (such as Brodie abscess) on plain film29. Synovial osteo-chondromatosis (Fig. 5b) is characterized by multiple cartilage nodules in the joint lumen. When the cartilage nodules are not significantly calcified, especially when bone erosion is present at the same time, it is difficult to distinguish osteoarthritis with free bodies in the joint30. There are also cases where both experts and models misclassify. Chondrosarcoma (Fig. 5e) involving the pelvis is more likely to occur in the iliac wing than in the acetabulum. Intramedullary osteolytic lesions with poorly defined acetabular boundaries may be consistent with chondrosarcoma, as well as tuberculosis and osteoarthritis of the hip. The overlap of the structure in plain film makes the calcification of the circular or arc-shaped chondroid stroma, a typical manifestation of chondrosarcoma at the acetabulum, not obvious, and appears to be suspected involvement of the adjacent femoral head. Multiple myeloma (Fig. 5f) tends to occur in the thoracic vertebrae and has a positive pedicle sign (destruction of the vertebral body but retention of the pedicle). When both the vertebral body and pedicle are destroyed at the same time, it is necessary to distinguish them from spinal metastasis and spinal tuberculosis with insignificant paravertebral abscess31. There are also cases where the experts got the classification right and the model got it wrong. Sclerosing osteosarcoma has no obvious bone destruction, which is different from the common mixed osteosarcoma with both osteolytic and sclerosing (Fig. 5c). Giant cell tumors of bone occur mostly in the long bone, but can also occur in the vertebral body (Fig. 5d). These relatively uncommon conditions can be recognized by radiologists with extensive clinical experience. However, due to limited training on rare cases, the model tends to focus more on interpreting the more frequently encountered chronic osteomyelitis and spinal tuberculosis.
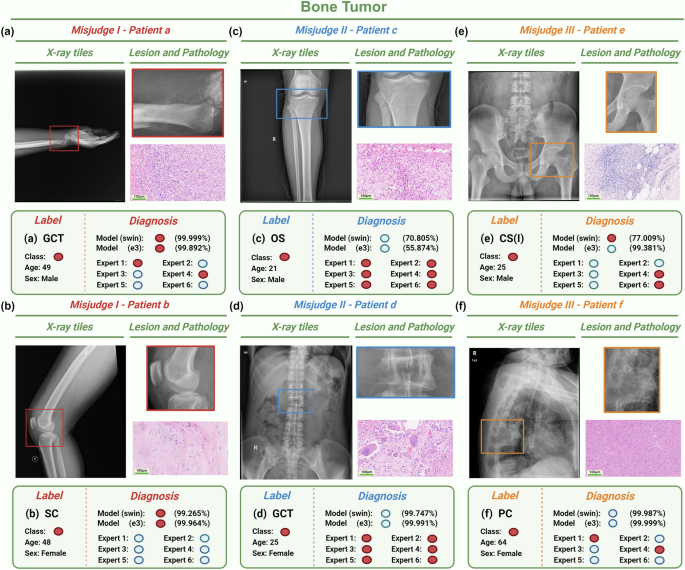
a, b The models mostly predict correctly but the experts mostly predict incorrectly based on the radiographs from Patient a and Patient b. c, d The models mostly predict incorrectly but the experts mostly predict correctly based on the radiographs from Patient c and Patient d. e, f Both of the models and the experts mostly predict incorrectly based on the radiographs from Patient e and Patient f. Model classification shows the probability of SWIN model and E3 model, which respectively correspond to the best and worst predictions in the imaging models. Red circles refer to bone tumors. Blue circles refer to bone infections. Bar = 100 μm. E3 EfficientNet B3, SWIN swin transformers, GCT giant cell of bone, SC Synovial chondromatosis, OS osteosarcoma, CS Chondrosarcoma, PC plasmacytoma. Note: Fig. 5 was Created with BioRender.com.
Some bone infections were classified incorrectly by experts but correctly by the model (Fig. 6). Chronic sclerosing osteomyelitis (Garre osteomyelitis, Fig. 6a) mainly presents with osteosclerosis and lack of dead bone formation, and needs to be distinguished from sclerosing osteosarcoma32. When lumbar tuberculosis (Fig. 6b) involves only a single vertebral body and lacks paravertebral space narrowing, formation of paravertebral cold abscess, and soft tissue calcification, it should be differentiated from plasma-cell tumor and giant cell tumor of bone. There are also cases where the experts got the classification right, and the model got it wrong. There is partial overlap between acute suppurative osteomyelitis (Fig. 6d) and Ewing sarcoma. Although the image manifestations of joint tuberculosis (Fig. 6c) occurring in the elbow joint are relatively typical, the number of training cases of joint tuberculosis in the extremities is limited for the model, and more common training cases of tuberculosis come from spinal tuberculosis, resulting in a decrease in the accuracy of model interpretation. There are also cases in which both experts and models misclassify. Brodie abscess appears as a single osteolytic lesion on X-ray, accompanied by peripheral sclerosis with decreasing degree of peripheral sclerosis, which is difficult to distinguish from osteosarcoma and osteoid osteoma (Fig. 6f). When not accompanied by obvious sclerosis, it is difficult to distinguish Langerhans histiocytosis and Ewing sarcoma (Fig. 6e)33.
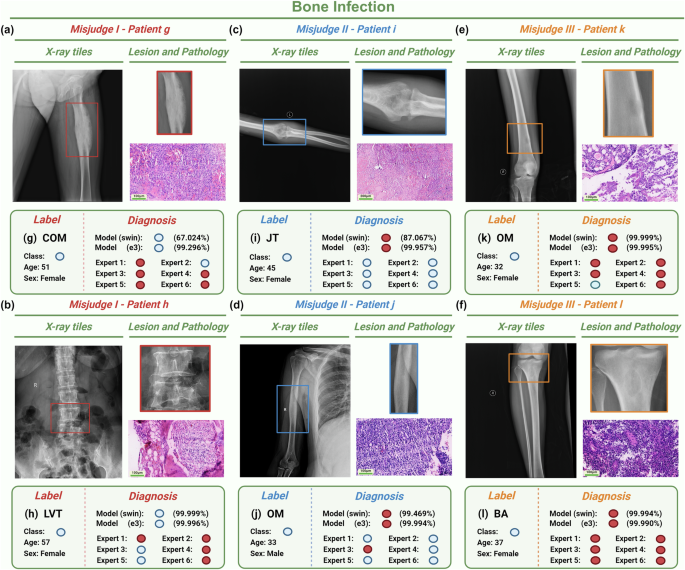
a, b The models mostly predict correctly but the experts mostly predict incorrectly based on the radiographs from Patient g and Patient h. c, d The models mostly predict incorrectly but the experts mostly predict correctly based on the radiographs from Patient i and Patient j. e, f Both of the models and the experts mostly predict incorrectly based on the radiographs from Patient k and Patient l. Model classification shows the probability of SWIN model and E3 model, which respectively correspond to the best and worst predictions in the imaging models. Red circles refer to bone tumors. Blue circles refer to bone infections. Bar = 100 μm. E3 EfficientNet B3, SWIN swin transformers, COM chronic osteomyelitis, LVT lumber vertebra tuberculosis, JT joint tuberculosis, OM osteomyelitis, BA brodie’s abscess. Note: Fig. 6 was Created with BioRender.com.
Discussion
Overall, our research introduced an innovative ensemble framework designed to detect and classify PBTs and bone infections concurrently. This framework incorporated two distinct single models: a radiograph-based imaging model and a clinical logistic regression model. By combining these models, we were able to enhance the classification accuracy of radiologists, surpassing the diagnostic capabilities of junior radiologists and aligning closely with those of medium senior radiologists. Our findings suggest that this ensemble approach holds promise for improving the accuracy and efficiency of detecting and classifying PBTs and bone infections in clinical settings.
In the realm of medical imaging, numerous deep learning models have been developed to aid in the diagnosis and classification of skeletal diseases using data from radiographs28,34,35, CT36,37,38, and MRIs39,40,41. However, the majority of these models have primarily concentrated on feature extraction from images and enhancing the accuracy of classification judgments to optimize model performance, neglecting the initial goal of utilizing deep learning as an auxiliary tool to enhance the diagnostic accuracy of clinicians. Consequently, our study aims to shed light on this issue by employing GradCAM and ScoreCAM to visualize the areas of focus within the models. In the course of our research, we have observed that GradCAM tends to prioritize the identification of bone hyperplasia and sclerosis, while overlooking areas of bone destruction. Conversely, ScoreCAM demonstrates a more balanced approach by highlighting both osteogenic and osteoclastogenic regions, resulting in a more precise delineation of lesion boundaries. This distinction underscores the importance of selecting the appropriate methodology for image analysis in order to achieve optimal results in the identification and characterization of bone abnormalities. Further investigation into the comparative effectiveness of these techniques may yield valuable insights for enhancing diagnostic accuracy and treatment planning in the field of medical imaging. Additionally, a group of experienced radiologists is enlisted to provide insightful clinical explanations for instances of misjudgment in representative cases, thereby facilitating a deeper comprehension of the models’ functionality and ultimately improving its utility in the medical field.
Manual annotations of ROI which served as ground truth for various deep learning models have long been regarded as a relatively challenging and intricate task, especially in CT- or MRI-based deep learning models37,42. Despite the continuous emergence of novel segmentation algorithms in recent years like Mask R-CNN, 3D CNN43,44 and so on, the segmentation performance of models built upon these algorithms often falls short of expectations. Issues such as misidentifying lesion locations or producing inaccurate segmentations frequently result in IoU and Dice scores that do not meet desired standards. Such discrepancies can introduce bias into subsequent classification model assessments and necessitate intricate manual verification and corrections in later stages. Therefore, in terms of research design, compared with multitask deep learning framework, our research prioritizes the accuracy and interpretability of the deep learning model. All of the segmentation and labeling of lesion areas in the radiographs are meticulously carried out by professional radiologists.
The utilization of deep learning techniques has significantly improved the clinical diagnosis of medical images in computer-assisted imaging settings. Despite these advancements, distinguishing between PBTs and bone infections remains a challenging task. Previous research has successfully developed and validated deep learning models for classifying different types of PBTs using radiographic and demographic data28,45. However, these studies primarily concentrate on categorizing benign, intermediate, and malignant PBTs, rather than differentiating bone tumors from other musculoskeletal diseases that may be easily confused with PBTs. It is worth noting that while MRI-based deep learning models have been created to enhance the diagnosis of patients with PBTs and bone infections42, biases were present in the patient data collection due to variations in diagnosis and treatment protocols across different medical centers. Furthermore, these studies have overlooked important biomarkers such as CRP, ESR, ALP, lactate dehydrogenase (LDH) and so on. Combining the completeness of clinical information can better restore the original appearance and characteristics of the disease. Our ensemble model which encompasses sufficient clinical information outperformed the other four models merely based on the image data. These cases underscore the necessity for more systematic approaches to data gathering and organization, encompassing a broader spectrum of bone lesions and data points to enhance the accuracy of the models.
This study has limitations. Firstly, bone infections are more common than PBTs and benign subtypes in PBTs are far more common than malignant ones. However, because the hospitals selected were regionally superior medical centers, patients with intractable diseases have high tendency. Secondly, our external validation set includes a children’s specialty hospital (Hospital 3), while it does help increase the diversity of our study population to some extent, making our research more representative, it may introduce some bias in terms of population distribution. Thirdly, the segmentation and labeling of lesion areas in the radiographs were entirely carried out by radiologists manually, making the research multifarious, although it may bring better work. In addition, in the collection process of clinical information, we found that for some examination like ALP and LDH, not all patients need this examination. In addition, doctors from different hospitals and departments may also exist examination preference, which lead to large amount of missing information. In the future, more cases with radiograph images from representative hospitals and more standardized collection of clinical information need to be researched to improve the generalizability and completeness of the model.
This groundbreaking study introduces a radiograph-based deep learning framework designed to enhance the classification of PBTs and bone infections, while also elucidating the clinical interpretation of these models. The ensemble deep learning framework, utilizing multicenter radiographs and clinical data, significantly improves the diagnostic accuracy for the binary classification. The results of the model have been meticulously visualized and professionally explained by expert radiologists. The ensemble model is more accurate and reliable in diagnosis compared with radiologists. These findings hold immense potential to guide orthopedic surgeons in making informed treatment decisions, thereby facilitating timely interventions for patients in need.
Methods
In this research, the methodology is mainly composed of data collection, preprocessing, annotation, model design, and development. The subsequent analysis was performed in compliance with all relevant ethical regulations, including the Declaration of Helsinki, as approved by the institutional review board of human studies of the Second Xiangya Hospital of Central South University (protocol number: no.2022-040) (Hospital 1). In addition, this retrospective study was approved by the local institutional review boards of Xiangya Hospital of Central South University (Hospital 2) and Hunan Children’s Hospital of Central South University (Hospital 3), and informed consent was waived because of the retrospective nature28. The study was performed in accordance with national and international guidelines, and followed the recommended guidelines Checklist for Artificial Intelligence in Medical Imaging (CLAIM) guidelines (Supplementary Table 8)46.
Research participants and data
This retrospective multicenter study collected patients via consecutive sampling between 2013 and 2022 from two cohorts: training cohort (from Hospital 1) and testing cohort (from Hospital 2 and Hospital 3) (Supplementary Fig. 1). After screening, 1569 patients diagnosed of PBTs or bone infections with histopathology reports available as reference were finally included in the internal dataset. While 423 patients from another two medical centers were collected for validation (Fig. 2a and Supplementary Fig. 1). These lesions were identified to have bone involvement through preoperative radiographs and were histologically diagnosed following biopsy or surgery. The criteria for evaluating the accuracy of both expert classifications and model classifications are grounded in pathological results, serving as the “ground truth”. (i) For the inclusion criteria, lesions were confirmed and diagnosed as PBTs according to the 2020 World Health Organization (WHO) system for the classification for tumors of bone1 while bone infections were confirmed and proven by histology and (or) bacterial culture. The other vital inclusion criteria are evident as well as available clinical information and preoperative radiographs. (ii) The screening criteria were respectively described in Fig. 2b: (a) radiographs were from patients diagnosed between 2013 and 2022 (b) in selected three hospitals; (c) radiographs with robust quality for reliable assessments of the bone lesions and (d) all of these radiographs were preoperative. With reference to previous literature42,45,47, clinical characteristics of the included patients’ contained age, gender, lesion position (appendicular or axial), “whether the lesion painful ?”, “whether the lesion swelling ?”, “whether a recent history of trauma ?”, and we further collected examination data including C-reactive protein (CRP), erythrocyte sedimentation rate (ESR), and alkaline phosphatase (ALP). All of the clinical data of the patients were reviewed and obtained from the patients’ electronic medical records after data desensitization and standardization.
Image preprocessing and annotation
During the preprocessing stage, all of the radiographs were screened and selected based on the inclusion and exclusion criteria above. Notably, radiograph images like artifacts or foreign bodies which might significantly hinder the observation of lesions were regarded as poor-quality radiographs. One senior seniority radiologist (Y.H.) with systematic musculoskeletal fellowship training (12 years work experience) and one medium seniority clinical orthopedist (C.T.) (8 years work experience) independently reviewed these radiographs without the patients’ information, and the quality of them would decide by consensus. Radiographs were kept and downloaded as Digital Imaging and Communications in Medicine (DICOM) files from the picture archiving and communication system (PACS) at their original sizes and resolutions. All of these radiograph images have undergone desensitization processing of disengaging patient-protected health information from DICOM data to meet the relevant legal criteria and requirements of US (HIPAA) as well as European (GDPR)42. Delineating the region of interest (ROI) was performed by two proficient radiologists (Y.Q. with 3-5 years of experience and J.G. with 3-5 years of experience in screening musculoskeletal radiographs images). ROIs were meticulously outlined via Click 2 Crop (version 5.2.2) (https://click-2-crop.en.softonic.com/) to closely segment pertinent entities present in each PBT or bone infection. Instances where disagreements arose between the two radiologists regarding contentious boundaries of these entities were subjected to further scrutiny. In such cases, a distinguished senior radiologist (Y.H.), boasting an impressive 12 years of experience in screening musculoskeletal radiographs, undertook the task of confirming the final delineations of ROIs. The smallest rectangular box that can completely cover the ROI was manually annotated as the boundary box by senior seniority radiologist (Y.H.) to ensure accuracy. Afterward, the annotated ROIs were used as ground truth for the model development process.
Design of the imaging models
For the classification of the radiographs, imaging models were built upon four distinct neural networks: EfficientNet B3 (E3), EfficientNet B4 (E4), Vision Transformer (ViT), and Swin Transformers (SWIN)48,49,50. These models were selected based on their state-of-the-art performance in image classification tasks and their ability to capture diverse features from medical images. Specifically, EfficientNet represents a lineage of Convolutional Neural Networks (CNNs) that utilize compound scaling to harmonize the depth, width, and resolution of the network, achieving optimal performance with fewer parameters compared to traditional CNNs50. Thanks to this innovative methodology, EfficientNet consistently attains state-of-the-art accuracy, yet with markedly fewer parameters. This makes it a prime choice for an array of computer vision applications50,51. The Vision Transformer (ViT) introduces a novel architecture that processes images as sequences of patches using Transformer blocks, originally designed for natural language processing tasks. This architecture has demonstrated significant potential in handling visual data. The Swin Transformer further refines this approach by incorporating a hierarchical structure and local self-attention mechanisms, enabling it to manage diverse resolutions and scales effectively. Collectively, these models represent some of the most advanced frameworks in computer vision.
Addressing the constraints of our limited label data, we adopted a transfer learning strategy. All four imaging models were initialized with weights pre-trained on the extensive ImageNet dataset, followed by fine-tuning on our proprietary bone dataset52. The original classification heads of these models, designed for 1000-class classification, were replaced with a single output node equipped with a sigmoid activation function to facilitate binary predictions (PBTs vs. bone infection).
Model training and evaluation
The internal dataset from Hospital 1 was partitioned into training, validation, and test set at a ratio of 7:1:2, respectively. The dataset from Hospital 2 and Hospital 3 was set aside as an external test set to evaluate the generalizability of our models across different data sources. Each of the four imaging models was trained independently using a batch size of 128 over 100 epochs. We employed Binary Cross-Entropy loss as our loss function. Optimization of the model was achieved through Stochastic Gradient Descent with an initial learning rate of 0.1. This rate was decayed by a factor of 10 every 30 epochs. For testing, we utilized the weights from the epoch exhibiting the best performance on the validation dataset.
Our algorithms were developed in Python 3.7 and executed on a machine equipped with an NVIDIA RTX 3090 GPU. The deep learning framework used in this study is PyTorch. In terms of data preprocessing, all images underwent resizing and normalization. Specifically, images were resized to a resolution of 224 × 224 pixels and normalized using the mean and standard deviation of the training dataset. To further enhance performance, we incorporated standard data augmentation techniques during training, including random horizontal and vertical flips with a probability of 0.5 for each.
Model ensemble
To further optimize performance, we integrated the predictions from the four imaging models (E3, E4, ViT, and SWIN) with traditional machine-learning models based on patients’ clinical characteristics. The hyperparameters utilized in the four imaging models and the ensemble model are depicted in Supplementary Table 9. Specifically, we designed and evaluated several machine-learning models, including Random Forest (RF), Adaptive Boosting (AdaBoost), Gradient Boosted Decision Trees (GBDT), Light Gradient Boosting Machine (LightGBM), Decision Tree (DT), Logistics Regression (LR), Extreme Gradient Boosting (XGBoost) and K-Nearest Neighbor (KNN). Given the missing clinical data and the significant differences in clinical features between PBTs and bone infections, the clinical characteristics included in the ensemble model were age, gender, and lesion location.
The construction of the ensemble model involved a two-step 5-fold cross-validation approach to avoid self-validation. In the first step, the four trained imaging models were used to score each patient (Supplementary Fig. 5). In the second step, these scores were integrated with clinical features using traditional machine-learning methods, with fivefold cross-validation utilized for hyperparameter tuning (Supplementary Fig. 6). Through systematic comparison, we determined that the ensemble model utilizing Random Forest achieved the highest AUC (Supplementary Fig. 7). The final ensemble framework integrates both clinical characteristics and imaging information, providing a comprehensive diagnostic tool for PBTs and bone infection classification.
Visualization and examples
To interpret the models’ predictions, we use GradCAM and ScoreCAM to visualize the regions that our model relies on for decision-making. GradCAM calculates the gradient of the target class score with respect to feature maps. It then applies global-average-pooling to these gradients to determine the importance weights for each feature map. This weighted combination, when subjected to a ReLU activation, produces a coarse localization map highlighting the most relevant image regions. As GradCAM is model-agnostic, it can be applied to four different models in our approach. In contrast, ScoreCAM, an extension of GradCAM, does not use gradients. Instead, it activates each feature map in the target layer individually and forwards these to obtain the class score. The final saliency map is derived by linearly combining the activation maps with their respective scores. This results in sharper and more precise visual explanations than GradCAM provides. Together, these two methods offer insights into the regions of an X-ray that our model considers essential for predictions.
Radiologist evaluation
To assess and contrast the precision of clinical doctors and the classification judgments made by various deep learning models, we have enlisted the participation of three distinct groups of radiologists varying in seniority. Within this study, three expert groups (EG) with different seniority were designed. Individuals classified as junior radiologists possessed 2–4 years of experience (Q.L. and J.G.) and were responsible for analyzing 1500 musculoskeletal radiograph reports annually (EG1). While senior radiologists (Prof. P. and Prof. L.) had accumulated over 10 years of experience in the field (EG3)42,47. In addition, we engaged another group of refresher radiologists (M.W. and Y.Z.) with 8–10 years of experience referred as medium seniority group (EG2). Each radiologist independently evaluated radiographs and associated clinical data using a conventional PACS system, with the diagnoses being made without prior knowledge of the pathological and/or bacterial culture results. The inter-reader reliability among radiologists were evaluated through Fleiss κ and Cohen κ53.
Statistics analysis
All statistical analyses were conducted using the opensource R software (version 4.2.3; R Foundation). Evaluation of the classification performance involved the use of the receiver operating characteristic (ROC) curve, along with metrics such as the area under the curve (AUC), accuracy, sensitivity, specificity, and confusion matrices. The mean AUC was specifically employed to assess the average performance of these four distinct imaging models. Statistical differences in clinicopathologic features among groups were analyzed using the Kruskal–Wallis rank-sum test for continuous variables and the chi-square test for categorical variables. Statistical differences between the AUC curves of different models were assessed using the DeLong test54, while the statistical differences between the models and radiologist experts were evaluated using the Cochran’s Q test55,56, which is appropriate for multiple sets of paired data. Calculation of 95% confidence intervals (CI) was performed using the Wilson method. P values below 0.05 were considered as statistically significant.
Responses