Deletion of Arntl, a component of the molecular clock, in adipocytes leads to cellular hypertrophy by increasing insulin sensitivity via FGF21

Introduction
The circadian rhythm of behavior and physiology is produced by the circadian clock system. The circadian clock system is regulated by an autoregulatory network of multiple clock genes at the level of gene expression, translation, and post-translational modifications1. In this system, brain and muscle Arnt-like protein 1 (BMAL1 encoded by Arntl gene) plays crucial roles as a transcription factor that regulates the circadian rhythm of gene expression2,3,4,5,6,7. BMAL1 forms heterodimers with circadian locomotor output cycles kaput (CLOCK), which drives transcription from E-box elements found in the promoters of circadian-regulated genes including period 1 and cryptochrome. Extensive gene expression analysis of mouse livers has revealed the presence of approximately 5900 BMAL1 binding sites in the genome, many of which are related to carbohydrate and lipid metabolism8,9. Global Arntl−/− mice show several severe phenotypes, including changes in the rhythmicity of behavior, circulating lipid and glucose levels, and ectopic fat formation in the liver and skeletal muscle10,11,12. Clock mutant mice are obese and develop metabolic syndromes, characterized by hyperleptinemia, hyperlipidemia, and hyperglycemia13. These results indicate that BMAL1 regulates energy metabolism in addition to controlling the circadian rhythm of behavior.
The link between the loss of BMAL1 function in adipose tissue and obesity has been reported. Significant decreases in the expression levels of Arntl and its targets have been observed in the adipose tissue of obese humans and mice14,15,16,17,18,19. ARNTL methylation is significantly correlated with anthropometric parameters such as body mass index and adiposity20,21. In addition, ARNTL polymorphisms are significantly associated with central obesity and sex-specific effects on ARNTL-mediated genetic susceptibility to obesity22. The studies with mice model have suggested that dysregulation of lipolysis in adipose tissue is a contributing factor23,24. While several reports have shown a relationship between the loss of BMAL1 functions and obesity as described above, the precise mechanism by which Arntl dysfunction leads to obesity has not been fully understood.
Here, we show that the deletion of Arntl in adipocytes led to increased cellular insulin sensitivity, which in turn, inhibited lipolysis in adipocytes and caused cellular hypertrophy. The mechanism underlying this increase in insulin sensitivity involves increased FGF21 expression levels in adipocytes. These results indicated that BMAL1 regulates fat mobilization and insulin signaling in adipocytes via FGF21 during the stationary phase.
Results
Deletion of Arntl in adipocytes reduced lipid mobilization during the stationary phase
The deletion of Arntl gene specifically in adipose tissue of mice was assessed by PCR genotyping of tissues (Supplementary Fig. 1a). Arntl gene was deleted in the epididymal white adipose tissue (eWAT) of AAKO mice (homozygous for the Arntl conditional allele (Arntl flox/flox) carrying the Cre recombinase transgene (Adipoq-Cre)). No excised alleles of Arntl gene defects were found in the adipose tissue of either mice homozygous for the Arntl conditional allele but not carrying Cre recombinase or mice carrying Cre recombinase without the Arntl conditional allele. No genetic defects were found in the livers of all types of mice (Supplementary Fig. 1a). The gene expression levels of clock genes and clock-controlled genes in the eWAT of AAKO mice were greatly varied, indicating disruption of clock function (Supplementary Fig. 1b).
We then investigated the respiratory quotient (RQ) to characterize the metabolic activity of AAKO mice. While the RQ values in Arntl flox/flox mice displayed a circadian rhythm, those in AAKO mice were almost constant throughout the day and were higher than those in Arntl flox/flox mice during the stationary phase (Fig. 1a). In contrast, the food intake level (Fig. 1b), locomotor activity (Fig. 1c), and VO2 value (Fig. 1d) did not differ between the genotypes (Fig. 1b–d). The higher RQ value in AAKO mice compared to Arntl flox/flox mice suggested lower utilization of fat as an energy source in AAKO mice (Fig. 1a). Thus, to confirm this hypothesis, we measured blood biochemical parameters, including non-esterified fatty acids (NEFA), triglyceride (TG), cholesterol, glucose, and leptin levels (Fig. 1e). The results presented in Fig. 1e show that serum NEFA levels were lower in AAKO mice than Arntl flox/flox mice at ZT10 (Fig. 1e). Although the eWAT weight per BW did not differ between the genotypes (Fig. 1f), histological analysis showed that adipocytes in the eWAT were larger in AAKO mice than Arntl flox/flox mice at ZT10 (Fig. 1g).

a–d Metabolic activity of Arntl1flox/flox and adipocyte-specific Arntl1-knockout (AAKO) mice under a 12-h light-dark cycles . a Left, respiratory quotient (RQ) (n = 6). Right, the area under the curve (AUC) was calculated for respective group. b Left, food intake. Right, the sum of food intake for 24 h was calculated for respective group (n = 6). c Left, locomotor activity (n = 10). Right, the sum of locomotor activity for 24 h was calculated for respective group. d Left, oxygen consumption (VO2). Right, the AUC was calculated for respective group (n = 6). e Serum non-esterified fatty acid (NEFA), cholesterol, triglyceride, blood glucose, and leptin levels in mice (n = 4–5). f Left, body weight (BW). Right, the epididymal white adipose tissue (eWAT) weight relative to BW. g Left, quantification of adipocyte size in the eWAT. Right, representative image of hematoxylin and eosin (H&E) staining of the eWAT (right). Data are presented as the mean ± standard deviation (SD) and compared using two-way analysis of variance (ANOVA) with Bonferroni’s post-hoc test. *P < 0.05, **P < 0.01 relative to the Arntlflox/flox mice at the same timepoint. Rhythmicity was calculated using CircWave software. R, rhythmic expression (P < 0.05); N, non-rhythmic expression (P > 0.05).
Deletion of Arntl in adipocytes reduced lipolysis in the eWAT during the stationary phase
The results shown in Fig. 1 indicate that the deletion of the Arntl gene in adipocytes decreased the serum levels of NEFA, resulting in an increase in adipocyte size. The expression level of genes related to lipolysis and lipogenesis in the eWAT were not significantly different between the two genotypes (Supplementary Fig. 2). Hormone sensitive lipase (HSL) is an intracellular lipase responsible for releasing NEFA from adipose tissue into the circulation. Phosphorylation at Ser563 and Ser660 activates HSL, whereas phosphorylation at Ser 565 inhibits its activity25,26,27. Deletion of the Arntl gene in adipocytes decreased the phosphorylation level of HSL at Ser563 and Ser660 residues in the eWAT (Fig. 2a). In contrast, the phosphorylation level of HSL at Ser565 was higher in the eWAT of AAKO mice than the eWAT of Arntl flox/flox mice at ZT10 and 16 (Fig. 2a). However, total HSL levels were not significantly different between the two groups (Fig. 2a). HSL phosphorylation is regulated by the cAMP-PKA pathway. To evaluate the activity of the cAMP-PKA pathway, phosphorylation status of cAMP response element binding protein (CREB) was determined. Deletion of the Arntl gene in adipocytes decreased the phosphorylation level of CREB at Ser133 residues in the eWAT (Fig. 2a). Indeed, cAMP level and PKA activity were lower in the eWAT of AAKO mice than the eWAT of Arntl flox/flox mice at ZT10 (Fig. 2b, c). Furthermore, the activity of phosphodiesterase (PDE), which is responsible for cAMP degradation, was significantly higher in AAKO mice than Arntlflox/flox mice at ZT10 (Fig. 2d).
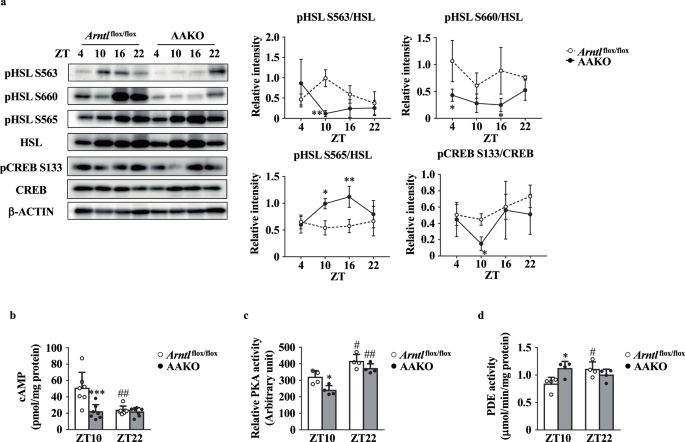
a Left, representative western blot of total hormone-sensitive lipase (HSL), phosphorylated HSL, total cAMP response element binding protein (CREB), and phosphorylated CREB in the eWAT. β-ACTIN was used as loading control. Right, the relative intensities of the bands were analyzed using Amersham ImageQuant TL (n = 3). b cAMP levels (n = 7). c PKA activity (n = 4). d Phosphodiesterase (PDE) activity (n = 4). Data are represented as the means ± SD and were compared using two-way ANOVA with Bonferroni’s post-hoc test (a) or Tukey’s post-hoc test (b–d). *P < 0.05, **P < 0.01, ***P < 0.001, relative to Arntlflox/flox mice at the same timepoint and #P < 0.05, or ##P < 0.01 relative to ZT10 in the same genotype.
Deletion of Arntl in adipocytes increased insulin sensitivity in the eWAT during the stationary phase
The activity of cAMP-PKA signaling pathway is tightly regulated by insulin28,29. The deletion of Arntl in adipocytes had no effect on serum insulin levels (Fig. 3a). Therefore, to evaluate insulin sensitivity, the mice were subjected to insulin tolerance test (ITT). The results showed that the insulin-dependent whole-body glucose disposal rate was faster in AAKO mice than in Arntl flox/flox mice at ZT10, but not at ZT22 (Fig. 3b).
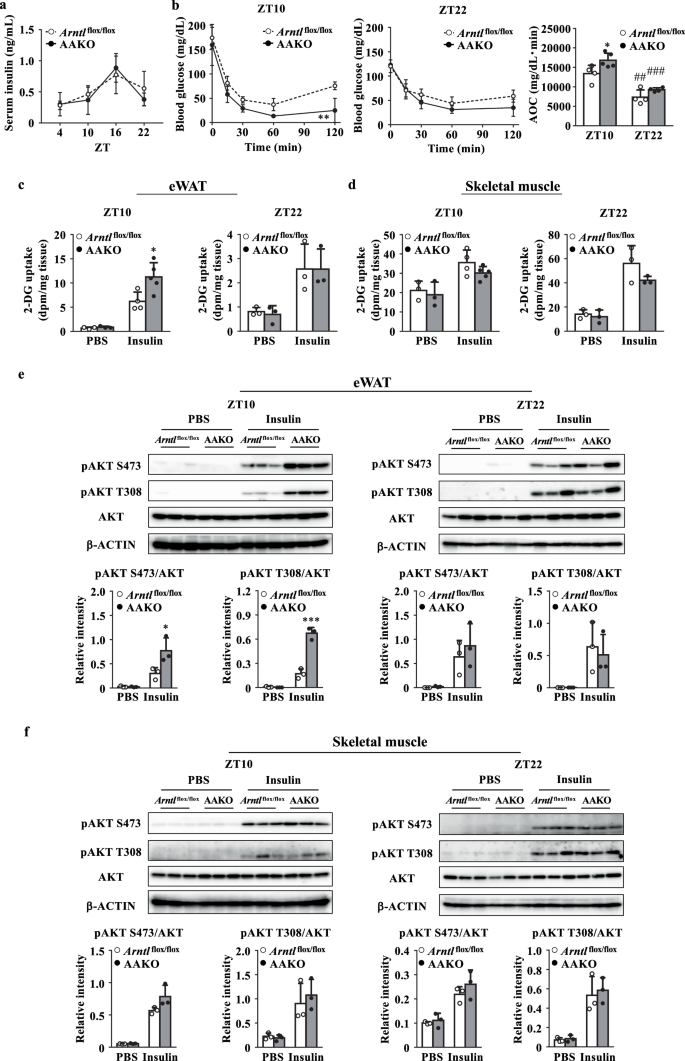
a Serum insulin levels in mice (n = 3–5). b Blood glucose levels during the insulin tolerance test (ITT) at ZT10 and ZT22 and the area over the curve (AOC) was calculated for respective group (right, n = 4–5). c,d [3H]-2-deoxyglucose (2-DG) uptake rate in tissue at ZT10 (left) and ZT22 (right). c eWAT. d Skeletal muscle. e,f Top, representative western blot of total AKT and phosphorylated AKT at ZT10 and ZT22. β-ACTIN was used as a loading control. Bottom, the relative intensities of the bands were analyzed using Amersham ImageQuant TL (n = 3). e eWAT. f Skeletal muscle. Data are presented as the mean ± SD and were compared using two-way ANOVA with Bonferroni’s post-hoc test (a,b left and center) or Tukey’s post-hoc test (b right, c–f). *P < 0.05, **P < 0.01, ***P < 0.001 relative to Arntlflox/flox mice at the same timepoint or treatment and ##P < 0.01, or ###P < 0.001 relative to ZT10 in the same genotype.
The glucose uptake rate in tissues was measured using [3H]-2-DG30. The results showed that insulin-dependent [3H]-2-DG uptake was higher in the eWAT of AAKO mice than the eWAT of Arntl flox/flox mice at ZT10 but not at ZT22 (Fig. 3c). In contrast, the insulin-dependent glucose uptake ratio in the skeletal muscle was comparable between Arntl flox/flox and AAKO mice at both ZT10 and ZT 22 (Fig. 3d).
The insulin signal transduction activity in the eWAT was evaluated by determining the phosphorylation level of AKT. The insulin-dependent phosphorylation levels of AKT at Ser473 and Thr308 were higher in the eWAT of AAKO mice than the eWAT of Arntlflox/flox mice at ZT10, but not at ZT22 (Fig. 3e). At all times examined, the status of the insulin-dependent phosphorylation of AKT in the skeletal muscle was similar between AAKO mice and Arntl flox/flox mice, as was the insulin-dependent glucose uptake (Fig. 3f).
Deletion of Arntl increased Fgf21 gene expression level indirectly via REV-ERBα in adipocytes
Gene expression analysis of the factors associated with insulin sensitivity in the eWAT revealed that the expression levels of Fgf21 and β-klotho, the co-receptor for FGF21, were significantly elevated in AAKO mice compared to Arntl flox/flox mice (Fig. 4a, b). The expression of cFos and early growth response protein 1 (Egr1), representative target genes of FGF21 signaling pathway, was induced in the eWAT by the deletion of Arntl (Fig. 4b). An increase in FGF21 protein levels was also observed after the deletion of Arntl in the eWAT (Fig. 4c). Serum FGF21 levels were similar between AAKO and Arntl flox/flox mice, except at ZT22 (Fig. 4d). Fgf21 expression in the liver, the major producing organ, was not different between Arntl flox/flox mice and AAKO mice (Fig. 4e). The upregulation of Fgf21 expression in the absence of Arntl suggested that Fgf21 gene expression may be under the negative control of BMAL1, presumably via the reverse orientation the c-erbA-1 gene (REV-ERBα), a transcriptional suppressor encoded by Nr1d1 gene31,32. c-erbA-1 is the thyroid hormone receptor alpha gene (Thra). Nr1d1 gene is transcribed from the opposite strand of the c-erbAα so that Nr1d1 and Thra are complementary on 269 bases33,34. Therefore, we used an siRNA to knockdown the expression of Nr1d1 in cultured 3T3-L1 adipocytes to determine whether Fgf21 expression is also regulated by REV-ERBα in adipocytes. The results shown in Fig. 4f indicated that the downregulation of Nr1d1 expression increased Fgf21 expression levels (Fig. 4f). E4BP4 (encoded by Nfil3) and RORα (encoded by Rora) are known to regulate Fgf21 expression35,36. The downregulation of Nr1d1 expression had no effects on the expression of these factors (Fig. 4f). Overexpression of Arntl in the cultured adipocytes also decreased Fgf21 expression levels, but this effect was counteracted by the knockdown of Nr1d1 expression in the cells (Fig. 4g). These results indicate that BMAL1 regulates Fgf21 expression via REV-ERBα. Inspection of Fgf21 promoter region revealed two putative retinoic acid receptor-related orphan receptor-responsive elements (ROREs) at positions −93 and −60, upstream of the transcription start site (Fig. 4h). Previous studies have shown that Fgf21 is regulated by REV-ERBα in the liver37,38. Recruitment of REV-ERBα to Fgf21/RORE in the genome was confirmed using a chromatin immunoprecipitation (ChIP) assay. In this ChIP assay, the mouse Arntl promoter region containing an RORE and part of the mouse Fgf21 gene, which lacks an RORE, were used as positive and negative controls, respectively. As shown in Fig. 4h, time-dependent recruitment of REV-ERBα to the promoter region encompassing Fgf21/RORE was observed in the eWAT of Arntl flox/flox mice but not AAKO mice (Fig. 4h).
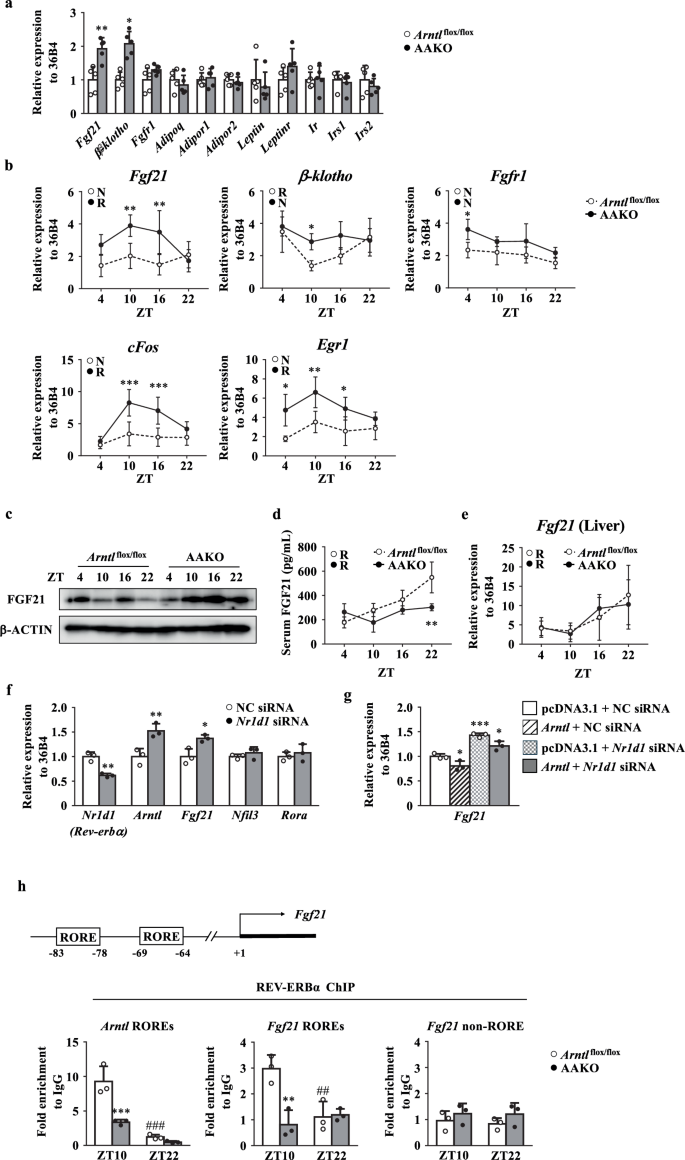
a Expression level of genes related to insulin sensitivity in the eWAT of Arntlflox/flox and AAKO mice at ZT10 (n = 5). b Circadian gene expression levels in the eWAT of Arntlflox/flox and AAKO mice (n = 3–5). c Representative western blot of FGF21 in the eWAT. β-ACTIN was used as a loading control. d Serum FGF21 levels in Arntlflox/flox and AAKO mice (n = 3–5). e Circadian gene expression levels of Fgf21 in the liver of Arntl flox/flox and AAKO mice (n = 3). f Gene expression levels of Nr1d1, Arntl, Fgf21, Nfil3, and Rora in negative control (NC) siRNA- or Nr1d1 specific siRNA-transfected 3T3-L1 adipocytes. g Gene expression levels of Fgf21 in NC siRNA- or Nr1d1 specific siRNA-and pcDNA3.1 empty or Arntl expression vector transfected 3T3-L1 adipocytes. h Top, schematic representation of the mouse Fgf21 promoter region. Bottom, chromatin immunoprecipitation (ChIP)–quantitative polymerase chain reaction (qPCR) analysis of the interaction between REV-ERBα and the retinoic-acid-receptor-related orphan-receptor-responsive element (RORE) in the mouse Fgf21 promoter region in the eWAT at ZT10 and ZT22 (bottom. n = 3). Non-immune IgG sample was used to normalize the qPCR results in each ChIP sample. The Arntl RORE region and Fgf21 non-RORE region were used as the positive and negative control, respectively. Data are presented as the mean ± SD. Data in (a, f) were compared using an unpaired Student’s t-test with Welch’s correction. *P < 0.05, **P < 0.01 relative to Arntlflox/flox mice (a) or NC siRNA-transfected 3T3-L1 adipocytes (f). Data in panels were compared using two-way ANOVA with Bonferroni’s (b,d,e) or Tukey’s (g,h) post-hoc test. *P < 0.05, **P < 0.01, ***P < 0.001 relative to Arntlflox/flox mice at the same timepoint (b,d,e,h) or NC siRNA- and pcDNA3.1 empty vector transfected 3T3-L1 adipocytes (g), ##P < 0.01, ###P < 0.001 relative to ZT10 for the same genotype (h). Rhythmicity was calculated using CircWave software. R, rhythmic expression (P < 0.05); N non-rhythmic expression (P > 0.05).
Deletion of Fgf21 in adipocytes abolished the metabolic phenotype in AAKO mice
To confirm whether the metabolic phenotypes of AAKO mice were due to local increase in FGF21 levels, we generated and analyzed the adipocyte-specific Arntl and Fgf21 double knockout mice (AdKO mice). The increased RQ values, decreased serum NEFA level, and adipocyte hypertrophy observed in the AAKO mice were not observed in AdKO mice (Fig. 5a–c). No differences in food intake level, locomotor activity, VO2 value, BW, or adipose tissue weight per BW were observed between the Arntlflox/floxFgf21flox/flox mice and the AdKO mice, as there were no differences between the Arntl flox/flox mice and the AAKO mice (Fig. 5d–g).
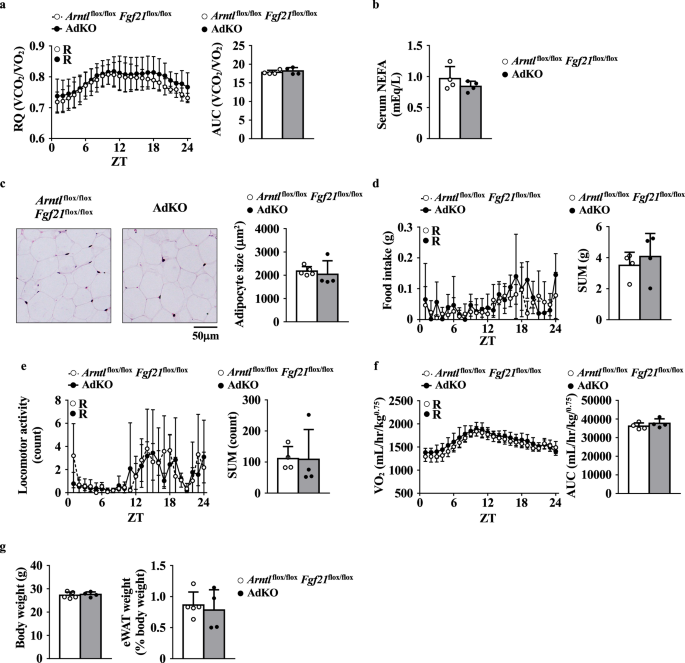
a Left, RQ. Right, the AUC was calculated for respective group (n = 4). b Serum NEFA levels in mice at ZT10 (n = 4). c Left, representative image of H&E staining of the eWAT. Right, quantification of adipocyte size in the eWAT at ZT10 (n = 4–5). d Left, food intake. Right, the sum of food intake for 24 h was calculated for respective group (n = 4). e Left, locomotor activity. Right, the sum of locomotor activity for 24 h was calculated for respective group (n = 4). f Left, VO2. Right, the AUC was calculated for respective group (n = 4). g Left, BW. Right, relative the eWAT weight per BW at ZT10 (n = 4–5). Metabolic activity of the Arntlflox/flox Fgf21flox/flox and the adipocyte-specific Arntl and Fgf21 double-knockout (AdKO) mice under a 12-hour light-dark cycles. Data are presented as the mean ± SD (a, d–f left) and were compared using two-way ANOVA with Bonferroni’s post-hoc test. Data in panels were compared using an unpaired Student’s t-test with Welch’s correction (a–f right, g). Rhythmicity was calculated using CircWave software. R, rhythmic expression (P < 0.05); N non-rhythmic expression (P > 0.05).
The ITT score of AdKO mice was equal to that of Arntl flox/floxFgf21flox/flox mice (Fig. 6a). In addition, insulin-dependent [3H]-2-DG uptake in the eWAT was similar between AdKO mice and Arntl flox/floxFgf21flox/flox mice (Fig. 6b). Furthermore, there were no significant differences in the insulin-dependent phosphorylation level of AKT in the between Arntl flox/floxFgf21flox/flox mice and AdKO mice (Fig. 6c). Serum insulin level in AdKO mice was comparable to that in Arntl flox/floxFgf21flox/flox mice (Fig. 6d). Also, the Fgf21 expression in the liver was not different between Arntl flox/floxFgf21flox/flox mice and AdKO mice (Fig. 6e).
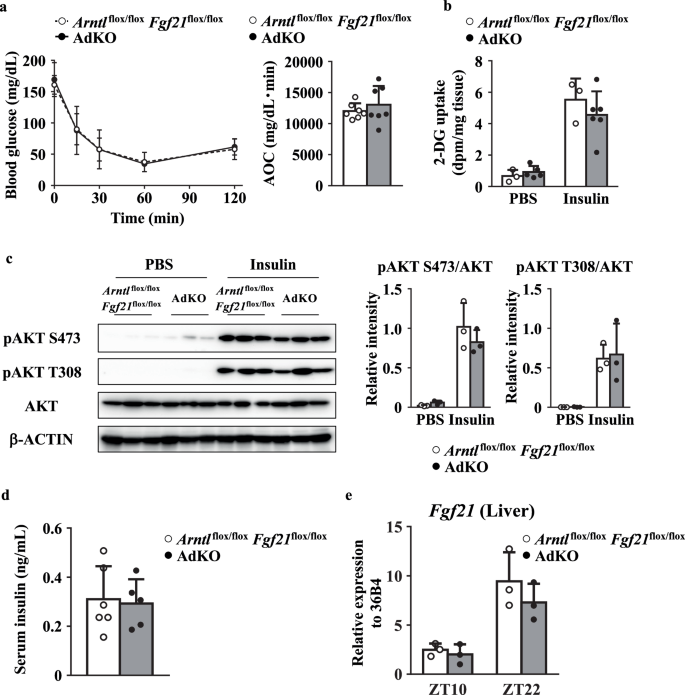
a Left, blood glucose levels in mice during the ITT at ZT10. Right, the AOC was calculated for respective group (n = 7). b Glucose uptake rate in the eWAT at ZT10 (n = 3–6). c Left, representative western blot of total AKT and phosphorylated AKT in the eWAT at ZT10. Right, the relative intensity of the bands. (n = 3). d Serum insulin levels in mice (n = 5). e Circadian gene expression level of Fgf21 in the liver (n = 3). Data are presented as the mean ± SD. Data in panels were compared using two-way ANOVA with Bonferroni’s (a left) or Tukey’s (b,c,e) post-hoc test. Data in panels (a right,d) were compared using an unpaired Student’s ttest with Welch’s correction. β-ACTIN was used as a loading control.
Discussion
This study aimed to understand the role of Arntl in adipose tissue. AAKO mice were used to demonstrate that loss of Arntl leads to adipocyte hypertrophy and a decrease in serum NEFA levels (Fig. 1e, g). These phenotypes were attributed to the lower lipolytic activity of the AAKO mice for several reasons. The studies using Clock mutant mice and global Arntl KO mice proposed that the loss of circadian expression of Hsl and Atgl results in adipocyte hypertrophy and reduced circulating NEFA levels23. The results in the current study showed that the HSL activation pathway signal in the eWAT was significantly weaker in AAKO mice than Arntl flox/flox mice (Fig. 2a–d). Because the HSL activation pathway in the eWAT is tightly regulated by insulin39,40,41,42, changes in insulin levels and/or sensitivity were responsible for the reduction in lipolytic activity in the eWAT of AAKO mice. In support of this, insulin sensitivity increased in the eWAT of the AAKO mice, whereas circulating insulin levels were similar between AAKO mice and Arntl flox/flox mice (Fig. 3a, c, e). Importantly, insulin sensitivity in the skeletal muscle was similar between AAKO mice and Arntl flox/flox mice (Fig. 3d, f). Increased lipogenesis and fatty acid uptake may also induce adipocyte hypertrophy. However, the expressions levels of genes related to lipogenesis, fatty acid uptake, and acetyl-CoA carboxylase (ACC) phosphorylation status in the eWAT were similar between AAKO mice and Arntl flox/flox mice (Supplementary Fig. 2). Therefore, we conclude that the increase in local insulin sensitivity in the eWAT and the subsequent reduction in lipolytic activity induced adipocyte hypertrophy and decreased circulating NEFA levels in AAKO mice.
Together with increased local insulin sensitivity, one of the most notable changes in the eWAT of AAKO mice was the induction of Fgf21 expression (Fig. 4a). FGF21, a cytokine secreted by various tissues including adipose tissue, increases insulin sensitivity in adipose tissue30. Most of the FGF21 produced in the liver is secreted into the circulation. In contrast, FGF21 produced in the adipose tissue is not secreted into the bloodstream and acts only on adipose tissue43,44. Therefore, the increase in local insulin sensitivity in the eWAT of AAKO mice can be attributed to a higher level of Fgf21 expression in the eWAT. Indeed, FGF21 target genes, including cFos and Egr1, were superinduced in the eWAT (Fig. 4b). To confirm the effects of locally produced FGF21, we demonstrated that the double knockout of Arntl and Fgf21 in adipocytes abolished phenotypes such as increased RQ, decreased circulating NEFA level, adipocyte hypertrophy, and increased insulin sensitivity in AAKO mice (Figs. 5, 6). It is well known that BMAL1 downregulates the transcription of Fgf21 by inducing REV-ERBα, a transcriptional suppressor in the liver38. Here we showed that this indirect transcriptional regulation of Fgf21 by BMAL1 also occurs in adipocytes (Fig. 4f–h). Retinoid-related orphan receptor alpha (RORα) antagonizes REV-ERBα on the RORE sequence45 and regulates Fgf21 expression in the liver36. However, the expression level of Rora in the eWAT was similar between AAKO mice and Arntlflox/flox mice (Supplementary Fig. 1b). Therefore, the increased gene expression levels of Fgf21 in the eWAT of AAKO mice was not due to increased expression levels of RORα but was associated with reduced expression levels of REV-ERBα and the consequent relative dominance of other positive transcriptional regulators, including RORα. E4BP4 strongly suppresses Fgf21 transcription by binding to a D-box element in the distal promoter region in the liver35. In the present study, deletion of Arntl increased the expression level of both Nfil3 (E4BP4) and Fgf21 in the eWAT (Supplementary Fig. 1b). Knockdown of Nr1d1 increased the Fgf21 expression but had no effects on the expression of Nfil3 in 3T3-L1 adipocytes (Fig. 4f). These results indicated that E4BP4 is not involved in the induction of Fgf21 expression in the eWAT of AAKO mice. Taking these results together, we conclude that BMAL1 plays a role in regulating insulin sensitivity and the consequent release of fatty acids, which are a major source of energy during quiescence, via indirect regulation of FGF21 expression by REV-ERBα in adipocytes.
Decreased circulating NEFA levels and adipocyte hypertrophy in mice due to the deletion of Arntl in adipocytes have also been reported by Paschos et al.24. The proposed mechanism is that the disruption of the adipocyte clock function results in temporal changes in the plasma concentration of polyunsaturated fatty acids, leading to corresponding changes in the expression of neurotransmitters responsible for appetite regulation in hypothalamic feeding centers. Therefore, mice lacking Arntl in adipocytes exhibit excessive food intake24. Also, the increased circulating leptin level was observed in the previous model24,46. However, in our study, the food intake level and the associated behavior were similar in AAKO mice and Arntlflox/flox mice (Fig. 1b). The level of circulating leptin and leptin gene expression in adipose tissue of AAKO mice was comparable to those of Arntlflox/flox mice (Fig. 1e and Supplementary Fig. 1b). The difference between our study and the above-mentioned study is that mice carrying Cre recombinase to establish adipocyte-specific Arntl mice. The previous study has used aP2 (Fabp4)-Cre mice. Several recent studies have shown that the aP2 (Fabp4) promoter is active not only in the adipose tissue but also in various other tissues including the hypothalamus47,48,49,50. Therefore, the mice generated using the aP2 (Fabp4)-Cre mice showed the change in food intake activity50. In the present study, the AAKO mice were generated by crossing Arntl flox/flox mice with the mice carrying the Cre recombinase gene driven by the adiponectin promoter. It has been reported that Cre expression driven by the adiponectin promoter leads to recombination that exclusively affects adipocytes51,52. The precise cause of the phenotypic differences between the two mouse models is unclear; however, we would like to emphasize that the loss of Arntl in adipocytes disrupts lipolysis and leads to cell hypertrophy, a common phenotype in both reports, and that the present study demonstrates a novel mechanism that generates these phenotypes.
Our results showed that the deletion of Arntl increased insulin signaling via the regulation of FGF21 expression in the eWAT of mice (Figs. 3, 4). Several reports showed that regulation of insulin sensitivity and insulin signaling by BMAL1 using tissue specific Arntl knockout mice. Deletion of Arntl in hepatocytes decreases insulin signaling activity and insulin sensitivity in the liver of the mice53,54. Hepatic BMAL1 binds to the promoter region of Sirt1, which encodes an NAD+-dependent histone deacetylase, to increase its expression level and regulate hepatic insulin sensitivity53. However, the expression level of Sirt1 in adipocytes was similar between AAKO mice and Arntlflox/flox mice (Supplementary Fig. 1b). Therefore, the BMAL1-SIRT1 axis may not be responsible for the increased insulin signaling activity in the eWAT of AAKO mice. While deletion of Arntl in the liver increased Fgf21 expression levels, insulin signaling in the liver was reduced (Supplementary Fig. 3)53,54. These results suggest that the BMAL1-FGF21 axis is a major pathway involved in the regulation of insulin signaling in adipocytes but not in hepatocytes in mice. The differences in the effects of Arntl deletion on insulin sensitivity between adipose tissue and the liver are partly accounted for the tissue specificity of Klb (β-klotho) expression55. Reduction of Nr1d1(REV-ERBα) expression induces Klb expression in adipose tissue but not the liver55. Since β−Klotho is an essential coreceptor for FGF21, downregulation of Nr1d1 (REV-ERBα) expression strongly activates FGF21 signaling and insulin sensitivity in adipose tissue. The induction of Klb expression and the activation of FGF21/Klotho signaling pathway were observed in the eWAT of AAKO mice (Fig. 4b and Supplementary Fig. 1b). Therefore, it can be concluded that BMAL1- REV-ERBα -FGF21 axis regulates insulin signaling in a tissue-specific manner.
In conclusion, disruptions of the circadian clock due to an irregular lifestyle such as shift work and a high-fat diet may impair fat mobilization and cause lipid accumulation in adipocytes, which may increase the risk of obesity and related diseases. Our present findings demonstrate the regulation of fat mobilization and insulin signaling by BMAL1 in adipocytes and this is the possible mechanism by which downregulation of Arntl and its targets induces obesity14,15,16,17,18,19. Also, since the activity of BMAL1 peaks during the stationary phase12, the regulation of fat mobilization by BMAL1 may be the mechanism by which fatty acids are used as an energy source during the stationary phase. Therefore, the results in this study also provide additional insight into by which the molecular circadian clock in adipocytes modulates whole-body energy metabolism.
Methods
Animal studies
Conditional Arntlflox/flox mice12, which carry the conditional Arntl allele containing exons 6 to 8 flanked by loxP sites, were crossed with mice carrying the Cre recombinase gene driven by the adiponectin promoter (The Jackson Laboratory, Bar Harbor, ME, USA). Mice homozygous for the floxed allele and hemizygous for the Cre transgene (adipocyte-specific Arntl knockout, AAKO) were obtained by crossing Arntlflox/-/CreAdipoq mice with Arntlflox/flox mice. Splicing of exons 6 to 8 should cause a deletion of the bHLH domain and a frameshift mutation with the introduction of an early stop codon (TGA)12. Genotyping was performed by PCR on DNA isolated from tail biopsies. The Arntl-excised allele was amplified by using primer A (5′- GGGGATTTCCATCTGTGTTTAC-3′) and primer B (5′- CTCATCTGCTTATCTGCTCTGGGG -3′). The conditional allele was amplified by using primer B and primer C (5′-TCAACGTTTCGATGCTCGTG-3′). Littermates that were negative for Cre transgenes (Arntlflox/flox) were used as experimental controls. Arntlflox/flox Fgf21flox/flox mice were generated by breeding Arntlflox/flox mice with Fgf21flox/flox mice (The Jackson Laboratory). Arntlflox/flox Fgf21flox/flox mice were used to generate adipocyte-specific Arntl and Fgf21 double-knockout mice (AdKO mice) in the same manner as described above. All animals were maintained in groups of 3 to 5 animals per cage under a 12-h light-dark cycle at 23 ± 1 °C and 50 ± 10% relative humidity. Food and water were provided ad libitum. Male mice (16 to 20 weeks old) were randomly grouped by cage and used in the experiment without any exclusion. All experimental mice were euthanized with carbon dioxide. The experimental methods and design adhered to the ARRIVE guidelines. The experimental protocol was approved by the Ethics Review Committee for Animal Experimentation of Nihon University (approval no. AP17P030) and was executed according to the relevant guidelines and regulations.
Metabolic studies
Mice were individually caged and acclimated for 2 days before measurements were performed. Daily food consumption, oxygen consumption, carbon dioxide production, and respiratory quotients were determined using the Oxylet Pro System (PANLAB, S.L.U. Barcelona, Spain).
Biochemical analysis
The levels of triglyceride (TG), total cholesterol (EKF Diagnostics-Stanbio Laboratory, Boerne, TX, USA), non-esterified fatty acids (NEFA) (Fujifilm Wako Pure Chemical Co. Ltd., Osaka, Japan), insulin, leptin (Morinaga Institute of Biological Science, Inc., Kanagawa, Japan), FGF21(R&D Systems, Minneapolis, MN, USA), and cAMP (Enzo Life Sciences, Farmingdale, NY, USA) were determined using commercial assay kits according to the manufacturer’s instructions.
Histological analysis
For histological analysis, the epididymal white adipose tissue (eWAT) was fixed in 10% formaldehyde, embedded in paraffin, sectioned at 5 µm, and stained with hematoxylin and eosin (H&E). The adipocyte area was measured for 50 adipocytes in each sample using cellSens imaging software (Evident Co., Tokyo, Japan).
Preparation of tissue extract
Tissue samples were added to a buffer (50 mM Tris-HCl [pH 8.0], 150 mM NaCl, 0.1% SDS, 1% NP-40, and 0.5% sodium deoxycholate) containing a protease inhibitor cocktail (Fujifilm Wako Pure Chemical) and a phosphatase inhibitor (Roche Diagnostics K. K., Tokyo, Japan) and homogenized using a Dounce grinder. After centrifugation for 10 min at 15,000 g, the resulting supernatant was desalted using Zeba Spin Desalting Columns (Thermo Fisher Scientific, Waltham, MA, USA) and assayed.
Western blotting
Proteins were resolved using sodium dodecyl sulfate-polyacrylamide gel electrophoresis (SDS-PAGE), transferred onto the membranes, and probed with relevant antibodies. Immunoreactive proteins were visualized using enhanced chemiluminescence detection reagents from Thermo Fisher Scientific and Cytiva (Marlborough, MA, USA). Images were cropped and adjusted for brightness and contrast. Uncropped and unprocessed images are shown in Supplementary Figs.4–8. Band intensity in uncropped and unprocessed images was quantified using Amersham ImageQuant TL (Cytiva). The anti-hormone sensitive lipase (HSL) antibody was purchased from Santa Cruz Biotechnology, Inc. (Dallas, TX, USA) and anti-phosphorylated HSL anti-cAMP response element binding protein (CREB), anti-phosphorylated CREB, anti-acetyl-CoA carboxylase (ACC) and anti-phosphorylated ACC antibodies were purchased from Cell Signaling Technology (Danvers, MA, USA). The anti-FGF21 antibody was purchased from ImmunoDiagnostics Limited (Sha Tin, Hong Kong) and the anti-β-ACTIN antibody was purchased from ProteinTech Group Inc. (Chicago, IL, USA).
Enzyme assay
The activities of protein kinase A (PKA) and phosphodiesterase (PDE) in the tissue extracts prepared as described above were determined using commercial assay kits according to the manufacturer’s instructions (Enzo Life Sciences)
Insulin tolerance test
The mice were fasted for 5 h before undergoing the insulin tolerance test (ITT). The ITT was performed by administering an intraperitoneal injection of insulin (2 U/kg body weight (BW); Eli Lilly, Indianapolis, IN, USA). Glucose levels were monitored before and after the injection using blood glucose strips (Arkray, Kyoto, Japan). The area over the curve (AOC) is then developed to quantify the total decrease in blood glucose during the ITT56.
[3H]-2-deoxy-D-glucose uptake assay
The [3H]-2-deoxy-D-glucose ([3H]-2-DG) uptake assay was performed as described by BonDurant et al. with some modifications30. Briefly, mice were fasted for 5 h and intraperitoneally administered an [3H]-2-DG solution containing 0.9% NaCl, 0.1 mM 2DG, and 32μCi/mL [3H]-2DG (American Radiolabeled Chemicals, Inc., Saint Louis, MO, USA) at 10 μL/g BW with or without insulin (2 U/kg BW). After 90 min, the eWAT and the gastrocnemius were harvested, lysed in 1 N NaOH at 80 °C for 30 min, and neutralized with 12 N HCl. The samples were separated into two aliquots and five volumes of either 6% perchloric acid (i) or Somogyi buffer containing an equal volume of 0.3 N Ba(OH)2 and 0.3 N ZnSO4 (ii) were added. The resulting precipitate was removed by centrifugation, and the radioactivity in the supernatant was measured using a liquid scintillation counter (TRI-CARB 4810 TR; PerkinElmer Life Sciences, Inc., Boston, MA, USA). The radioactivity, indicative of the amount of [3H]-2-DG uptake in each tissue sample, was determined by subtracting the measurement for (ii) from the measurement for (i) and dividing it by the tissue weight.
RNA isolation and reverse transcription quantitative polymerase chain reaction
Total RNA was extracted from the eWAT using RNA isoPlus (Takara Co., Ltd., Otsu, Japan). cDNA was synthesized from the total RNA (1.0 µg) using a reverse transcriptase (Toyobo Co., Ltd., Osaka, Japan), and cDNA was amplified using an AriaMx Realtime PCR System (Agilent Genomics, Santa Clara, CA, USA) using GoTaq qPCR Master Mix (Promega, Madison, WI, USA). The mRNA expression levels were normalized to 36B4 expression levels and are presented as relative levels. The primer sequences are listed in Supplementary Table 1.
Cell culture and transfection
3T3-L1 cells, obtained from the Human Science Research Resources Bank (Osaka, Japan), were maintained in Dulbecco’s modified Eagle medium (DMEM) supplemented with 10% calf serum. To induce adipocyte differentiation, the cells were grown to confluence. They were then cultured in a differentiation medium (a 3:1 mixture of DMEM and Ham’s F12 medium containing 10% fetal bovine serum, 1.6 μM insulin, 0.0005% transferrin, 180 μM adenine, 20 pM triiodothyronine, 0.25 μM dexamethasone (DEX) and 500 μM isobutylmethylxanthine (IBMX)). After 48 h, the cells were cultured in a fresh differentiation medium without DEX and IBMX and maintained for the following days. For RNA interference, on day 6 after the induction of adipocyte differentiation, a stealth small interfering RNA (siRNA) duplex targeting Nr1d1 (Mss211362, Thermo Fisher Scientific) or a negative control siRNA (112935-200, Thermo Fisher Scientific) was transfected with or without pcDNA3.1 (+) empty vector and pcDNA3.1 Arntl expression vector using Lipofectamine 2000 according to the manufacturer’s instructions (Thermo Fisher Scientific). The medium was replaced with fresh differentiation medium 24 h after transfection and the cells were then cultured for an additional 24 h.
Chromatin immunoprecipitation
The chromatin immunoprecipitation (ChIP) assay was performed as previously described57, with modifications for the eWAT. Briefly, the eWAT from 12-week-old Arntlflox/flox and AAKO mice was harvested at zeitgeber time (ZT) 10 and ZT22, cross-linked in 1% formaldehyde, and lysed. The tissue extracts were then subjected to immunoprecipitation using an anti-REV-ERBα antibody (Cell Signaling Technology). Parallel samples were incubated with non-immune IgG (Fujifilm Wako Pure Chemical) as the negative control. The DNA region was amplified and quantified using quantitative polymerase chain reaction (qPCR). Data are expressed as the fold enrichment of IgG.
The following PCR primers were used:
Arntl retinoic acid receptor-related orphan receptor-responsive element (RORE) -53/ + 31 (forward: 5’-GCCAATTCACATTTCAACCA-3’, reverse: 5’- GACACAAGGCAGCATTTCAA-3’),
Fgf21 ROREs -325/-55 (forward: 5’-ACTAAGGTGAAGATCCCAACCTCC-3’, reverse: 5’- CCCCACTCCTGACGCGTGATATTT-3’), and
Fgf21 non-RORE -3793/-3733 (forward: 5’-GTTGAGCGGGCTCCGTATAG-3’, reverse: 5’- GATAGTCTCCACGACGCACA-3’).
Statistical analysis
Statistical analyses were performed using GraphPad Prism 6 software (GraphPad Software, La Jolla, CA, USA). Data are expressed as the mean and standard deviation (SD). Differences between two groups were determined using an unpaired Student’ s t-test with Welch’s correction. Two-way analysis of variance (ANOVA) was performed on the genotype and one more condition experiment using Bonferroni’s or Tukey’s post hoc test. Circadian rhythmicity was assessed using the CircWave software58. Statistically significance was set at P < 0.05.
Responses