DeltaC and DeltaD ligands play different roles in the segmentation clock dynamics
Introduction
Metazoans use signaling pathways to control proper patterning of developing embryos. Notch signaling is one of those pathways, critical for both embryonic development and adult homeostasis1. Somites are the precursors of the vertebral disks and associated structures; sequential segmentation of somites is regulated by Notch signaling during embryonic development2,3. Mutations in Notch signaling pathway genes result in vertebral segmentation defects in all vertebrates (e.g., congenital scoliosis in patients)4.
The periodic segmentation of somites from the presomitic mesoderm (PSM) is governed by the vertebrate segmentation clock. The Hes/her family genes constitute the core of the segmentation clock in vertebrates; their mutation results in somite segmentation defects2,3. Transcription of Hes/her family genes are activated by Notch signaling5,6. During somite segmentation, the Notch receptor is activated by membrane-bound Delta family ligands. Upon binding to their ligands, the intracellular domain of Notch receptors (NICD) is cleaved and transported into the nucleus and acts as a transcriptional coactivator1. In zebrafish, both deltaC and deltaD are also essential for somite segmentation, as mutation in either gene results in segmentation defects7,8,9.
In zebrafish, the primary role of Notch signaling is to synchronize oscillations of the two segmentation clock genes, her1 and her7, among neighboring cells5,10,11,12,13. In Notch pathway mutants, oscillations of her1 and her7 are initially synchronous but then gradually drift out of synchrony among neighboring cells10,13. Consequently, while earlier-forming anterior somites are intact, later-forming posterior ones are defective7,8,9,10. In different delta gene loss-of-function mutants, the strength of Notch signaling might be reduced differently, resulting in formation of varying numbers of intact somites (e.g., 3-5 in dlctw212b3 mutants and 7-9 in dldtr233 mutants)7,8,9. In zebrafish, her1 and her7 clock genes can still be transcribed in Notch pathway mutants, explaining why single cells can continue to display asynchronous oscillations. This is likely due to another signaling pathway (i.e., FGF) contributing to the expression of segmentation clock in Notch pathway mutants14. In mice, Notch signaling controls synchronized oscillations of the segmentation clock as well15. On the other hand, for sustained oscillations to occur, transcription rate of clock genes needs to be very strong16; conditions violating this requirement can result in segmentation defects17,18,19.
DeltaC and DeltaD proteins form homo- and heterodimers20. Even though mutations in either gene result in segmentation defects, since only deltaC is identified as oscillating, it was hypothesized that the oscillatory DeltaC/DeltaD heterodimer is the primary ligand activating Notch signaling in zebrafish20. Because the onset of segmentation defects is earlier in dlctw212b mutant than dldtr233 mutant, it was further hypothesized that the oscillatory DeltaC/DeltaC homodimer is also functional, but the non-oscillatory DeltaD/DeltaD dimer is nonfunctional20 (Fig. 1p). These hypotheses generate important predictions about the transcript numbers of her1 and her7 genes in different mutants, but these predictions have so far not been quantitatively tested. Furthermore, existing computational models of the segmentation network assume that while the transcription of deltaC is repressed by Her1/Her7 proteins, it is not regulated by the Notch signaling independent of Her1/Her7 proteins16,21. Similarly, since transcription of deltaD is not repressed by Her1/Her7 proteins and consequently does not oscillate, existing models also assume that Notch signaling also does not regulate transcription of deltaD. These critical assumptions have also been left untested.
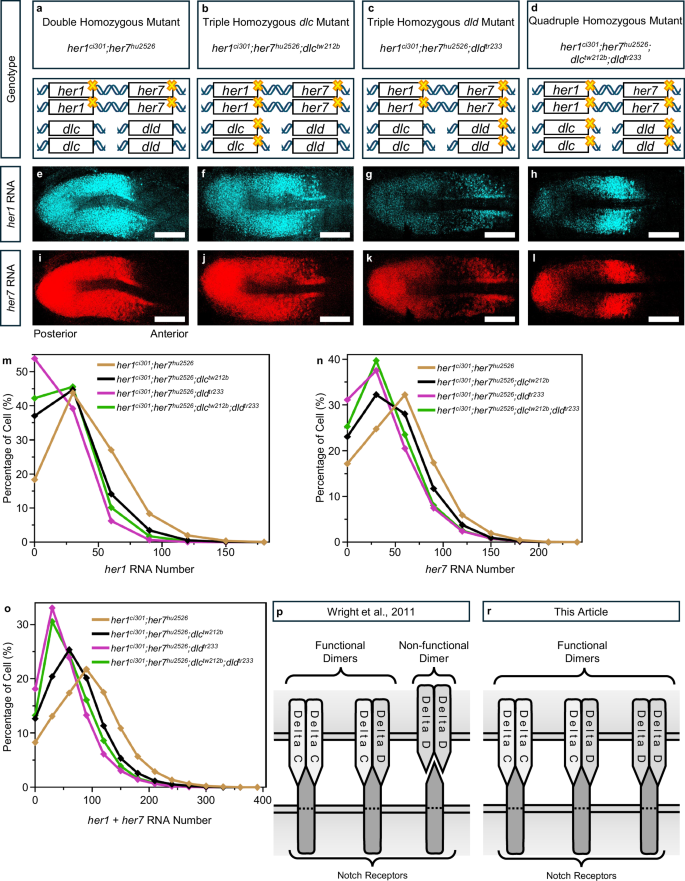
a–l, Yellow crosses indicate mutations on genes. smFISH experiment was performed in four different genotypes to show her1 (cyan) (e–h) and her7 (red) (i–l) RNA transcription. Representative images are maximum intensity projections of a z-stack. The scale bar is 100 μm, the left is posterior and the right is anterior end of PSM. m–o, Percentage of cells for specific her1 (m), her7 (n) and her1 plus her7 (total her) (o) RNA numbers in her1ci301;her7hu2526 (dark yellow, N = 2, n = 14, c = 25030), her1ci301;her7hu2526;dlctw212b (black, N = 2, n = 16, c = 28953), her1ci301;her7hu2526;dldtr233 (purple, N = 3, n = 13, c = 23555), her1ci301;her7hu2526;dlctw212b;dldtr233 (green, N = 2, n = 11, c = 14528) genotypes. Experimental, embryo, and cell numbers are represented as N, n, and c, respectively. p, r Cartoon model for functionality of delta ligand dimers according to Wright et al20. (p), and this paper (r). Source data are provided as a Source Data file.
Here, we performed quantitative single molecule fluorescent in situ hybridization (smFISH) experiments to quantify her1 and her7 RNAs in different mutants. Our results suggest that all above-mentioned assumptions are false: Contrary to the previous belief, the DeltaD homodimers are capable of activating Notch signaling and thereby increasing transcription of its two target segmentation clock genes, her1 and her7. Moreover, Notch signaling promotes transcription of both deltaC and deltaD genes, thereby creating a hitherto unnoticed positive feedback loop.
Results
DeltaD homodimer activates transcription more than DeltaC homodimer
Individual contributions of DeltaC and DeltaD ligands on the transcription of her1 and her7 was previously investigated by comparing RNA levels in wild-type versus deltaC and/or deltaD mutants by both semi-quantitative FISH5 and quantitative smFISH experiments6. However, three obstacles prevented an accurate one-to-one comparison and reaching a quantitative conclusion: (1) her1 and her7 levels oscillate synchronously in wild-type and asynchronously in mutants13. Thus, the dynamics of genetic backgrounds are not an “apples-to-apples” comparable. Because mutant cells oscillate asynchronously, cells at different oscillation phases will be intermingled at every spatial location. If mean expression of mutant cells at a given location is compared to that of wild-type cells at the highest oscillation phase, it will lead to one conclusion but comparing it to wild-type cells at the lowest oscillation phase will lead to the opposite conclusion. (2) Furthermore, the autoinhibitory negative feedback loop of Her1/Her7 proteins would compensate for expression level changes due to loss of NICD activity in delta mutants. Therefore, the comparison could be inaccurate. (3) There could be additional hidden feedback loops that would complicate interpretations due to feedback mediated compensations (see results below). To discover such hitherto hidden feedback loops and reach a definitive and quantitative conclusion, one should compare the contribution of each Delta ligand at a genetic background with comparable dynamics (“apples-to-apples” comparison) as we performed in this study.
To overcome these confounding factors, we utilized the her1ci301;her7hu2526 double homozygous loss-of-function mutant as the genetic background (Fig. 1a). In this mutant, oscillations of her1, her7, and deltaC are arrested, the intracellular negative feedback and intercellular positive feedback loop are eliminated, preventing their compensatory effects. We used these double homozygous mutants combined with either dlctw212b and/or dldtr233 mutants to generate three different compound mutants: her1ci301;her7hu2526;dlctw212b (Fig. 1b), her1ci301;her7hu2526;dldtr233 (Fig. 1c) and her1ci301;her7hu2526;dlctw212b;dldtr233 (Fig. 1d). We then quantified her1 and her7 RNAs in these four genetic backgrounds by smFISH experiments (Fig. 1e-l).
The single cells were then pooled independently of their spatial position and plotted as a frequency graph of cells with different RNA numbers. As expected, we found that her1 and her7 RNAs decreased in triple and quadruple mutants as compared to those in the double mutant (Fig. 1m–o). In the her1ci301;her7hu2526;dlctw212b and her1ci301;her7hu2526;dldtr233 mutants, the only remaining functional ligand dimers would be DeltaD or DeltaC homodimers, respectively. Based on the previously proposed hypothesis20 (Fig. 1p), one would expect her1 and her7 RNAs to decrease more in the her1ci301;her7hu2526;dlctw212b mutant than in the her1ci301;her7hu2526;dldtr233 mutant. Surprisingly, we obtained the opposite result, which suggests that DeltaD homodimers are also functional (Fig. 1r).
Delta proteins contribute equally to the transcription in the tailbud
Since our results suggested that the DeltaD homodimer contributes more than DeltaC homodimer to the transcription of her1 and her7 (when averaged across the whole PSM), we were left wondering why the onset of segmentation defects occurs earlier in dlctw212b than dldtr233 mutants. The segmentation clock instructs segment boundaries locally in the mid-PSM at a position called the segmental determination front22,23,24. This front is located at a distance equal to the length of three presumptive somites posterior from the last segmented somite boundary during mid-somitogenesis in zebrafish25. When the activity of Notch signaling is blocked, it takes approximately seven clock cycles before segmentation clock genes are desynchronized in the PSM5,11,12. Therefore, Notch signaling mainly operates in the tailbud to synchronize segmentation clock genes12. When Notch activity is blocked, only tailbud cells will spend adequate time in the PSM to become desynchronized before reaching the determination front.
Thus, we quantified how her1 and her7 RNAs change along the PSM in the different mutants. To that end, we averaged RNA numbers among cells located at different positions in the PSM by dividing the tissue into single-cell width sections6,26 (Fig. 2a). We found that her1 and her7 RNAs decreased in the cells located at the tailbud comparably in her1ci301;her7hu2526;dlctw212b and her1ci301;her7hu2526;dldtr233 mutants (Fig. 2b-g; Group 1). These results suggest that DeltaC and DeltaD homodimers function similarly in the tailbud cells. However, because only DeltaC dimers are oscillatory, synchrony between neighboring cells will be more compromised in dlctw212b than in dldtr233 mutants. Consequently, even though the cumulative RNA reduction in tailbud cells is similar in both genotypes, both desynchronization of clock oscillations and the onset of segmentation defects occur earlier in dlctw212b than dldtr233 mutants (see computational modeling results below).
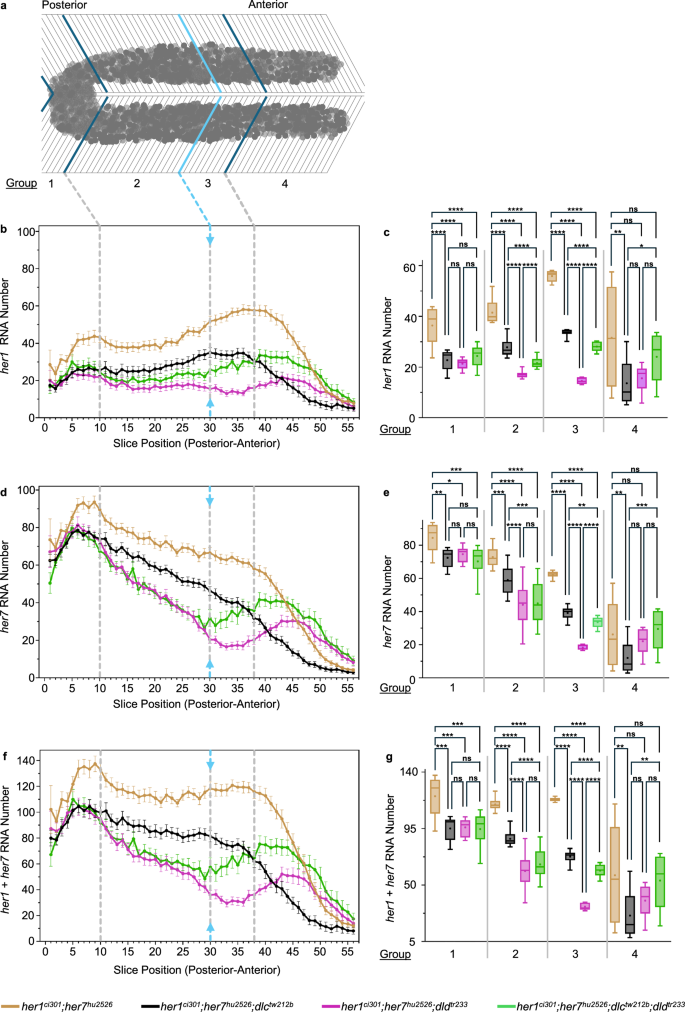
a The PSM tissue is divided into single-cell-wide slices and categorized into four groups. Slices ranging from 1 to 10, 11 to 30, 31 to 38, 39 to 56 are designated as groups 1, 2, 3, and 4, respectively. Group 1 covers the tailbud. Group 2 ends at the determination front (light blue line and arrows). Group 3 and 4 are separated based on changes in transcription patterns. b her1 d her7 and f her1 plus her7 (total her) RNA numbers in her1ci301;her7hu2526 (dark yellow, N = 2, n = 14), her1ci301;her7hu2526;dlctw212b (black, N = 2, n = 16), her1ci301;her7hu2526;dldtr233 (purple, N = 3, n = 13), and her1ci301;her7hu2526;dlctw212b;dldtr233 (green, N = 2, n = 11) embryos are plotted from posterior to anterior direction. Experimental, and embryo numbers are represented as N, and n respectively. The average RNA number in each slice, along with 2 s.e.m., is represented by dots and error bars. Light gray dashed lines show the boundaries between four expression domains in the PSM. c her1 e her7 and g her1 plus her7 (total her) RNA numbers are compared across four genotypes, by averaging all embryos in each group, as indicated in (a). c e, g In Group 1, RNA numbers coming from 10 slices in her1ci301;her7hu2526 (dark yellow, N = 2, n = 14, s = 234), her1ci301;her7hu2526;dlctw212b (black, N = 2, n = 16, s = 288), her1ci301;her7hu2526;dldtr233 (purple, N = 3, n = 13, s = 221), and her1ci301;her7hu2526;dlctw212b;dldtr233 (green, N = 2, n = 11, s = 181). In Group 2, RNA numbers coming from 20 slices in her1ci301;her7hu2526 (dark yellow, N = 2, n = 14, s = 560), her1ci301;her7hu2526;dlctw212b (black, N = 2, n = 16, s = 636), her1ci301;her7hu2526;dldtr233 (purple, N = 3, n = 13, s = 514), and her1ci301;her7hu2526;dlctw212b;dldtr233 (green, N = 2, n = 11, s = 420). In Group 3, RNA numbers coming from 8 slices in her1ci301;her7hu2526 (dark yellow, N = 2, n = 14, s = 224), her1ci301;her7hu2526;dlctw212b (black, N = 2, n = 16, s = 256), her1ci301;her7hu2526;dldtr233 (purple, N = 3, n = 13, s = 206), and her1ci301;her7hu2526;dlctw212b;dldtr233 (green, N = 2, n = 11, s = 172). In Group 4, RNA numbers coming from 18 slices in her1ci301;her7hu2526 (dark yellow, N = 2, n = 14, s = 494), her1ci301;her7hu2526;dlctw212b (black, N = 2, n = 16, s = 519), her1ci301;her7hu2526;dldtr233 (purple, N = 3, n = 13, s = 442), and her1ci301;her7hu2526;dlctw212b;dldtr233 (green, N = 2, n = 11, s = 366). Experimental, embryo, and slice data numbers are represented as N, n, and s, respectively. Significance test is performed in each group separately. The levels of significance are *p < 0.05, **p < 0.01, ***p < 0.001, ****p < 0.0001. Exact p-values of the significance tests are put into Supplementary Table 3. The whisker plots show the median (line), quartiles (box), mean (plus sign), as well as the minimum and maximum (whiskers). Source data are provided as a Source Data file.
In the posterior and mid-PSM, up to the determination front, the DeltaD homodimer is more functional than the DeltaC homodimer (Fig. 2b-g; Group 2). While the segmentation clock is not relevant for periodic boundary specification anterior to the determination front, it is critical for establishing rostrocaudal polarity of somites, which is important for later differentiation of segmented cells22,23. After the determination front, we observed perplexing changes in the her1 and her7 RNA numbers among different mutants. her1 and her7 RNAs started to increase in quadruple mutants as compared to first in her1ci301;her7hu2526;dldtr233 mutant (Fig. 2b–g; Group 3). In the anterior-most PSM, the her1 and her7 RNAs were higher in quadruple mutant than both triple mutants (Fig. 2b–g; Group 4).
While a complete explanation of this outcome awaits future studies, there are at least two non-exclusive scenarios: (1) jagged2b is expressed in the anterior most PSM27; it is possible that expression of other ligands might also be increased in deltaC or deltaD mutant backgrounds. Different ligands (e.g., Delta or Jagged) might be competing in binding to Notch receptors in the anterior PSM. If other ligands activate Notch signaling more than DeltaC and DeltaD, they would be relieved from that competition when both deltaC and deltaD are mutated. (2) Alternatively, potential post-translation changes of the Delta ligands might convert some of the dimers from trans-activator to cis-inhibitor (or dual-functional) in the anterior PSM. Correspondingly, one of the proteins known to regulate Delta function, Lunatic fringe, is expressed in the anterior but not in the posterior and mid-PSM in zebrafish28. Lunatic fringe can modify Notch signaling dynamics in the chick and mouse PSM15,29,30,31. Future studies are needed to identify the contributions of different mechanisms modifying the impact of Notch signaling on the transcription of her1 and her7 in the anterior PSM.
DeltaC and DeltaD are the primary ligands activating transcription
Notch signaling can be activated by several ligands, but only dlc and dld mutants result in segmentation defects in zebrafish32. We tested whether pharmacological inhibition of gamma-secretase (γ-Secretase) activity (i.e., blocking cleavage of NICD) in quadruple mutants can affect her1 and her7 RNA numbers (Fig. 3a). To that end, we treated quadruple mutants with Compound E to block γ-Secretase activity starting from mid-gastrulation stages and quantified her1 and her7 RNAs in mid-somitogenesis stages (Fig. 3b–e). Average RNA numbers did not change significantly when the data from all the single cells were pooled together irrespective of their positions (Fig. 3f–h). When we plotted the data based on cell positional information, we found that average her1 and her7 RNAs did not change in cells located in the tailbud, posterior PSM, and mid-PSM (Fig. 3i–n; Groups 1-3).
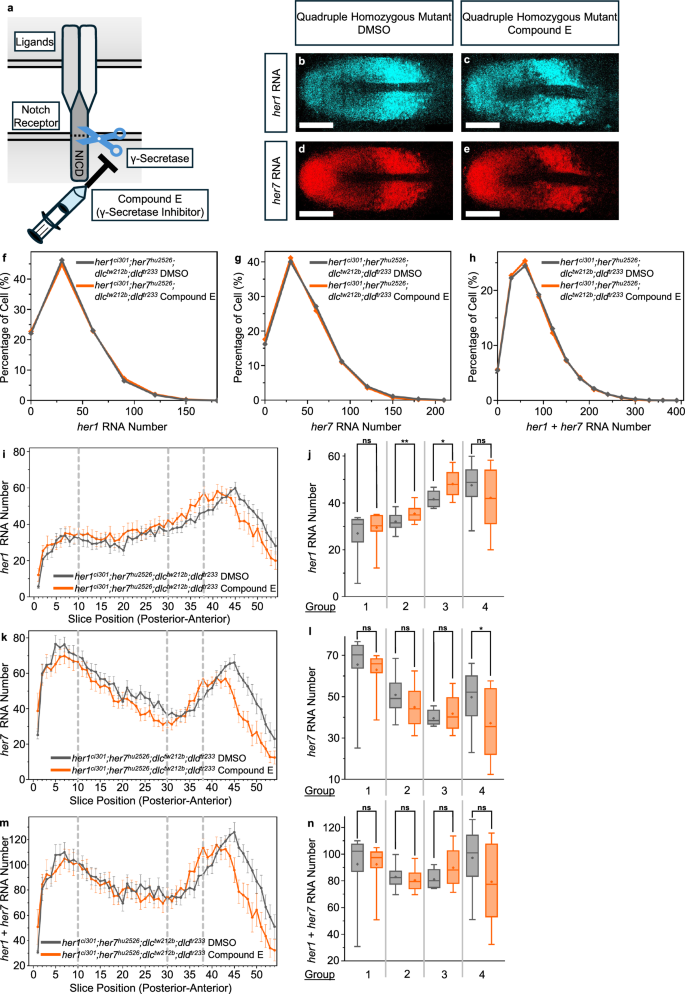
a Cartoon model showing how Compound E is blocking NICD cleavage by inhibiting gamma secretase (γ-Secretase) activity. Syringe symbol represents the application of Compound E drug, while the scissor symbol represents the γ-Secretase activity. b–e Transcription of her1 (cyan) (b, c) and her7 (red) (d, e) RNA in DMSO and Compound E treated her1ci301;her7hu2526;dlctw212b;dldtr233 embryos. Representative images are maximum intensity projections of a z-stack. The scale bar is 100 μm. f–h Histograms showing the percentage of cells with different her1 (f), her7 (g) and her1 plus her7 (total her) (h) RNA numbers in DMSO (gray, N = 2, n = 9, c = 14,000), and Compound E (orange, N = 2, n = 8, c = 9107) treated her1ci301;her7hu2526;dlctw212b;dldtr233 embryos. Experimental, embryo, and cell numbers are represented as N, n, and c, respectively. i her1 k her7 and m her1 plus her7 (total her) RNA numbers are plotted throughout the PSM (posterior to anterior) in her1ci301;her7hu2526;dlctw212b;dldtr233 embryos treated with DMSO (gray, N = 2, n = 9), and Compound E (orange, N = 2, n = 8). The average RNA number in each slice, along with 2 s.e.m., is represented by dots and error bars. j her1 l her,7 and n her1 plus her7 (total her) RNA numbers are compared in DMSO and Compound E treated embryos, by averaging all embryos in each group, as indicated in Fig. 2a. j, l, n In Group 1, RNA numbers coming from 10 slices in her1ci301;her7hu2526;dlctw212b;dldtr233 embryos treated with DMSO (gray, N = 2, n = 9, s = 150), and Compound E (orange, N = 2, n = 8, s = 119). In Group 2, RNA numbers coming from 20 slices in her1ci301;her7hu2526;dlctw212b;dldtr233 embryos treated with DMSO (gray, N = 2, n = 9, s = 355), and Compound E (orange, N = 2, n = 8, s = 308). In Group 3, RNA numbers coming from 8 slices in her1ci301;her7hu2526;dlctw212b;dldtr233 embryos treated with DMSO (gray, N = 2, n = 9, s = 144), and Compound E (orange, N = 2, n = 8, s = 127). In Group 4, RNA numbers coming from 16 slices in her1ci301;her7hu2526;dlctw212b;dldtr233 embryos treated with DMSO (gray, N = 2, n = 9, s = 288), and Compound E (orange, N = 2, n = 8, s = 253). Experimental, embryo, and slice data numbers are represented as N, n, and s, respectively. Significance test is performed in each group separately. The levels of significance are *p < 0.05, **p < 0.01, ***p < 0.001, ****p < 0.0001. Exact p-values of the significance tests are put into Supplementary Table 3. The whisker plots show the median (line), quartiles (box), mean (plus sign), as well as the minimum and maximum (whiskers). Source data are provided as a Source Data file.
In the anterior-most PSM, her1 and her7 RNAs slightly decreased in Compound-E treated mutants as compared to controls, albeit not passing the significance test for all comparisons (Fig. 3i–n; Group 4). Interestingly, her1 and her7 RNAs in this region are higher in quadruple mutants compared to triple mutants (Fig. 2c–g). Overall, both outcomes could be due to several non-exclusive scenarios as discussed in the preceding section above.
Transcription of her1 and her7, although decreased, still occur in the quadruple mutants (even when γ-Secretase activity is blocked). This is because Notch signaling is only one of the transcriptional regulators of her1 and her7. Several other transcription factors are regionally expressed in the tissue2,32. Their contributions on transcription of her1 and her7 at different spatial locations will be investigated in future studies.
Notch signaling promotes transcription of deltaC and deltaD
Oscillatory Her1 and Her7 proteins repress transcription of deltaC and thereby drive its oscillations. In previously proposed regulatory networks and computational models, Notch signaling is assumed not to affect transcription of deltaC in zebrafish12,16,21,33. Because deltaD is not repressed by Her1 and Her7 proteins, its expression does not oscillate in zebrafish. Therefore, Notch signaling is also assumed not to affect transcription of deltaD. It is difficult to test these assumptions by comparing deltaC and deltaD transcript counts between wild-type and single mutants due to several obstacles described in the preceding sections. In addition to those obstacles, there is one additional one: For example, if Notch signaling promotes transcription of deltaC, deltaC level is expected to be decreased in Notch pathway mutants due to loss of activation. But Notch signaling also activates transcription of her1 and her7; their levels will also decrease in Notch pathway mutants, and consequently, reduction in Her1 and Her7 proteins will derepress deltaC. This derepression will counteract loss of activation, resulting in misleading conclusions.
To overcome these obstacles, we again utilized the same genetic backgrounds in which the several feedback loops and differences in dynamical states are eliminated. We performed smFISH experiments to compare deltaC and deltaD RNAs between her1ci301;her7hu2526 and her1ci301;her7hu2526;dlctw212b;dldtr233 mutants (Figs. 4a, b and 5a, b). Contrary to the previous assumptions, we found that both deltaC and deltaD RNAs decreased in quadruple mutants as compared to her1ci301;her7hu2526 mutants (Figs. 4c–e and 5c–e). The spatial profile of deltaC RNA revealed that while its transcription is reduced in quadruple mutants as compared to her1ci301;her7hu2526 mutants in most of the posterior and mid-PSM, an opposite effect is observed in the anterior PSM (Fig. 4d, e). The latter outcome might be due to the same hidden mechanism modifying the impact of Notch signaling on transcription of three oscillatory genes (her1, her7, and deltaC) in the anterior PSM, as discussed above (Fig. 2c–g). Overall, this result unearths a hitherto unnoticed positive feedback loop in the segmentation regulatory network.
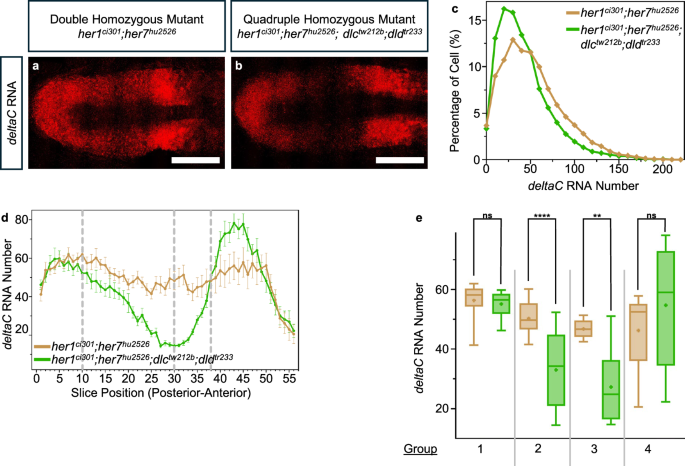
a, b Transcription of deltaC (red) RNA in her1ci301;her7hu2526 and her1ci301;her7hu2526;dlctw212b;dldtr233 embryos. Representative images are maximum intensity projections of a z-stack. The scale bar is 100 μm. c deltaC RNA number per cell in her1ci301;her7hu2526 (dark yellow, N = 1, n = 7, c = 16259), and her1ci301;her7hu2526;dlctw212b;dldtr233 (green, N = 1, n = 5, c = 7386) embryos. The levels of significance are *p < 0.05, **p < 0.01, ***p < 0.001, ****p < 0.0001. Experimental, embryo, and cell numbers are represented as N, n, and c, respectively. d deltaC RNA number is plotted throughout the PSM (posterior to anterior) in her1ci301;her7hu2526 (dark yellow, N = 1, n = 7), and her1ci301;her7hu2526;dlctw212b;dldtr233 (green, N = 1, n = 5) embryos. The average mRNA number in each slice represented as dots, mean data, and 2 s.e.m are used in the graph. e Comparison of the deltaC RNA number across two genotypes, by averaging all embryos in each group, as indicated in Fig. 2a. In Group 1, RNA numbers coming from 10 slices in her1ci301;her7hu2526 (dark yellow, N = 1, n = 7, s = 134), and her1ci301;her7hu2526;dlctw212b;dldtr233 (green, N = 1, n = 5, s = 98). In Group 2, RNA numbers coming from 20 slices in her1ci301;her7hu2526 (dark yellow, N = 1, n = 7, s = 279), and her1ci301;her7hu2526;dlctw212b;dldtr233 (green, N = 1, n = 5, s = 200). In Group 3, RNA numbers coming from 8 slices in her1ci301;her7hu2526 (dark yellow, N = 1, n = 7, s = 112), and her1ci301;her7hu2526;dlctw212b;dldtr233 (green, N = 1, n = 5, s = 80). In Group 4, RNA numbers coming from 18 slices in her1ci301;her7hu2526 (dark yellow, N = 1, n = 7, s = 234), and her1ci301;her7hu2526;dlctw212b;dldtr233 (green, N = 1, n = 5, s = 177). Experimental, embryo, and slice data numbers are represented as N, n, and s, respectively. Significance test is performed in each group separately. The levels of significance are *p < 0.05, **p < 0.01, ***p < 0.001, ****p < 0.0001. Exact p-values of the significance tests are put into Supplementary Table 3. The whisker plots show the median (line), quartiles (box), mean (plus sign), as well as the minimum and maximum (whiskers). Source data are provided as a Source Data file.
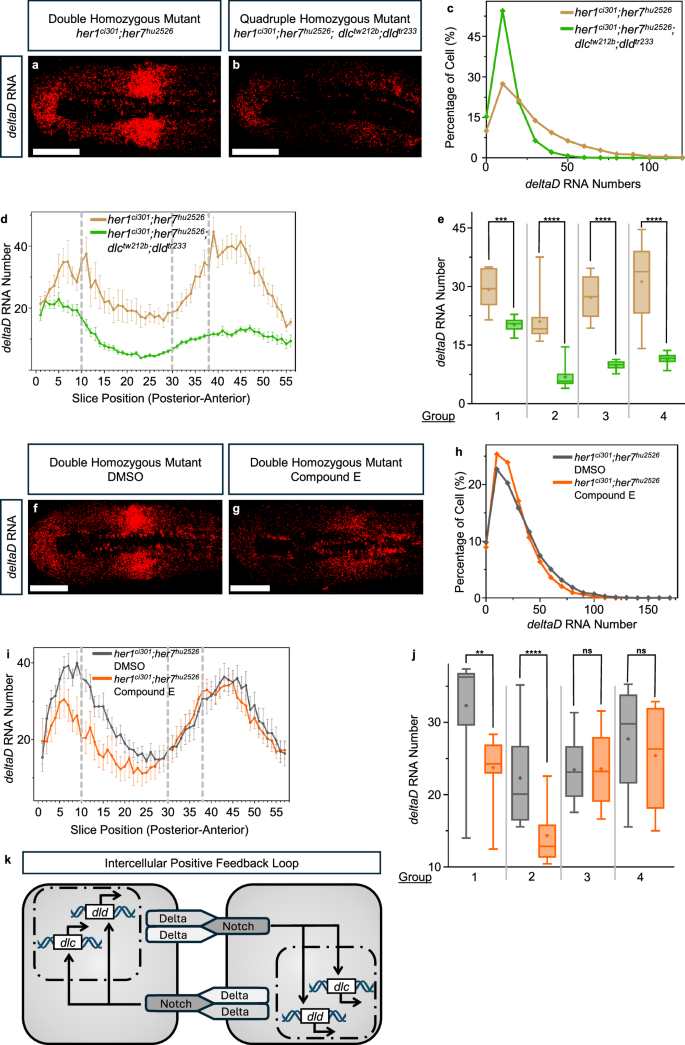
a, b Transcription of deltaD (red) RNA in her1ci301;her7hu2526 and her1ci301;her7hu2526; dlctw212b;dldtr233 embryos. Representative images are single section of a z-stack. The scale bar is 100 μm. c deltaD RNA number per cell in her1ci301;her7hu2526 (dark yellow, N = 1, n = 7, c = 8959), and her1ci301;her7hu2526;dlctw212b;dldtr233 (green, N = 1, n = 10, c = 12313) embryos. Experimental, embryo, and cell numbers are represented as N, n, and c, respectively. d deltaD RNA number is plotted throughout the PSM (posterior to anterior) in her1ci301;her7hu2526 (dark yellow, N = 1, n = 7), and her1ci301;her7hu2526;dlctw212b;dldtr233 (green, N = 1, n = 10) embryos. The average RNA number in each slice represented as dots, mean data, and 2 s.e.m are used in the graph. e Comparison of the deltaD RNA number across two genotypes, by averaging all embryos in each group, as indicated in Fig. 2a. In Group 1, RNA numbers coming from 10 slices in her1ci301;her7hu2526 (dark yellow, N = 1, n = 7, s = 102), and her1ci301;her7hu2526;dlctw212b;dldtr233 (green, N = 1, n = 10, s = 182). In Group 2, RNA numbers coming from 20 slices in her1ci301;her7hu2526 (dark yellow, N = 1, n = 7, s = 254), and her1ci301;her7hu2526;dlctw212b;dldtr233 (green, N = 1, n = 10, s = 387). In Group 3, RNA numbers coming from 8 slices in her1ci301;her7hu2526 (dark yellow, N = 1, n = 7, s = 110), and her1ci301;her7hu2526;dlctw212b;dldtr233 (green, N = 1, n = 10, s = 160). In Group 4, RNA numbers coming from 18 slices in her1ci301;her7hu2526 (dark yellow, N = 1, n = 7, s = 241), and her1ci301;her7hu2526;dlctw212b;dldtr233 (green, N = 1, n = 10, s = 303). Experimental, embryo, and slice data numbers are represented as N, n, and s, respectively. Significance test is performed in each group separately. The levels of significance are *p < 0.05, **p < 0.01, ***p < 0.001, ****p < 0.0001. Exact p-values of the significance tests are put into Supplementary Table 3. The whisker plots show the median (line), quartiles (box), mean (plus sign), as well as the minimum and maximum (whiskers). f, g Transcription of deltaD (red) RNA in DMSO and Compound E treated her1ci301;her7hu2526 embryos. Representative images are single section of a z-stack. The scale bar is 100 μm. h Histogram showing the percentage of cells with different numbers of deltaD RNA in DMSO (gray, N = 1, n = 12, c = 27947), and Compound E (orange, N = 1, n = 10, c = 23007) treated her1ci301;her7hu2526 embryos. Experimental, embryo, and cell numbers are represented as N, n and c, respectively. i deltaD RNA number is plotted throughout the PSM (posterior to anterior) in DMSO (gray, N = 1, n = 12), and Compound E (orange, N = 1, n = 10) treated her1ci301;her7hu2526 embryos. The average RNA number in each slice represented as dots, mean data, and 2 s.e.m are used in the graph. j, Comparison of the deltaD RNA number between two conditions, by averaging all embryos in each group, as indicated in Fig. 2a. In Group 1, RNA numbers coming from 10 slices in her1ci301;her7hu2526 embryos treated with DMSO (gray, N = 1, n = 12, s = 220), and Compound E (orange, N = 1, n = 10, s = 186). In Group 2, RNA numbers coming from 20 slices in her1ci301;her7hu2526 embryos treated with DMSO (gray, N = 1, n = 12, s = 480), and Compound E (orange, N = 1, n = 10, s = 400). In Group 3, RNA numbers coming from 8 slices in her1ci301;her7hu2526 embryos treated with DMSO (gray, N = 1, n = 12, s = 192), and Compound E (orange, N = 1, n = 10, s = 160). In Group 4, RNA numbers coming from 18 slices in her1ci301;her7hu2526 embryos treated with DMSO (gray, N = 1, n = 12, s = 429), and Compound E (orange, N = 1, n = 10, s = 360). Experimental, embryo, and slice data numbers are represented as N, n, and s, respectively. Significance test is performed in each group separately. The levels of significance are *p < 0.05, **p < 0.01, ***p < 0.001, ****p < 0.0001. Exact p-values of the significance tests are put into Supplementary Table 3. The whisker plots show the median (line), quartiles (box), mean (plus sign), as well as the minimum and maximum (whiskers). k Cartoon model showing the currently identified intercellular positive feedback loop for both deltaC and deltaD. Source data are provided as a Source Data file.
We realized a potential caveat in our quantification of deltaD RNA: the dldtr233 mutation, but not the dlctw212b mutation, creates a premature termination codon (PTC) in the dld gene. PTCs can sometimes lead to nonsense mediated decay of their transcripts. Therefore, the reduction in deltaD RNA in quadruple mutant as compared to double mutant could in part be due to nonsense mediated decay.
To reassess the potential role of Notch signaling on deltaD transcription, we decided to inhibit Notch signaling also pharmaceutically. Hence, we treated her1ci301;her7hu2526 double mutants with Compound E or DMSO (control) (Fig. 5f, g). We again found that deltaD RNAs decreased when γ-Secretase activity is inhibited (Fig. 5h). The reduction in deltaD RNAs is lower when Notch signaling is pharmaceutically inhibited as compared to the genetic inhibition (Fig. 5c–e, h–j). This difference could be due to either incomplete inhibition of Notch signaling by Compound E and/or nonsense mediated decay of deltaD RNA with dldtr233 mutation. Nonetheless, these results showed that Notch signaling promotes transcription of both of its two ligands in the zebrafish PSM (Fig. 5k)
We currently do not know whether NICD directly or indirectly activates transcription of deltaC and deltaD. Currently, the regulatory regions driving transcription of deltaC and deltaD in the zebrafish PSM are unknown. Nonetheless, bioinformatics analysis found several putative SuH/RBPJK binding sites within 20 kb region flanking both genes (10 kb upstream of transcription start site and 10 kb downstream of transcription end, including the transcribed regions) (Table S1). Future research will investigate whether NICD directly activates transcription of either ligand gene via some of these regulatory sites.
Computational modeling highlights differential effects of DeltaC and DeltaD dimers
As discussed above, single dlctw212b mutant gives an earlier and stronger phenotype than that of single dldtr233 mutant. Yet, surprisingly, DeltaD dimer increases her1 and her7 RNAs more than DeltaC dimer does. To bring insight into these two contradictory outcomes, we updated our previously developed mathematical model21,33 of the zebrafish segmentation clock network based on current experimental findings: (1) Delta dimers are now explicitly introduced and differentiated from each other in the equations. (2) The identified intercellular positive feedback loops are added to the regulatory network. Computational simulations are performed only in two neighboring cells to reduce the computational burden, and reaction parameters are searched in physiological ranges as before21,33.
We found several parameter sets satisfying these four experimentally-derived constraints: (1) dlctw212b mutants will cause earlier onset of desynchronization (i.e., reflecting the phenotype in simulations) than single dldtr233 mutants (Fig. 6a–d). (2) double dlctw212b;dldtr233 mutant phenotype will be similar to that of single dlctw212b mutant8 (Fig. 6a–d). (3) her1 and her7 RNA numbers will be reduced more in her1ci301;her7hu2526;dldtr233 mutants than in her1ci301;her7hu2526;dlctw212b mutants (Fig. 6e). (4) her1 and her7 RNA numbers will be similar in her1ci301;her7hu2526;dldtr233 and her1ci301;her7hu2526;dlctw212b;dldtr233 mutants (Fig. 6e). Overall, the simulations provided insight into why dlctw212b mutant shows a stronger phenotype than dldtr233 mutant while segmentation clock transcripts are reduced more in dldtr233 mutant than in dlctw212b mutant.
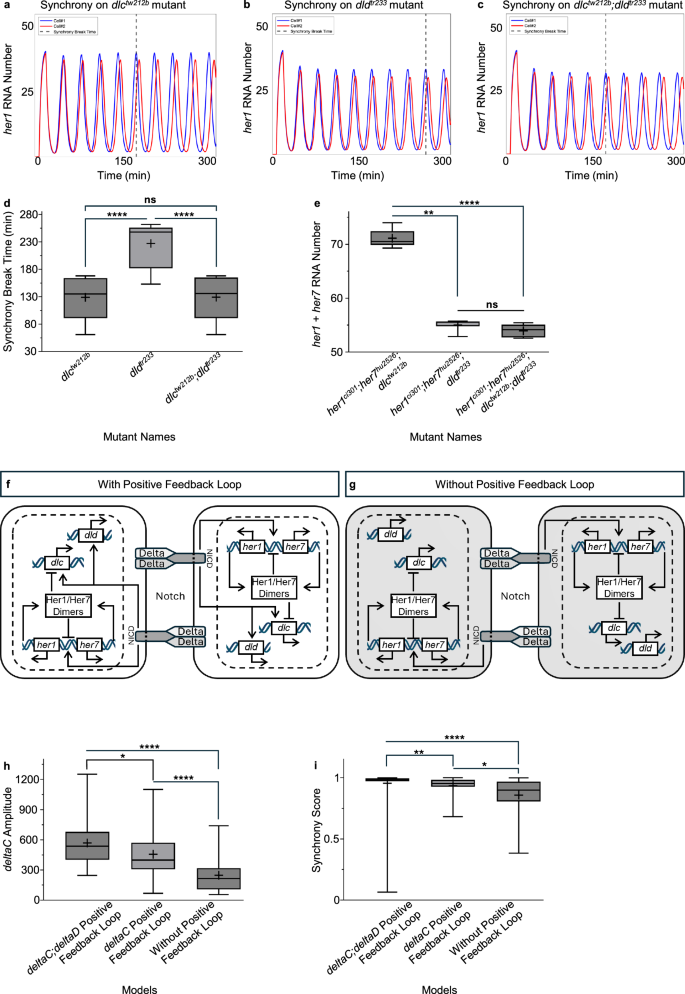
a–c Representative simulations illustrating the synchronization between two cells in the model for single dlctw212b (a) single dldtr233 (b) and double dlctw212b;dldtr233 mutants (c). d, e The whisker plots representing the average for the measures indicated. Average synchronization break time (determined when the synchronization score fall below a threshold of 0.8) in dlctw212b, dldtr233, and dlctw212b;dldtr233 mutants (d). Average her1 plus her7 RNA numbers in her1ci301;her7hu2526;dlctw212b, her1ci301;her7hu2526;dldtr233 and her1ci301;her7hu2526;dlctw212b;dldtr233 mutants (e). f, g Cartoon showing the network with (f) or without (g) the positive feedback loop. h, i The whisker plots showing the amplitude (h), and synchrony score (the Pearson correlation over consecutive peak-to-trough phases) (i) in wild-type embryos. The whisker plots show the median (line), quartiles (box), mean (plus sign), as well as the minimum and maximum (whiskers). Significance test is performed in each plot separately. The levels of significance are *p < 0.05, **p < 0.01, ***p < 0.001, ****p < 0.0001. Exact p-values of the significance tests are put into Supplementary Table 3. Network conditions are positive feedback loop on both deltaC and deltaD, positive feedback loop only on deltaC, and no positive feedback loop. Source data are provided as a Source Data file.
We next assessed the potential benefit of the identified positive feedback loops in the somite segmentation network. A previous computational model argued that while negative feedback loops are necessary and sufficient for generating oscillations, an additional positive feedback loop can make the oscillations more robust34. Thus, we simulated the wild-type segmentation network with or without the positive feedback loops. We found that the positive feedback loops increase the amplitude of deltaC oscillations and consequently increase the synchronization of the segmentation clock oscillations between neighboring cells (Fig. 6f–i).
Discussion
Notch signaling plays a critical role in somite segmentation in vertebrates2. In humans, mutations in the pathway genes result in vertebral segmentation defects4. In zebrafish, mutations in two delta genes eventually result in failure of segmentation, save for the anterior-most somites. The primary function of Notch signaling is to synchronize segmentation clock oscillations among neighboring cells5,10,11,12,13. Delta ligands form both homo- and heterodimers20. However, because expression of only deltaC oscillates, it was thought that only DeltaC-containing dimers contribute to the transcription of segmentation clock genes in zebrafish20. Furthermore, because deltaC is repressed by the segmentation clock proteins24, it was thought that transcription of deltaC is exclusively regulated by them but not by the Notch signaling. Because expression of deltaD is not oscillatory (due to lack of repression), it was also assumed not to be regulated by Notch signaling. Testing these assumptions would have been difficult by comparing wild-type and single delta gene mutants and by performing non-quantitative experiments.
In this study, we utilized the non-oscillatory double her1ci301;her7hu2526 mutant as a genetic background to eliminate compensatory feedback loops and oscillations. We then performed quantitative smFISH experiments to count transcripts of three oscillating genes in single cells in intact PSM tissues. Our results argued against previous assumptions in the field. We found that numbers of her1 and her7 RNAs decreased more in her1ci301;her7hu2526;dldtr233 mutants than in her1ci301;her7hu2526;dlctw212b mutants, suggesting that DeltaD homodimers are functional as well. We also found that transcription of both deltaC and deltaD are promoted by Notch signaling, unearthing a previously missed intercellular feedback loop in the zebrafish segmentation network. An updated computational model successfully recapitulated several experimental observations highlighting the differential impacts of DeltaC and DeltaD ligands on synchronization and transcript numbers of the segmentation clock. Our computational model also showed that the identified positive feedback loops could enhance the synchrony of oscillations between neighboring cells.
Interestingly, Notch1 protein level was shown to oscillate in a Notch signaling dependent manner both in chick and mouse, creating an intracellular feedback loop35. While the wiring of the feedback (inter- or intracellular) and molecules involved (Delta or Notch) differ among species, our results highlight conservation of a second positive feedback loop in the system. Future studies are needed to discern the advantages of the coupled feedback loops conferring to the segmentation clock network in each species.
We anticipate our results will promote the development of more accurate computation models in the field. Likewise, future experimental efforts might similarly reveal additional roles for different ligand pairs in other tissues during embryonic development and adult homeostasis.
Methods
Fish stocks
her1ci302;her7hu2526 (loss-of-function mutation) double mutant19 was used as the non-oscillating background. dlctw212b/tw212b8 and dldtr233/tr2339 were mated with her1ci302;her7hu2526 mutant to generate her1ci302;her7hu2526;dlctw212b, her1ci302;her7hu2526;dldtr233 and her1ci302;her7hu2526;dlctw212b;dldtr233. AB wild-type fish line was used to test the effectiveness of Compound E drug. All the fish experiments were performed under the ethical guidelines of Cincinnati Children’s Hospital Medical Center and Northwestern University Feinberg School of Medicine with the approved animal protocols: Protocol # 2020-0031 and Protocol # IS00028088, respectively. Sex is not determined chromosomally and is fixed several weeks after fertilization in zebrafish. We used embryos less than one day post fertilization. Thus, we could not perform sex-based analysis. Because embryos used in this study are expected to be approximately of equal number of each sex, we do not discriminate against a particular sex in our studies.
Pharmacological treatments
Compound E (γ-secretase inhibitor XXI) (Millipore Sigma, CAS# 209986-17-4) was used to inhibit Notch signaling. A concentration of 50 μM Compound E was sufficient to observe the drug effect, indicated by a broken boundary in wild-type embryos (Supplementary Fig. 1). As a control, DMSO was used in each experiment. Wild-type, her1ci302;her7hu2526, and her1ci302;her7hu2526;dlctw212b;dldtr233 embryos were raised at 28 °C until 50–75% epiboly stage, dechorionated, and treated with either Compound E (at a final concentration of 50 μM) or DMSO. The embryos were raised at 23 °C until they reached 12-14 somite stage and fixed with 4% PFA at room temperature.
smFISH experiments and Imaging
smFISH experiments and confocal imaging were conducted36 with the following changes. Membrane-localized GFP was injected into one-cell-stage mutant embryos. The embryos were collected from at least 4 pairs of fish breedings, raised at 23 °C until they reached 12-14 somite stage, and fixed with 4% PFA at room temperature. Since the mutant embryos do not have intact somite boundaries, 12-14 somite stages are identified according to their tail and yolk shape (Supplementary Fig. 2). The smFISH experiment was performed with Dr-her1-LE2-C3 (Cat# 433201-C3) and Dr-her7-C1 (Cat# 428611) to detect her1 and her7 RNAs in four different mutant embryos. Dr-dlc-C2 (Cat# 559331-C2) was used to detect deltaC RNA number in her1ci302;her7hu2526 and her1ci302;her7hu2526;dlctw212b;dldtr233 mutants. Dr-dld-C2 (Cat# 1133731-C2) was used to detect deltaD RNA in her1ci302;her7hu2526 and her1ci302;her7hu2526;dlctw212b;dldtr233 mutants. Amp4 B was used when labeling her1 and her7 transcripts, and Amp4 A was used when labeling deltaC and deltaD transcripts. For amplifying membrane labels, immunohistochemistry (IHC) was performed after the smFISH experiment. Anti-GFP Chicken polyclonal antibody (either Invitrogen, Cat# A10262 (Lot# 2321831) or Abcam, Cat# ab13970, both at 1:200 dilution) was used as the primary antibody and Alexa Fluor 488 goat anti-chicken IgY H + L (Invitrogen, Cat# A11039 (Lot# 2420700), at 1:200 dilution) was used as the secondary antibody. Hoechst trihydrochloride (H3570, Invitrogen) was used to stain nuclei at the concentration of 7.5 mg/mL. Samples were mounted with ProLong Gold Antifade Reagent (Life Technologies, Cat# P36934), and imaged by using Nikon A1R HD confocal on a TiE microscope with an Apo TIRF 100x Oil DIC N2 objective and resonant scanner. To image whole PSM with 0.12 μm/pixel resolution, z-stack is set to 0.27 μm and multipoints with 512×512 pixels are defined for XY. Tile sizes are 60 × 60 μm. NIS-Elements software was used to stitch all tiles of the PSM with 5% overlap, which was imaged using XY multipoints.
Quantify single cell RNA numbers
The PSM was cleaned on z-slices and then masked by using membrane and nucleus signal with the Imaris surface tool36. Then, segmenting single cells on PSM tissue was done by using the Imaris 10 Cell module. For RNA number counting in each cell, spot detection was used with a diameter of 0.5 μm, background subtraction was enabled, and a “Quality” score was used to pick up true RNA signal. Background RNA numbers of her1 and her7 were calculated from the somite region36 while those of deltaC and deltaD were calculated from notochord (because deltaC and deltaD are also expressed in somites). Distribution of RNA numbers do not show any bimodality (Figs. 1m–o, 3f–h, 4c, 5c, h and Supplementary Fig. 3), suggesting cell-to-cell heterogeneity is not abnormally high.
Single cell segmented PSM tissue data were collected for each sample in Excel. According to these analyses, further graphs were plotted on GraphPad to compare her1 and her7 RNAs in different genotypes.
Identification of potential NICD binding sites in the genomic regions nearby of deltaC and deltaD genes
The NICD protein binds to DNA through the RBPJ protein, which recognizes the consensus sequence TGGGAA. To identify potential NICD binding sites near the deltaC and deltaD genes, we conducted a search for RBPJ binding sites. Motif scanning was performed in the genomic regions surrounding the deltaC and deltaD genes in Danio rerio (zebrafish), extending 10 kb upstream and downstream of their loci on chromosome 13 (GRCz11 assembly). The PWMScan tool (https://epd.expasy.org/pwmtools)37 was used for the analysis, applying the position-specific weight matrix (PWM) for the RBPJ motif (MA1116.2) from the JASPAR 2020 database38. Predicted binding sites were filtered based on PWM scores and P-values to ensure high-confidence results, reflecting binding strength and statistical significance. Each site was annotated with genomic coordinates, sequences, and strand orientation for further analysis.
Computational model
Mass action kinetics describes the interaction between reactants and products in chemical reactions, where the reaction rate is directly proportional to the concentration of the reactants. We have employed mass action kinetics to formulate our model for two cells. We updated our previously published time-delay differential equation models21,33. To account for the differential roles of different Delta protein dimers in transcription, we incorporated the transcriptional efficiency of each dimer39. Our current model consists of 23 equations and 65 parameters. Each equation describes the rate of change of mRNA, monomer protein, or dimer protein levels. The deterministic model was solved numerically using Euler’s Method40. By increasing the time in specified step size, Euler’s Method updates mRNA and protein levels in each iteration based on the rate of changes determined by the model.
We conducted pseudo-stochastic simulations of our model to incorporate the inherent randomness of biochemical reactions, as in our previous study33. This approach allowed each cell to exhibit up to 10% variation in biochemical reaction rates. Randomly selected parameter values from a biologically relevant range were perturbed by up to ±5% for each cell. This approach reflects the stochastic nature of the biochemical process and provides a more realistic simulation of the dynamics of this network. The parameter ranges and a sample parameter set used for the model simulations in Fig. 6a–c are shown in Table S2.
Model details
The equations governing molecule concentrations in simulations are as follows:
The transcriptional processes for deltaC and deltaD mRNAs, denoted as mdC and mdD respectively, are governed by specific synthesis and degradation rates. These rates are represented as (max {K}_{{mdC}}^{{syn}}) and ({K}_{{mdC}}^{{{mathrm{deg}}}}) for deltaC mRNA synthesis and degradation, and ({max K}_{{mdD}}^{{syn}}) and ({K}_{{mdD}}^{{syn}}) for deltaD mRNA synthesis and degradation. The corresponding DeltaC and DeltaD proteins, denoted as pdC and pdD, are synthesized and degraded at rates ({K}_{{pdC}}^{{syn}}), ({K}_{{pdC}}^{{{mathrm{deg}}}}), ({K}_{{pdD}}^{{syn}}), and ({K}_{{pdD}}^{{{mathrm{deg}}}}). DeltaC and DeltaD proteins form dimers and are denoted as follows: pdC,C for DeltaC/DeltaC, pdC,D for DeltaC/DeltaD, and pdD,D for DeltaD/DeltaD, with their respective degradation rates ({K}_{{pdC},C}^{{{mathrm{deg}}}}), ({K}_{{pdC},D}^{{{mathrm{deg}}}}), and ({K}_{{pdD},D}^{{{mathrm{deg}}}}).
For her1, her7, and hes6 mRNAs, represented as mh1, mh7, and mh6, the synthesis and degradation rates are (max {K}_{{mh}1}^{{syn}}), ({K}_{{mh}1}^{{{mathrm{deg}}}}), (max {K}_{{mh}7}^{{syn}}), ({K}_{{mh}7}^{{{mathrm{deg}}}}), and ({K}_{{mh}6}^{{syn}}), ({K}_{{mh}6}^{{{mathrm{deg}}}}) respectively. The corresponding proteins Her1, Her7, and Hes6, denoted as ph1, ph7, and ph6, have synthesis and degradation rates ({K}_{{ph}1}^{{syn}}), ({K}_{{ph}1}^{{{mathrm{deg}}}}), ({K}_{{ph}7}^{{syn}}), ({K}_{{ph}7}^{{{mathrm{deg}}}}), and ({K}_{{ph}6}^{{syn}}), ({K}_{{ph}6}^{{{mathrm{deg}}}}). Her1, Her7 and Hes6 protein dimers are represented as ph1,1 (Her1-Her1), ph7,7 (Her7-Her7), ph6,6 (Hes6-Hes6), ph1,7 (Her1-Her7), ph1,6 (Her1-Hes6), and ph6,7 (Hes6-Her7), with their respective degradation rates
The binding and unbinding of protein dimers are characterized by their association and dissociation rates. The DeltaC/DeltaC, DeltaC/DeltaD, and DeltaD/DeltaD dimers have association and dissociation rates denoted by ({K}_{{pdC},C}^{a}) and ({K}_{{pdC},C}^{d}), ({K}_{{pdC},D}^{a}) and ({K}_{{pdC},D}^{d}), and ({K}_{{pdD},D}^{a}) and ({K}_{{pdD},D}^{d}), respectively. Similarly, for i, j ∈ {1, 6, 7} where i ≤ j, dimer protein phi,j has an association rate ({K}_{{phi},j}^{a}) and dissociation rate ({K}_{{phi},j}^{d}).
In this model, the transcription of deltaC, her1, and her7 mRNA is repressed by Her1-Her1 and Her7-Hes6 dimers within the cell. The transcriptional activation driven by Delta-Notch signaling is provided in the transcription terms for deltaC, deltaD, her1, and her7 mRNAs. The impact of DeltaC and DeltaD proteins on mRNA synthesis in the neighboring cell, facilitated by their interaction with the Notch receptor, is determined by evaluating the levels of DeltaC/DeltaC, DeltaC/DeltaD, and DeltaD/DeltaD dimers from neighboring cells (denoted with a subscript n in the equations to represent their values in adjacent cells). The Her and Delta protein dimer concentration levels have been used to calculate the probability of each promoter state. To calculate the final transcription term for each mRNA, the probability of each promoter state is multiplied by the efficiency of each activation state, denoted as ({E}_{1},{E}_{{CC}},{E}_{{CD}}) and ({E}_{{DD}}) in the equations, as described previously39.
Parameter search
Due to technical difficulties, most reaction rates in zebrafish segmentation clock networks have not been precisely measured experimentally. We, therefore, utilized the Genetic Algorithm (GA) toolbox in MATLAB to perform a parameter search, which involves simulating a population of possible parameter sets and evolving these sets over generations41. At each step, the GA selects parameter sets that better reproduce the experimental observations of zebrafish segmentation clocks, using a fitness function designed to minimize the deviation between the model’s predictions and empirical data. The initial parameter set consisted of randomly generated parameter values within a biologically relevant range, and pseudo-stochastic simulations were then performed using the generated parameters. This evolutionary process continues until it converges on a set of parameters that most closely align with the observed biological phenomena. From the refined parameters, we selected 11 sets that best fit the experimental observations to generate the model result figures (Fig. 6d, e). Similarly, to investigate the role of positive feedback, we simulated our model with and without positive feedback loop to achieve sustained oscillations with a 30 min period. We then recorded the synchrony score for 50 parameter sets for each model (Fig. 6f).
Oscillation features
In analyzing oscillatory behavior in dynamic systems, sustained oscillation characteristics are assessed using the final three-quarters of the simulation data to minimize the influence of initial transient effects. The oscillation amplitude is calculated at the midpoint’s nearest peak-to-trough, and the ratio of peaks to troughs is checked at both the midpoint and the end to ensure that oscillations are sustained throughout the simulations. The period of oscillations is determined by identifying the time points of consecutive peaks within the simulation, excluding the first two peaks to mitigate initial transient effects. Synchronization disruption between two oscillating cells is determined using a synchronization score threshold of 0.8. This score, derived from the correlation over consecutive peak-to-trough phases, pinpoints the time index where the score first falls below the threshold, marking the point of synchronization disruption. These conditions have been checked using the core clock gene her1 mRNA levels.
Coding
The codes for computational simulations have been implemented in MATLAB and tested with MATLAB R2024a. Image analysis is performed by using MATLAB and Python software then tested with MATLAB R2024b and Python (version 3.7)36.
Reporting summary
Further information on research design is available in the Nature Portfolio Reporting Summary linked to this article.
Responses