Demand-side policies can significantly reduce emissions from energy use in buildings and transport

The policy problem

The Paris Agreement sets a goal to keep global warming well below 2 °C. However, model projections show that this goal is unlikely to be met with current climate policies and actions, indicating a need for additional strategies to further reduce greenhouse gas (GHG) emissions. Alongside technological supply-side solutions to transition away from fossil fuels, for example with the adoption of renewable energy sources in electricity generation, demand-side strategies involving energy users in sectors like buildings and transport can contribute significantly to emission reductions. Direct emissions from energy use in buildings and transport account for over 20% of global GHG emissions. In buildings, measures such as electrifying energy use through heat pumps, improving insulation, and reducing energy demand through behavioural shifts can significantly lower emissions. Similarly, in transport, electrifying vehicles, enhancing efficiency, and promoting mode shifts to public transit or active modes like cycling can drastically reduce emissions. Determining the most cost-optimal and effective policy mix is a complex systems problem.

The findings

Our analysis shows that a comprehensive set of measures involving end users can reduce sectoral CO2 emissions by 51–85% in buildings and 37–91% in transport by 2050, compared to a scenario based on current policies (Fig. 1). Electrifying energy end-use and switching to alternative fuels delivers the largest emission reductions, though also leads to increases in electricity demand. Reducing or changing energy-using activities including travel distances and mode choices can reduce energy demand and ease pressure on the electricity supply. So too can using more efficient technologies. The combination of all measures leads to significant further emission reductions, despite some offsetting interactions such as the reduced emission-reduction potentials of heat pumps when homes are better insulated. It is important to note, however, that the successful implementation of these policies depends on multiple conditions, such as broader societal support, which was not explicitly considered in this study.
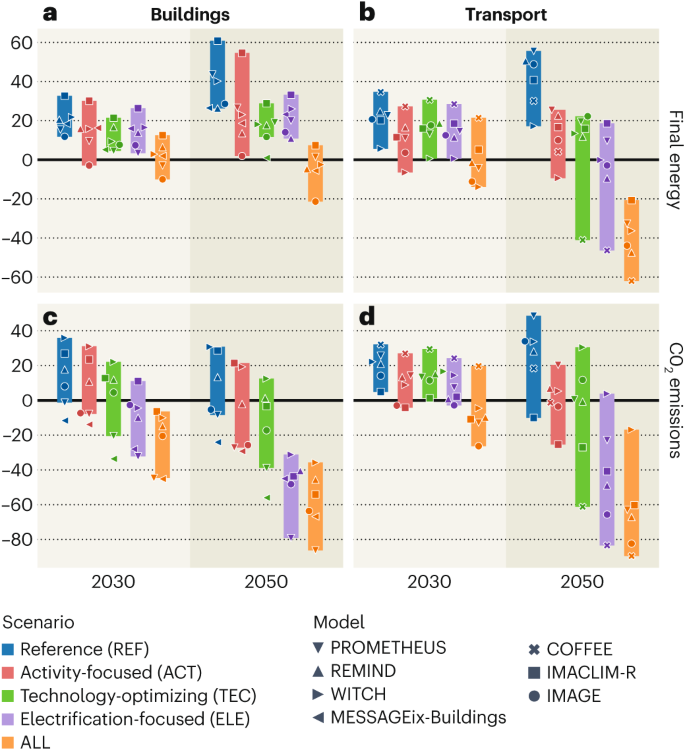
Fig. 1: Change in global final energy use and direct CO2 emissions from fuel combustion in the buildings and transport sectors.
figure 1

ab, Final energy use in buildings (a) and transport (b). cd, CO2 emissions from buildings (c) and transport (d). The figure shows model results for five scenarios: a business-as-usual reference (REF), reducing or changing energy-using activities (ACT), adopting more efficient technologies (TEC), switching to electrification or alternative energy carriers as substitutes to fossil fuels (ELE), and a combined scenario (ALL) integrating ACT, TEC, and ELE. All scenarios have current policies implemented. Markers indicate individual model results and bars depict the model ranges. Figure adapted from R. van Heerden et al. Nat. Energy https://doi.org/10.1038/s41560-025-01703-1 (2025); Springer Nature Ltd.

Full size image

The study

Our study uses quantitative scenarios generated with global integrated assessment models (IAMs) that are specifically designed to capture the interactions within and between the energy system, the economy, and the environment. We developed three scenarios that each capture the impact of a specific strategy targeting energy use. In the first scenario end users reduce or change energy-using activities, in the second they adopt more efficient technologies, and in the third they switch to electrification or alternative energy carriers as substitutes to fossil fuels. Using a structured questionnaire, we also gathered inputs from policymakers and experts in demand sectors to refine the scenarios. We quantitatively interpreted and quantified the scenarios through 2050 using seven IAMs. Finally, we compared the resulting emission reductions per strategy across the set of models and scenarios and analysed the results to better understand the main factors driving these reductions.

Related Articles

Demand-side strategies enable rapid and deep cuts in buildings and transport emissions to 2050

Decarbonization of energy-using sectors is essential for tackling climate change. We use an ensemble of global integrated assessment models to assess CO2 emissions reduction potentials in buildings and transport, accounting for system interactions. We focus on three intervention strategies with distinct emphases: reducing or changing activity, improving technological efficiency and electrifying energy end use. We find that these strategies can reduce emissions by 51–85% in buildings and 37–91% in transport by 2050 relative to a current policies scenario (ranges indicate model variability). Electrification has the largest potential for direct emissions reductions in both sectors. Interactions between the policies and measures that comprise the three strategies have a modest overall effect on mitigation potentials. However, combining different strategies is strongly beneficial from an energy system perspective as lower electricity demand reduces the need for costly supply-side investments and infrastructure.

Power price stability and the insurance value of renewable technologies

To understand if renewables stabilize or destabilize electricity prices, we simulate European power markets as projected by the National Energy and Climate Plans for 2030 but replicating the historical variability in electricity demand, the prices of fossil fuels and weather. We propose a β-sensitivity metric, defined as the projected increase in the average annual price of electricity when the price of natural gas increases by 1 euro. We show that annual power prices spikes would be more moderate because the β-sensitivity would fall from 1.4 euros to 1 euro. Deployment of solar photovoltaic and wind technologies exceeding 30% of the 2030 target would lower it further, below 0.5 euros. Our framework shows that this stabilization of prices would produce social welfare gains, that is, we find an insurance value of renewables. Because market mechanisms do not internalize this value, we argue that it should be explicitly considered in energy policy decisions.

Diversity of biomass usage pathways to achieve emissions targets in the European energy system

Biomass is a versatile renewable energy source with applications across the energy system, but it is a limited resource and its usage needs prioritization. We use a sector-coupled European energy system model to explore near-optimal solutions for achieving emissions targets. We find that provision of biogenic carbon has higher value than bioenergy provision. Energy system costs increase by 20% if biomass is excluded at a net-negative (−110%) emissions target and by 14% at a net-zero target. Dispatchable bioelectricity covering ~1% of total electricity generation strengthens supply reliability. Otherwise, it is not crucial in which sector biomass is used, if combined with carbon capture to enable negative emissions and feedstock for e-fuel production. A shortage of renewable electricity or hydrogen supply primarily increases the value of using biomass for fuel production. Results are sensitive to upstream emissions of biomass, carbon sequestration capacity and costs of direct air capture.

Impact of green bonds on CO2 emissions and disaggregated level renewable electricity in China and the United States of America

Green financial products have emerged that can benefit economic actors in financing green initiatives to promote renewable energy and enable carbon neutrality. Against this backdrop, the study examines the impact of green bonds (GBs) on carbon dioxide (CO2) emissions and renewable electricity generation (EG) in China and the USA, the leading countries in terms of GB issuance and CO2 emissions. To this end, the study conducts a disaggregated-level analysis by applying novel nonlinear quantile methods between January 2, 2019, and July 31, 2023. The results demonstrate that at higher quantiles; (i) GBs mainly have a dampening impact on CO2 emissions from the transportation sector in China and the USA; (ii) GBs have a stimulating impact on solar and wind EG in China; (iii) GBs have a diminishing impact on all types of EGs in the USA. Thus, GBs have an impact on carbon neutrality and renewable energy, which differs by quantiles, sectors, and EG sources. Accordingly, various policy implications are discussed in terms of further contributions of GBs to carbon neutrality and renewable energy in China and the USA.

Bank lending and environmental quality in Gulf Cooperation Council countries

To achieve economies with net-zero carbon emissions, it is essential to develop a robust green financial intermediary channel. This study seeks empirical evidence on how domestic bank lending to sovereign and private sectors in Gulf Cooperation Council (GCC) countries impacts carbon dioxide and greenhouse gas emissions. We employ PMG-ARDL model to panel data comprising six countries in GCC over twenty years for carbon dioxide emissions and nineteen years for greenhouse gas emissions. Our findings reveal a long-term positive impact of both bank lending variables on carbon dioxide and greenhouse gas emissions. In addition, lending to the government shows a negative short-term effect on greenhouse gas emissions. The cross-country results demonstrate the presence of a long-run effect of explanatory variables on both types of emissions, except for greenhouse gas in Saudi Arabia. The sort-term impact of the explanatory variables on carbon dioxide and greenhouse gas emissions is quite diverse. Not only do these effects differ across countries, but some variables have opposing effects on the two types of emissions within a single country. The findings of this study present a new perspective for GCC economies: neglecting total greenhouse gas emissions and concentrating solely on carbon dioxide emissions means missing critical information for devising effective strategies to combat threats of environmental degradation and achieve net-zero goals.

Responses

Your email address will not be published. Required fields are marked *