Depletion of SUN1/2 induces heterochromatin accrual in mesenchymal stem cells during adipogenesis

Introduction
The linker of the cytoskeleton and nucleoskeleton (LINC) complex is composed of Sad1 and UNC-84 (SUN) and Nesprin proteinspagnol1. N-termini of Nesprin proteins associate with cytoskeletal filaments such as actin2,3, microtubules4,5 and other adapter proteins6,7,8 to provide dynamic nucleo-cytoplasmic connections at the outer nuclear membrane. Nesprin C-termini, located inside the perinuclear space, binds to the C-termini of the SUN proteins via their Klarsicht/ANC-1/Syne Homology (KASH) domain9. The SUN protein N-termini pierce the inner nuclear membrane to interface with A-type Lamins10, Emerin11, and nuclear pore complexes12 as well as providing organizational capacity to chromatin by interacting with telomeres during DNA repair13 and meiosis14,15. In this capacity, LINC complexes serve as mechanosensitive adapters between cytoplasm and nucleus to regulate both physical and biochemical signal transduction to the nucleus16.
During development and in mechanically active tissues such as bone and muscle, progenitor cell differentiation is highly dependent upon a cell’s ability to sense extracellular mechanical cues transmit this information into the nucleus, and alter chromatin structure17,18. Therefore, disrupting Nesprin-SUN binding of the LINC complex via expression of a dominant-negative Nesprin-2 KASH domain (dnKASH) and depletion of either SUN or Nesprin proteins have been used interchangeably to study the effects of nucleo-cytoskeletal connectivity on cell function and differentiation19. Indeed, both dnKASH overexpression and Nesprin/SUN depletion approaches have been shown to affect progenitor cell differentiation. dnKASH expression, for example, increases histone deacetylase (HDAC) activity in human MSCs; resulting in decreased expression of the osteogenesis marker Runx2 and increased expression of the adipogenesis marker Pparg20. In transgenic mice, disabling LINC function via dnKASH limits Osx-expressing pre-osteoblast osteogenesis, reducing trabecular bone volume21, and limits exercise-induced Osteoid formation in Prx-Cre mice22. Depletion of both Nesprin-2- Giant20 and SUN1/2 are associated with epidermal thickening23,24, in the case of SUN1/2 co-depletion through decreased differentiation of keratinocyte progenitors.
Disabling LINC complex function may affect cell fate via a number of mechanisms. Our group and others have shown that both dnKASH expression25,26 and SUN1/2 co-depletion27,28 alter the force generation and dynamics of focal adhesions. In mesenchymal stem cells (MSC), both approaches impair the activation of signaling molecules FAK (focal adhesion kinase) and Akt (serine/threonine kinase) in response to mechanical vibrations, thus limiting RhoA-mediated increase in cell contractility29. LINC complex-mediated transmission of contractile forces to the nuclear envelope also affects the nuclear entry of mechanotransducer proteins β-catenin and yes-associated proteins (YAP) with proliferative30,31,32 and anti-adipogenic33,34,35,36 functions in MSC. For example, both dnKASH37 expression and SUN1/2 co-depletion38 decrease nuclear β-Catenin levels. In the case of YAP, dnKASH expression39 and depletion of Nesprin 140 both inhibit nuclear translocation through nuclear pore complexes in response to mechanical stimulus, potentially by limiting cytoskeleton-induced nuclear deformations, or by impairing association with YAP’s nuclear transporter, Importin 741. LINC complex-mediated cytoskeletal connections also affect deformations of the inner nuclear membrane: for example, dnKASH expression reduces stretching of LaminA/C measured via FRET-based LaminA/C force sensor42, and decreases the chromatin deformations during cardiomyocyte contractions43. Similarly, stress-induced chromatin stretching, caused by magnetic bead motions bound to the cell membrane, is abolished upon depletion of SUN1/2 proteins44. Therefore, both depletion of SUN proteins and disrupting LINC complex connectivity directly affect cell mechanosignaling and chromatin organization.
Another important regulator of cell fate are the nuclear mechanics determined by A-type Lamins and chromatin45. Lamin A and Lamin C (referred to as LaminA/C) are the most well-characterized structural proteins in the inner nuclear envelope, and they have been shown to impact the differentiation of MSCs46,47. LaminA/C modulates cell differentiation by regulating chromatin organization48,49 which we have shown to be independent of mechanosignaling in MSCs50. Emerging data suggests that depleting SUN1/2 proteins softens nuclei51 and results in nuclear stiffness levels comparable to cells depleted of LaminA/C52. dnKASH expression, on the other hand, has minimal effects on nuclear stiffness53. We have utilized atomic force microscopy of live isolated cell nuclei to show that dnKASH-mediated disconnection of the nucleus and cytoskeleton slightly increases the stiffness of isolated nuclei, which remained reasonably smaller when compared to depletion of SUN1 and SUN2 proteins50,52.
SUN1/2 proteins provide organizational capacity to chromatin through associations with LEM domain proteins (lamina-associated polypeptide 2, Emerin, and MAN1 domain), direct links to chromatin46,47,54 and, ultimately, provide another regulatory level to the genome55,56. During meiosis, germline SUN1−/− mouse cells display disrupted telomere association to nuclear envelope57. Chromatin capture studies further show that depletion of SUN proteins disrupts the alignment of different chromosome ends via altering telomere binding to the nuclear envelope58. This suggests that disrupting LINC at the level of the outer (dnKASH) and inner (SUN1/2) membrane may result in nuanced dispositions of cell fate beyond LINC complex-mediated cytoskeletal tethering. To test this hypothesis, we compared siRNA-mediated depletion of SUN1/2 to the overexpression of the dnKASH domain to block SUN-Nesprin association29,59 in a model of MSC adipogenesis.
Results
siSUN and dnKASH expression alter nuclear morphology
As the nuclear shape is affected by both LINC complex-dependent nuclear-cytoskeletal coupling and nuclear mechanics60,61, we quantified the effects of SUN1/2 depletion and dnKASH overexpression on nuclear morphology under growth medium (GM) conditions. We first compared MSCs treated with negative control (siCntl) and SUN1/2 siRNAs (siSUN), stained against SUN1 (green), SUN2 (red), and DNA (Hoechst 33342, blue). As shown in Fig. 1a–f, siSUN treatment reduced SUN1 and SUN2 intensity levels by 47 and 52%, increased nuclear area by 7% and perimeter by 8% while decreasing the nuclear circularity by 9%.

a Representative images of MSCs treated with siRNA targeting SUN1/2 (siSUN) which were stained for SUN1 (green), SUN2 (red), and DNA (blue). b siSUN-treated cells had 47% decrease of SUN1 intensity (n = 1478, P < 0.0001). c SUN2 intensity levels were decreased by 52% in siSUN-treated cells (n = 1478, P < 0.0001). d MSCs treated with siSUN had an increase in nuclear area by 7% (n = 1478, p 0 < 0.01). e Nucleus perimeter decreased in siSUN-treated MSCs by 8% (n = 1478, p < 0.0001). f Nuclear circularity decreased by 9% in siSUN-treated cells (n = 1478, p < 0.001). Comparisons were made against control using non-parametric Mann–Whitney test where *P < 0.05, **P < 0.01, ***P < 0.001, ****P < 0.0001. The scale bar represents 50 μm. Results were presented as mean ± STD.
To disable the LINC complex function, we stably infected MSCs via lentivirus harboring a doxycycline (Dox) inducible mCherry-tagged KASH domain (dnKASH-MSCs). About 1 μg/ml Dox was added to the cell culture medium to induce mCherry-KASH and remove Nesprins from the nuclear envelope (referred to as +Dox, Fig. S1). No Dox treatment was used as a control. Shown in Fig. 2, +Dox treatment in GM (GM + Dox) increased mCherry intensity by 133% as well as decreasing nuclear area and circularity by 14% and 6%. A nuclear perimeter was unaltered.
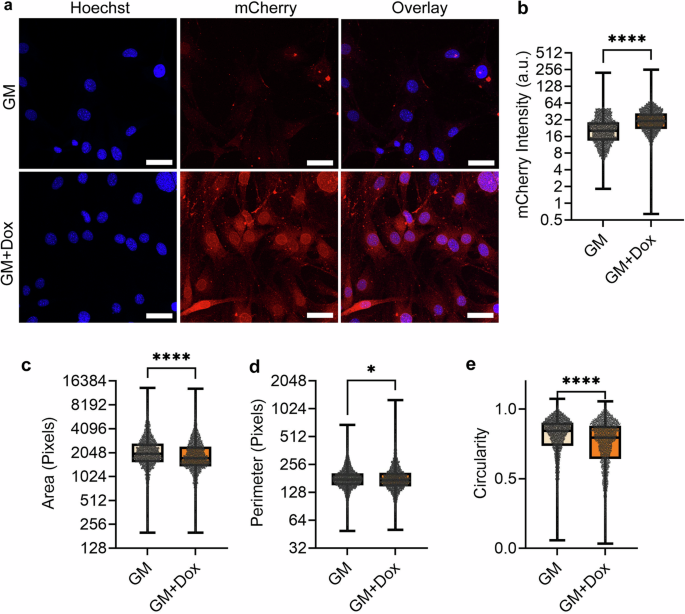
a Representative photos of doxycycline induced DNKASH cells. Images show DNKASH tagged with mCherry (Red) and DNA (Blue). b mCherry intensity levels increased by 133% in doxycycline-treated MSCs (n = 5332, P < 0.0001). c Doxycycline-treated MSCs experienced a 14% decrease in the nuclear area (n = 5322, p 0.001). d Nuclear perimeter had a slight decrease of 1% in the doxycycline treatment group (n = 5322, P < 0.05). e Nuclear circularity decreased by 6% in the doxycycline treatment group (n = 5322, P < 0.0001). Comparisons were made against control using non-parametric Mann–Whitney test where *P < 0.05, **P < 0.01, ***P < 0.001, ****P < 0.0001. The scale bar represents 50 μm. The scale bar represents 50 μm. Results were presented as mean ± STD.
Depletion of SUN1/2 inhibits adipogenesis
To compare the adipogenesis of siCntl and siSUN treatments, MSCs were cultured under adipogenic differentiation media (AM) for 5 days and compared to undifferentiated GM controls. Shown in Fig. 3a–f, the addition of AM onto siCntl MSCs increased adipogenic proteins Adipoq (600%), Cebpa (400%), Pparg (200%), and mean lipid staining per cell by 2000%. In contrast, siSUN-treated MSCs showed no increase in adipogenic proteins with the exception of Cebpa (185%), and mean lipid staining showed a small 20% increase. This indicated impaired adipogenic differentiation in siSUN-treated cells. In rescue experiments that expressed siRNA-resistant human Sun1 and Sun2 proteins, we found that co-transfection with siRNA and plasmids significantly decreased the MSC ability to differentiate (Fig. S2). To avoid this problem, we used 3T3-L1 cells62(Fig. S3) Our results show a 45% decrease of adipogenesis in 3T3-L1 cells under SUN1/2 co-depletion (n = 3, P < 0.01). Expressing hSUN1 and hSUN2 were able to rescue the adipogenic response, significantly increasing adipogenesis compared to the siSUN condition (n = 3, p < 0.05). Expressing hSUN1 and hSUN2 also increased the adipogenesis to levels that were not significantly different from the SiCntl group.
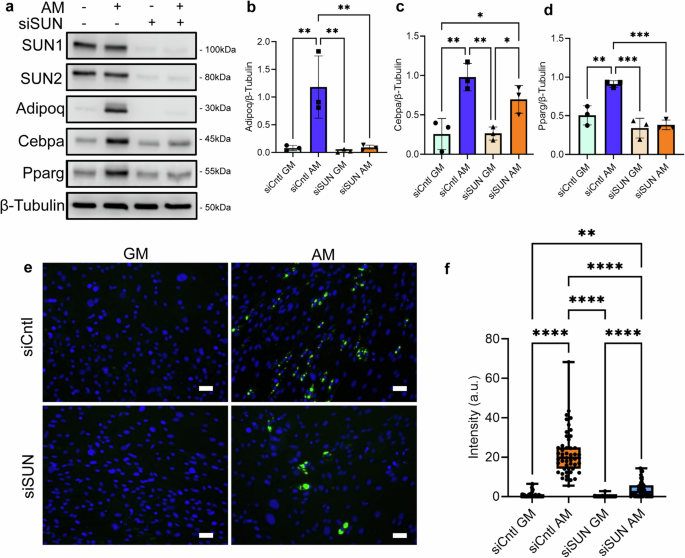
a Western analysis of adipogenesis markers Adipoq, Cebpa, and Pparg in growth media and adipogenic media during siSUN and siCntl treatment. b Analysis of Adipoq protein levels. Comparison of adipogenic siSUN and siCntl groups showed a 92% reduction of Adipoq (n = 3, P < 0.01). c Cebpa experienced a non-significant reduction of 38% in protein levels in siSUN cells compared to siCntl cells during adipogenesis (n = 3, p = 0.22). d Pparg levels decreased by 58% in adipogenic siSUN compared to siCntl (n = 3, P < 0.001). e Representative images of lipid droplet fluorescence images where MSCs are stained for lipid droplets (green) and DNA (blue). f Quantification of the mean florescent lipid droplet intensity per cell from individual imaging fields shows a significant reduction of 83% in lipid droplet amounts in adipogenic siSUN treatment compared to siCntl (n = 50, P < 0.0001). Western analysis group comparisons were made using one-way ANOVA. Lipid droplet intensity group comparisons were made using the Kruskal–Wallis test. *P < 0.05, **P < 0.01, ***P < 0.001, ****P < 0.0001. The scale bar represents 50 μm. The scale bar represents 50 μm. Results were presented as mean ± STD.
We next performed RNA-seq analysis on siSUN and siCntl samples cultured under GM and AM conditions. We used DESEQ2 software analyses to filter genes with significant expression differential between treatment pairs (fold change ≥2-fold, P < 0.05). Hierarchical mapping of these differentials (Fig. 4a) showed clustering of siSUN and siCntl treatments with further sub-clustering of AM and GM conditions within each treatment. As shown in Fig. 4b, the variance of the two principle components were 16.2 and 19.9%. Comparing the gene profiles between AM-treated siCntl and siSUN groups, a database for annotation, visualization, and integrated discovery (DAVID) and a search tool for the retrieval of interacting genes/proteins (STRING) software analyses identified thirteen differentially expressed pathways with an false discovery rate (FDR) of FDR <0.05 that were either significantly upregulated (Figs. 4c and S4) and downregulated (Figs. 4d and S5). SUN1/2 depletion significantly decreased the expression of adipogenic genes Adipoq, Fabp4, Lipe, Plin1, Cidec, Agpath2, Acsl1, and mgll (Fig. 4e) and downregulated three adipogenesis or lipid metabolism-related pathways (Fig. 4d, blue bars). Inflammatory response was also robustly upregulated in the siSUN group, potentially highlighting a regulatory role of SUN1/2 for inflammation pathways (Fig. 4e). Tables of DAVID pathway analysis are shown in Tables S1, S2.
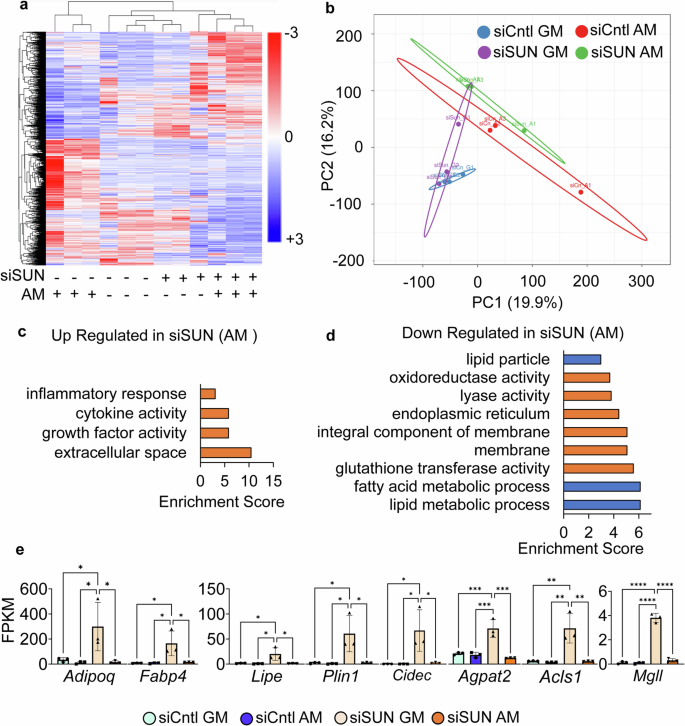
a Heatmap of genes with significant differential (FC >1 and P < 0.05) gene expression during SUN1/2 depletion (n = 24) siSUN-treated samples (+). siCntl-treated samples (−). b Principle component plot where principal component 1 and principal component 2 explain 19.9 and 16.2% of the total variance, respectively. Prediction ellipses indicate that with a probability of 0.95, a new observation from the same group will fall inside the ellipse. n = 24 data points. c DAVID analysis of genes upregulated in siSUN treatment compared to siCntl. Pathways selected have FDR <0.05. d DAVID analysis of genes downregulated in the siSUN group compared to siCntl. Pathways selected have FDR <0.05. Blue indicates pathways related to adipogenesis and lipid metabolism. e FPKM values for adipogenic and lipid metabolism-related genes detected in both differential gene expression (FC >1, P < 0.05) and in DAVID analysis (FDR <0.05) (n = 3/grp). Group comparison was made using one-way ANOVA where *P < 0.05. Results were presented as mean ± STD.
dnKASH expression accelerates adipogenesis
To quantify the effects of dnKASH expression on adipogenesis, dnKASH-MSCs with ±Dox treatment were compared under AM conditions. Undifferentiated GM groups were also utilized as controls. Shown in Fig. 5a–f, the provision of AM to no Dox-treated MSCs increased adipogenic proteins Adipoq (500%), Cebpa (48%), Pparg (53%), and mean lipid staining per cell by 2400%. When Dox was added (+Dox), AM addition resulted in a larger increase in adipogenic proteins Adipoq (1000%), Cebpa (300%), Pparg (250%), and mean lipid staining per cell by 6000%. Doxycycline alone did not alter the rate of adipogenic differentiation in wild-type MSCs (Fig. S6) nor SUN1 and SUN2 levels were changed in dhKASH cells (Fig. S7). Our results indicate that expression of dnKASH fragments via +Dox treatment resulted in significant increases of Adipoq, Pparg and more than doubled the lipid droplets when compared to no Dox treatment. We have also confirmed that the mutated KASH protein (KASH-deltaPPPL) which has no ability to bind to the SUN domain, did not increase in adipogenesis (Fig. S8). Finally, the possible adipogenic effect of expressing the SUN1 luminal sequence (SUN1L), which alternatively disables LINC-complex function via binding to Nesprin, was also tested. Expression of SUN1L increased adipogenesis and accelerated adipogenesis when compared to MSCs expressing Kdel motif expression which acted as a control (Fig. S9).
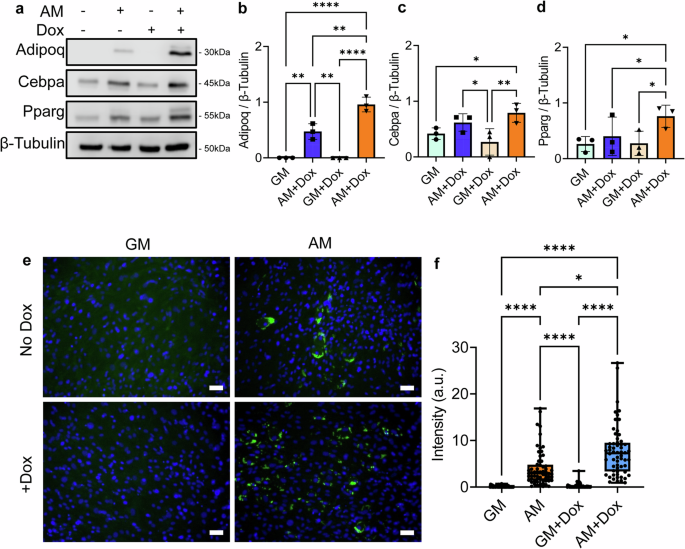
a Representative western images of doxycycline-induced dnKASH cells and control cells grown in growth media and adipogenic media. b During adipogenesis, doxycycline-treated samples had 98% increased levels of Adipoq (n = 3, P < 0.01). c Cepba experienced an increase of 27% but was not significant during adipogenesis in doxycycline treatment (n = 3, p = 0.38). d Pparg in the doxycycline treatment group during adipogenesis increased by 90% (n = 3, P < 0.05). e Representative photos of lipid droplets (green) and DNA (blue). f Quantification of mean lipid droplet intensity per cell in each field of view showed an increase of lipid droplet amounts in doxycycline-treated cells by 258% (n = 50, P < 0.05) during adipogenesis. Western analysis group comparisons were one-Way Anova. Lipid droplet Intensity group comparisons were made using the Kruskal–Wallis test. *P < 0.05, **P < 0.01, ***P < 0.001, ****P < 0.0001. The scale bar represents 50 μm. The scale bar represents 50 μm. Results were presented as mean ± STD.
To understand the accelerated adipogenesis during dnKASH expression, we performed RNA-seq analysis. DESEQ2 analyses filtered gene pairs with significant expression differentials (fold change ≥2-fold, P < 0.05). Shown in Fig. 6a, the hierarchical heatmap showed a clustering of +Dox treatments (i.e., dnKASH expression) regardless of the media type used. AM cultured cells were further sub-clustered inside their respective ±Dox clades. As shown in Fig. 6b, the variance of the two principle components were 25.2 and 16.9%. Comparing the gene profiles between AM treated ±Dox groups, DAVID and STRING analyses identified 16 differentially expressed pathways with an FDR <0.05 that were either significantly upregulated (Figs. 6c and S10) or downregulated (Figs. 6d and S11). +Dox treatment significantly increased the expression of adipogenic genes Adipoq, Fabp4, Lipe, Plin1, Cidec, Agpath2, Acsl1, and mgll (Fig. 6e) and upregulated lipid metabolism, fatty acid metabolism, and PPAR signaling pathways (Fig. 6c, blue bars). In order to control for the doxycycline effect, expression of the Dox-independent dnKASH domain via a secondary plasmid39 confirmed increased adipogenic gene expression when compared to an empty vector (Fig. S12c). Thus, in an effect opposite to that seen after siSUN treatment, the AM +Dox treatment group showed downregulation of inflammatory and immune pathways (Figs. 6d and S11). Tables of DAVID pathway analysis can be found in Tables S3,S4.
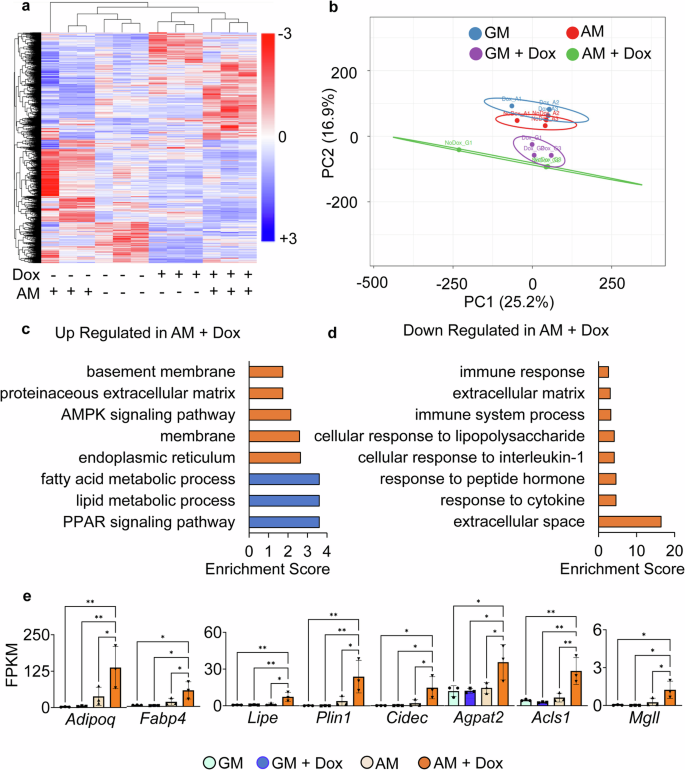
a Heatmap of genes with significant differential (FC >1 and P < 0.05) gene expression during doxycycline-induced dnKASH expression (n = 24). b Principle component plot where principal component 1 and principal component 2 explain 25.2 and 16.9% of the total variance, respectively. Prediction ellipses indicate that with a probability of 0.95, a new observation from the same group will fall inside the ellipse. n = 24 data points. c DAVID analysis of genes upregulated in doxycycline treatment compared to control. Blue indicates pathways related to adipogenesis and lipid metabolism. Pathways selected have FDR <0.05. d DAVID analysis of genes downregulated in the doxycycline group compared to control. Pathways selected have FDR <0.05. e FPKM values for adipogenic and lipid metabolism-related genes detected in both differential gene expression (FC >1, P < 0.05) and in DAVID analysis (FDR <0.05) (n = 3/grp). Group comparison was made using one-way ANOVA. *P < 0.05, **P < 0.01. Results were presented as mean ± STD.
H3K9me3 levels and enrichment at the adipogenic gene Adipoq increase during SUN1/2 depletion
To understand possible changes in chromatin during SUN1/2 depletion, we next measured heterochromatin markers H3K9me3, H3K27me3, and the euchromatin marker H3K4me3 in siSUN and siCtrl treated MSCs under both GM and AM conditions (Fig. 7a–d). Comparing siCntl and siSUN groups, siSUN treatment increased H3K9me3 levels by 56% and 86% in the AM and GM groups. H3K27me3 was decreased by 48% by AM with no changes under GM in siSUN groups when compared to siCtrl. After statistical analysis, no changes were detected in the euchromatin marker H3K4me3 (P > 0.05).
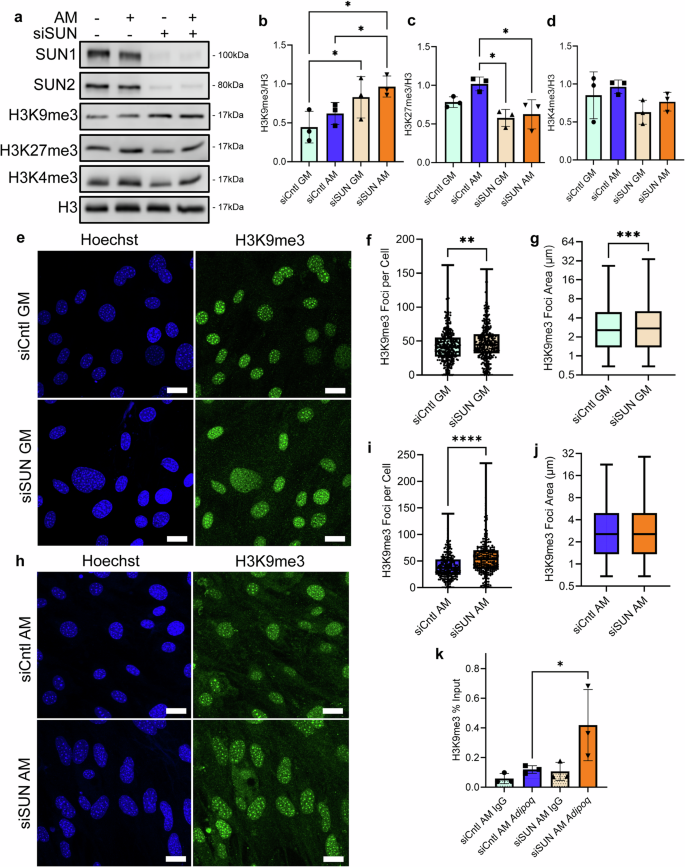
a Representative western images of heterochromatin markers H3K9me3 and H3K27me3 and euchromatin marker H3K4me3 in siSUN and siCntl treatments during growth in growth media and adipogenic media. b Western analysis of heterochromatin marker H3K9me3 revealed an increase of 56% in siSUN cells compared to siCntl during adipogenesis (n = 3, P < 0.05). c H3K27me3 had a decrease of 48% in siSUN cells compared to siCntl cells during adipogenesis (n = 3, P < 0.05). d Euchromatin marker H3K4me3 experienced no significant changes in global protein levels between siSUN and siCntl-treated cells during adipogenesis. e Representative images of siSUN and siCntl-treated cells grown in adipogenic media and stained for H3K9me3 (green) and Hoechst 33342 (blue). f H3K9me3 foci count per cell in siSUN cells compared to siCntl cells in growth media increased by 9% (n = 338, P < 0.01). g H3K9me3 foci area increased by 7% in siSUN cells compared to siCntl in growth media (n = 14,560, P < 0.001). h Representative images of siSun and siCntl treated cells grown in adipogenic media and stained for H3K9me3 (green) and Hoechst (blue). i H3K9me3 foci count per cell in siSUN cell compared to Sicntl Cells during adipogenesis increased by 43% (n = 213, P < 0.0001). j No detectable increase of H3K9me3 foci area was found in siSUN cells during adipogenesis (n = 8460). k CUR&RUN-qPCR targeting H3K9me3 localization on Adipoq showed an increase of 156% in siSUN cells compared to siCntl (n = 3, P < 0.05). Western analysis group comparisons were made using one-way ANOVA. H3K9me3 Foci count, and area comparisons were made using the Mann–Whitney test. CUR&RUN-qPCR comparisons were done using a one-tailed students t-test. *P < 0.05, **P < 0.01, ***P < 0.001, ****P < 0.0001. The scale bar represents 25 μm. The scale bar represents 50 μm. Results were presented as mean ± STD.
To further investigate the increased H3K9me3 levels in the siSUN group, we quantified confocal images of H3K9me3 (green) and DNA (blue) under GM and AM conditions (Fig. 7e–j). Shown in Fig. 7f, g, siSUN treatment increased H3K9me3 foci count by 9%, and area by 7%. In AM treated groups, siSUN treatment increased H3K9me3 foci count per cell by 43% (Fig. 7i), when normalized to nuclear area, foci count was up 11% (Fig. S13). Foci area was unchanged (Fig. 7j). To detect if increased H3K9me3 led to increased enrichment on adipogenic genes, we probed the most enriched gene under AM, Adipoq, via a CUT&RUN extraction targeting H3K9me3. As shown in Fig. 7k, H3K9me3 enrichment on Adipoq was increased by 156% in the siSUN AM group compared to the siCntl AM group.
H3K9me3 levels and enrichment at the adipogenic gene Adipoq remain unaltered during dnKASH disruption of the LINC Complex
Investigating the increased adipogenesis of dnKASH-MSCs, heterochromatin markers H3K9me3, H3K27me3, and euchromatin marker H3K4me3 were measured under both GM and AM conditions (Fig. 8a–d). Under GM conditions, no changes were detected. In contrast to SUN1/2 depletion, +Dox treatment decreased H3K9me3 by 51% under AM. AM+Dox treatment also decreased H3K27me3 by 56%. No H3K4me3 differences were detected.
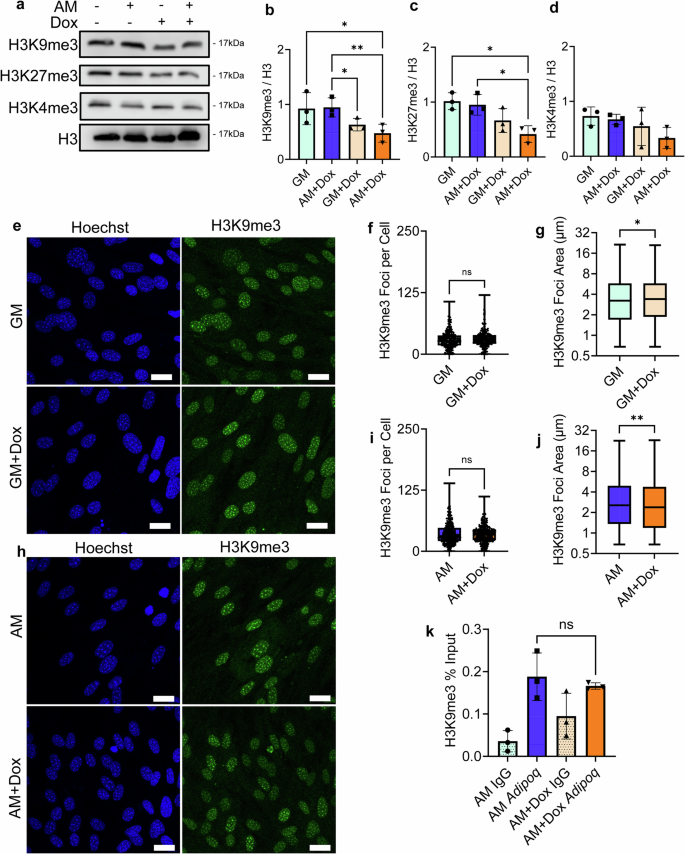
a Representative images of doxycycline-induced dnKASH expression of heterochromatin markers H3K9me3 and H3K27me3 and euchromatin marker. b H3K9me3 levels decreased during adipogenesis in the doxycycline treatment group compared to controls by 51% (n = 3, P < 0.01). c H3K27me3 levels decreased by 56% in the doxycycline treatment group compared to control during adipogenesis (n = 3, P < 0.05). d H3K4me3 levels had no significant changes in doxycycline. e Representative images of doxycycline-treated cells and control cells stained for H3K9me3 (green) and Hoescht (blue) during growth in adipogenic media. f Analysis of H3K9me3 foci count per cell in the doxycycline treatment group in growth media showed no significant changes in foci count per cell (n = 246). g H3K9me3 foci area increased by 5% in doxycycline treatment group in growth media (n = 7350, P < 0.05). h Representative images of doxycycline-treated cells and controls cells stained for H3K9me3 (green) and Hoescht (blue) during growth in adipogenic media. i H3K9me3 foci count per cell did not show significant changes between the doxycycline treatment group and the control group during growth in adipogenic media (n = 328). j The doxycycline treatment group had decreased H3k9me3 foci area during adipogenesis by 7% compared to the control (n = 11317, P < 0.01). k CUR&RUN-qPCR targeting H3K9me3 localization on Adipoq showed no significant increase in doxycycline-treated cells compared to controls (n = 3). Western analysis group comparisons were made using one-way ANOVA. H3K9me3 Foci count and area comparisons were made using the Mann–Whitney test. CUR&RUN-qPCR comparisons were done using a one-tailed student’s t-test. *P < 0.05, **P < 0.01, ***P < 0.001, ****P < 0.0001. The scale bar represents 25 μm. The scale bar represents 50 μm. Results were presented as mean ± STD.
Confocal imaging of H3K9me3 (green) and DNA (Blue) in AM (Fig. 8e–j). In GM treated groups, H3K9me3 foci count per cell in had no significant changes in foci count per cell under doxycycline (Fig. 8f) while H3K9me3 foci area increased by 5% in doxycycline treatment group (Fig. 8g). In AM treated groups, no H3K9me3 foci count changes were detected (Fig. 8k), including when foci count normalized to a nuclear area (Fig. S13). Foci area was decreased by 7% (Fig. 7j). Further, no changes in Tri-methylation of H3K9 enrichment associated with Adipoq were observed when dnKASH was expressed during MSC growth in adipogenic media. (Fig. 8k).
Discussion
Both SUN and Nesprin—connected to SUN via its KASH domain—are part of the LINC complex function. Depletion of SUN proteins and expression of dominant-negative KASH isoforms (i.e., dnKASH) both interfere with the transmittance of mechanical information to the cell nucleus. In addition to their function in nucleo-cytoskeletal connectivity, SUN proteins have been shown to have connections to chromatin63,64,65,66 and may participate in gene availability. Here we report that depletion of SUN1/2 results in increased H3K9me3 accrual at both global and gene scales. dnKASH treatment has no such effect, suggesting that these two methods cannot be used interchangeably in studying LINC complex function.
The observed increase in the nuclear area, perimeter and decreased circularity seen during SUN1/2 depletion are similar to nuclear morphology changes during Lamin A/C depletion50,67. Previous research has shown that both depletion of Lamin A/C and disassociation of SUN1 from the nuclear envelope via SUN1L-KDEL expression softens nuclei53, suggesting that SUN proteins—Like the LaminA/C—supports nuclear structure and possibly tether chromatin. We have found that disabling LINC complex function via dnKASH decreases nuclear area, consistent with loss of actomyosin-dependent tension across Nesprin-2G68 and increased nuclear height69,70, but results in smaller changes in perimeter and circularity consistent with a structurally intact nuclei. Prior work utilizing micropipette-induced nuclear deformations supports the idea that dnKASH expression does not significantly reduce nuclear stiffness53. Indeed, we have previously shown that depletion of SUN1/2 causes a reduction in isolated nuclear stiffness while dnKASH expression does not52. Thus, our data indicates that dnKASH regulates nuclear morphology and adipogenesis without reducing nuclear stiffness, while depletion of SUN1/2 is may regulate adipogenesis and nuclear shape by softening nuclei.
Previous studies have shown that depletion of SUN1/2 reduces tethering of chromosomes to the nuclear envelope57,65,71,72, alters nucleolus morphology73, and increases H3K9me3 levels in hTERT-RPE1 and MCF10A cells74. Our results show similar trends where SUN1/2 depletion increased both H3K9me3 protein levels and the number of H3K9me3 heterochromatic foci. In contrast, no H3K9me3 changes were observed when dnKASH expression limited the LINC complex-mediated connection between the nucleus and cytoskeleton.
Our data indicates that MSCs from bone marrow are primed for adipogenic transformation under adipogenic media conditions. Disrupting nucleo-cytoskeletal connectivity via dnKASH accelerates this process (Fig. 4) while mutated KASH protein (KASH-deltaPPPL) which has no ability to bind to the SUN domain, caused no detectable increase in adipogenesis (e). Similarly, the expression of SUN1L also increased adipogenesis (Fig. S9). As dnKASH expression (and possibly SUN1L) limits the nuclear entry of β-Catenin37 and YAP75 with anti-adipogenic functions in MSC33,34,35,36, disabling LINC complex function may accelerate adipogenesis through these mechanisms. In contrast, increased H3K9me3 methylation in response to SUN1/2 depletion was correlated with reduced adipogenic differentiation, as shown through western blot analysis, RNA-seq analysis, and lipid droplet counts. Further, we consistently observed H3K9me3 heterochromatin enrichment on the adipogenic gene Adipoq, potentially indicating that SUN1/2 depletion-induced enrichment of H3K9me3 was critical to impaired adipogenesis. These results indicate that SUN1/2 proteins regulate H3K9me3 heterochromatin organization independent of the LINC complex-mediated nucleo-cytoskeletal connectivity and alter adipogenesis in MSCs. H3K9me3 is enriched in Lamin Associated Domains (LADs) and during adipogenesis, the localization of adipogenic genes in LADs decreases along with decreased enrichment of H3K9me3 and increased enrichment of euchromatin markers H3K4me1, H3K4me3, and H3K27ac76. As such, decreasing H3K9me3 of adipogenic genes is required prior to adipogenesis. Our results indicate that SUN1/2 proteins regulate H3K9me3 heterochromatin organization independent of the LINC complex-mediated nucleo-cytoskeletal connectivity and are necessary for the proper regulation of adipogenesis in MSCs.
Downregulation of LINC complex components, including SUN1, SUN2, and Nesprin-2 have been observed in early stage human carcinomas77,78 and loss of these proteins were associated with more aggressive tumors and poorer prognosis79,80,81,82. In our study, we found that SUN1/2 depletion increased tumorigenic and osteolytic factors Cxcl10, Cxcl1, and Cxcl5 (Table S1). Increases in these genes are associated with increased metastasis in breast cancer83 and prostate cancer84 as well as promoting osteoclast differentiation85,86 and angiogenesis87. In contrast, dnKASH expression downregulated the same genes (Table S4), indicating a reduction in the osteolytic and tumorigenic signaling. While the underlying mechanism for these observed differences between SUN1/2 and dnKASH treatments are unknown, our results indicate that SUN proteins may play a more direct function in activating cancer- and growth-associated signaling in MSCs.
Uniquely, our data shows that depletion of SUN1/2 and displacement of Nesprin 1-2 via dnKASH induce different responses in MSCs during adipogenesis. Our observed differences in the responses to these perturbations of the LINC complex may arise from the different locations of SUN proteins and Nesprins inside the nuclear envelope and, therefore, different roles in the LINC complex. Nesprin 1-4 span1,37 from the perinuclear space (PNS) in the nuclear envelope through the outer nuclear envelope and connect to the cytoskeleton elements of actin, microtubules, and intermediate filaments while SUN proteins project from the PNS through the inner nuclear membrane to inside the nucleus connecting to internuclear elements like LEM proteins11 and chromatin63. Expression of the SUN1 luminal sequence (SUN1L), which binds to Nesprin without being tethered to the INM, induced accelerated adipogenesis compared to controls (Fig. S9). When conducting rescue experiments, we noticed that performing both siRNA and plasmid transfections were harsher on cells (Fig. S3). To test the effects of the co-transfection we used an empty vector (Fig. S2). The inclusion of an empty vector following siRNA treatment significantly decreases the cell’s ability to differentiate when compared to the group with transfection reagent but without a plasmid DNA (-EV). -EV group still had the transfection reagent (lipefectamine 3000) added, so that the difference is specific to plasmid we are using, not due to transfection reagent. Utilizing more siRNA-tolerant 3T3-L1 cells showed that expression of hSUN1 and hSUN2 were able to rescue siSUN-mediated decrease in adipogenesis (Fig. S3), suggesting that decreased adipogenesis levels were specifically due to SUN1/2 depletion.
As pointed out by a recent review by Guilluy et.al. SUN proteins indeed have LINC-independent functions,88 suggesting that SUN proteins may have evolved earlier than LINC complex-dependent nuclear-cytoskeletal coupling. Our data supports this bicameral functionality of SUN proteins and shows that depletion of SUN1/2 and disrupting LINC function—either via displacement of Nesprin 1-2 via dnKASH or SUN1L induce different responses in MSCs during adipogenesis. Observed differences in the responses to these perturbations of the LINC complex may arise from the different locations of SUN proteins and Nesprins inside the nuclear envelope and therefore different roles in the LINC complex. Nesprin 1–4 proteins span1,37 from the perinuclear space through the nuclear envelope to the outer nuclear envelope, and connect to the cytoskeleton elements of actin, microtubules, and intermediate filaments. SUN proteins project from the perinuclear space through the inner nuclear membrane to inside the nucleus connecting to internuclear elements like LEM proteins11 and chromatin63. In this way, expression of the isolated SUN1 luminal sequence (SUN1L), which binds to Nesprins without being tethered to the inner nuclear membrane, induced accelerated adipogenesis compared to controls (Fig. S9). Additionally, when conducting rescue experiments with human SUN2 (hSUN2), adipogenesis increased in comparison to controls (Fig. S3). These data indicate that depleting SUN proteins are not only detrimental to the mechanotransduction of signals into the nucleus but also causes dysregulation of chromatin. Whereas modulating nuclear connectivity to the cytoskeleton largely affects mechanotransduction.
In conclusion, our work reveals new insight into the role of SUN1/2 proteins in the nuclear interior and their effect on differentiation. Depletion of SUN1/2 increased H3K9me3 heterochromatin and inhibited adipogenesis. These outcomes were different in dnKASH or SUN1L expressing MSCs, and thus, the effects of SUN1/2 depletion are at least partly independent of the LINC complex function. These results add to our understanding how envelopathies targeting the nuclear envelope have detrimental effects on diagnosed patients. Our results may further reveal why cells from patients diagnosed with Emery-Dreifuss muscular dystrophy (EDMD) with SUN mutations72,89 experience perturbed mechanosignaling and nuclear fragility and why patients with aberrant accumulation of SUN mutations are also associated with more severe progeria symptoms90,91. Thus, these results expand our understanding of the important role inner nuclear membrane proteins have in regulating proper nuclear functions and, ultimately, human health.
Methods
MSCs isolation
Bone marrow derived MSCs (mdMSC) from 8- to 10-week-male C57BL/6 mice were isolated from three mouse donors and MSCs pooled, providing a heterogenous MSCs cell line.50,92 Briefly, tibial and femoral marrow were collected in RPMI-1640, 9% FBS, 9% HS, 100 μg/ml pen/strep, and 12 μM l-glutamine. After 24 h, non-adherent cells were removed by washing with phosphate-buffered saline, and adherent cells were cultured for 4 weeks. Passage 1 cells were collected after incubation with 0.25% trypsin/1 mM EDTA × 2 min, and replated in a single 175-cm2 flask. After 1–2 weeks, passage 2 cells were replated at 50 cells/cm2 in an expansion medium (Iscove modified Dulbecco’s, 9% FBS, 9% HS, antibiotics, l-glutamine). mdMSC were replated every 1–2 weeks for two consecutive passages up to passage 5, tested for osteogenic and adipogenic potential, and subsequently frozen. We have complied with all relevant ethical regulations for animal use and all procedures were approved by Boise State University Institutional Animal Care and Use Committee.
Stable cell lines to disrupt LINC complex function
MSCs were stably transduced with a doxycycline-inducible plasmid expressing a mCherry-tagged dominant-negative KASH domain. dnKASH plasmid was lentivirally packaged as a generous gift from Dr. Daniel Conway. Vector map found here: https://www.addgene.org/125554/. Lentivius supernatant was added to the growth media with polybrene (5 μg/ml). Lentivirus growth media mixture was added to 50–70% confluent MSCs. Lentivirus media was replaced 48 h later with selection media containing G418 (1 mg/ml) for 5 days to select stably infected dnKASH-MSCs. Adenoviruses contained mutated KASH protein (KASH-deltaPPPL) and empty mCherry were gift from Dr. Daniel Conway and were used as controls.
Doxycycline-inducible SS-EGFP-SUN1L-KDEL (SUN1L-KDEL) or SS-EGFP-KDEL (EGFP-KDEL) harboring pRetroX.Tight.puro plasmids were gift from gift from Dr. Daniel Conway and Dr. Kyle Roux and was generated as previously reported.93 Retrovirus was added to 50–70% confluent MSCs and was replaced 48 hours later with selection media containing puromycin (5 µg/ml) for 5 days to select stably infected SUN1L-KDEL or EGFP_KDEL MSCs dnKASH-MSCs.
Cell culture and pharmacological reagents
Fetal calf serum (FCS) was obtained from Atlanta Biologicals (Atlanta, GA). MSCs were maintained in IMDM with FBS (10%, v/v) and penicillin/streptomycin (100 μg/ml). For immunostaining experiments, the seeding cell density was 3000 cells per square centimeter. For adipogenic differentiation experiments, the seeding cell density was 10,000 cells per square centimeter. Cells were either grown in growth media (GM) or adipogenic media (AM). Cells were transfected 24 h after cell seeding with siRNA targeting SUN1 and SUN2 (siSUN) or a control sequence (siCntl) using RNAiMax from Invitrogen. Adipogenic media was placed on siRNA-treated cells 24 h after the transfection, the adipogenic media was added, which contained dexamethasone (0.1 μM), insulin (5 μg/ml), and indomethacin (1 μg/ml) for 5 days. For dnKASH-MSCs, cells were seeded at 10,000 cells per square centimeter. Twenty-four hours after seeding, dnKASH cells were given growth media containing doxycycline (1 μg/ml). Adipogenic media containing dexamethasone (0.1 μM), insulin (5 μg/ml), indomethacin (1 μg/ml), and doxycycline (1 μg/ml) (AM + Dox) or growth media (GM + Dox) was placed on dnKASH-MSCs twenty-four hours after adding initial doxycycline. Control cells were grown in growth media (GM) or adipogenic media (AM) without doxycycline. Growth media or adipogenic media with or without fresh doxycycline were changed every 48 h.
For the knockdown-rescue experiments, 3T3-L1 cells (ATCC CL-173) are seeded at 60–80% confluency in 2 ml of media per well on a six-well plate the day prior to transfection with siRNA. One hour prior to transfecting with siRNA, the growth media on the plate was aspirated and replaced with 1 ml of fresh growth media. For the siRNA transfection, 30 pmol of siRNA was mixed with 9 µl of Lipofectamine RNAiMAX (Invitrogen) in 300 µl Opti-MEM reduced serum media (Gibco) for each well-transfected. After incubation at room temperature for 5 min, the siRNA transfection complex was added dropwise to the well, the plate was then shaken gently to mix and incubated at normal growth conditions for 18 h. After the 18-h incubation, the media with the siRNA transfection complex was aspirated, the wells were washed once with 1 ml of growth media, and 1 ml of growth media was added per well. The cells were allowed to recover for one hour after the siRNA transfection complex was removed and then transfected with a plasmid containing a siRNA-resistant sequence of the gene targeted by siRNA or an empty vector plasmid as a control. For the plasmid transfection, 2.5 µg of plasmid DNA was mixed with 5 µl P3000 reagent and 7.5 µl Lipofectamine 3000 (Invitrogen) in 250 µl Opti-MEM per well. The plasmid transfection complex was incubated at room temperature for 15 min and then added dropwise to each well, shaken gently to mix, and incubated at normal growth conditions for 24 h. After 24 h, 2 ml of growth media or adipogenic media was added to each well, and the cells were incubated until adipogenic cells were observed. Transfection controls were isolated after 2 days to confirm siRNA knockdown and transgene expression. The success of the transfection was confirmed by Western blotting to confirm complementation and adipogenesis was performed as described above.
siRNA silencing sequences and plasmids
For transient silencing of MSCs, cells were transfected with gene-specific small interfering RNA (siRNA) or control siRNA (20 nM) using RNAiMax (Thermo Fisher) according to the manufacturer’s instructions. The following Stealth Select siRNAs (Invitrogen) were used in this study: Control Thermo Fischer Scientific, Catalog# 4390843, SUN1 (Thermo Fischer Scientific, Assay ID #s94913), SUN2 (Thermo Fischer Scientific, Assay ID #s104591). The plasmids used for the knockdown-rescue experiments are: pEGFP-SUN1_785 (Addgene 125852), SUN2 (NM_001199579) Human Tagged ORF Clone (Origene RC234801), and pCMV6-Entry (OriGene PS100001) as the empty vector control.
qPCR
About 2 ul of each CUT&RUN sample was run in a 20 ul reaction following Bio-Rad protocols targeting Adipoq (Bio-Rad, 10025636). Briefly, 20 ul reactions were made using SsoAdvanced Master Mix (Bio-Rad, 1725270). Reactions were then run at 95 °C for 2 min. Then samples were heated at 95 °C for 15 s then cooled to 60 °C for 30 s which both steps were repeated for 40 cycles. Finally, samples were run at 60 °C for 2 min. Samples were then analyzed for the percent of input sample for CUT&RUN-qPCR.
RNA-seq
Five days after adipogenic treatment, following the above protocols, total RNA was extracted using RNAeasy (Qiagen) for three samples per group. Total RNA samples were sent to Novogene for mRNA sequencing and analysis. Briefly, an index of the reference genome was built using Hisat2 v2.0.5 and paired-end clean 2 reads were aligned to the reference genome using Hisat2 v2.0.5. featureCounts v1.5.0-p3 was used to count the reads numbers mapped to each gene. And then fragments per kilobase of exon per million mapped fragments (FPKM) of each gene was calculated based on the length of the gene and reads count mapped to this gene. FPKM, expected number of fragments per kilobase of transcript sequence per millions base pairs sequenced. Differential expression analysis was performed using the DESeq2 R package (1.20.0). DESeq2 provides statistical routines for determining differential expression in digital gene expression data using a model based on the negative binomial distribution. The resulting P values were adjusted using Benjamini and Hochberg’s approach for controlling the false discovery rate. Genes with an adjusted P value ≤0.05 found by DESeq2 were assigned as differentially expressed. Genes with significant differential gene expression were further analyzed with DAVID94 for pathway analysis. Pathways with an FDR ≤0.05 were selected.
Immunofluorescence
Twenty-four hours after the siRNA treatment against SUN1/SUN2 or dnKASH expression, cells were fixed with 4% paraformaldehyde. Cells were permeabilized by incubation with 0.3% Triton X-100. Cells were incubated in a blocking serum in PBS with 5% Donkey Serum (017-000-121, Jackson Immuno Research Laboratories). The primary antibody solution was incubated on the cells for 1 h at 37 oC, followed by secondary antibody incubation of either Alexa Flour 594 goat anti-rabbit (Invitrogen), Alexa Fluor 488 goat anti-mouse (Invitrogen), Alexa Fluor 488 chicken anti-rabbit (Invitrogen), or Alexa fluor 594 Donkey anti-mouse (Invitrogen). For nuclear staining cells were incubated with NucBlue Hoechst 33342 stain (Fisher Scientific). Primary and secondary concentrations were both 1:300 by volume. Antibodies used for immunofluorescence are listed in Supplementary Table S6.
Image analysis
Five days after adding adipogenic media, cells were fixed and stained with Lipid Spot 488 (Biotium, #70069), and NucBlue Hoechst 33342 stain. Images were taken using 20x objective and were exported to quantify lipid droplet formation via a custom-made MATLAB program (The MathWorks, Natick, MA), previously published39,50. The minimum pixel intensity of 80 was used to isolate lipid droplet staining. The mean lipid droplet intensity per cell was calculated by dividing the sum of lipid droplet stain intensity by the nuclei count per image. Exported images were used to quantify lipid droplet formation, SUN1, SUN2, mCherry, nuclear area, nuclear perimeter, and nuclear circularity via the custom-made MATLAB program previously published67. Cell Profiler (https://cellprofiler.org/) was used to count the number of H3K9me3 foci per cell and foci area. Imaging parameters were as follows: The Numerical Aperture of their objective: HC PL APO CS2 63x/1.40 OIL. The correction level of their objective: coverslip standard. The brand of microscope used: Leica Stellaris 5 Confocal System. The fluorescent excitation and emission filters used: 425–502 nm, 502–587 nm, 587–750 nm. The camera used: HyD internal detector channels. The light source used: Confocal (405, 488, and 561 nm lasers).
Western blotting
Whole cell lysates were prepared using radioimmunoprecipitation assay (RIPA) lysis buffer (150 mM NaCl, 50 mM Tris HCl, 1 mM EDTA, 0.24% sodium deoxycholate,1% Igepal, pH 7.5) to protect the samples from protein degradation NaF (25 mM), Na3VO4 (2 mM), aprotinin, leupeptin, pepstatin, and phenylmethylsulfonylfluoride (PMSF) were added to the lysis buffer. Western protein amounts were normalized to 15 μg through BCA Protein Assay (Thermo Scientific, #23225). Whole cell lysates (20 μg) were separated on 10% poly-acrylamide gels and transferred to polyvinylidene difluoride (PVDF) membranes. Membranes were blocked with milk (5%, w/v) diluted in Tris-buffered saline containing Tween20 (TBS-T, 0.05%). Blots were then incubated overnight at 4 °C with appropriate primary antibodies. Following primary antibody incubation, blots were washed and incubated with horseradish peroxidase-conjugated secondary antibody diluted at 1: 5000 (Cell Signaling) at RT for 1 h in 5% milk in TBST-T. Chemiluminescence was detected with ECL plus (Amersham Biosciences, Piscataway, NJ). At least three separate experiments were used for densitometry analyses of western blots and densitometry was performed via NIH ImageJ software. Antibodies used in western blot are listed in Supplementary Table S7.
CUT&RUN
CUT&RUN was performed using the CUT&RUN Assay Kit (Cell Signaling #86652). Briefly, cells were harvested and centrifuged, washed, and bound to Concanavalin A‐coated magnetic beads. Cells were then permeabilized with digitonin and incubated with primary antibody for H3K9me3 (Active Motif, #39065) or IgG at 4 °C for 2 h. Cells were then washed and suspended with pAG-MNase enzyme and incubated at 4 °C for 1 h. Cells were then incubated at 37 °C for 10 min to elute DNA into solution. The solution was then extracted and purified using DNA Purification Buffers and Spin Columns (ChIP, CUT&RUN, Cell Signaling #14209). DNA samples were then used for qPCR or sequencing.
Statistics and reproducibility
Results for densitometry were presented as mean ± SEM. Densitometry and other analyses were performed on at least three separate experiments. Differences between groups were identified by one-way ANOVA. Analysis of nuclear morphology histone modifications were done using Whitney–Mann test and results were presented as mean ± STD. Differential gene expression analysis via DESEQ2 was done using the Wald test. P values of less than 0.05 were considered significant. Lipid image analysis groups were analyzed via the Kruskal–Wallis test. CUT&RUN-qPCR was analyzed via a one-tailed student’s t-test. All experiments were conducted in triplicate to assure reproducibility.


Responses