Des-γ-carboxy Prothrombin in hepatocellular carcinoma post-operative recurrence risk evaluation
Introduction
Hepatocellular carcinoma (HCC) is the second leading cause of cancer-related mortality in China1, posing a major health threat to Chinese population. Although curative hepatectomy has been proved to be an effective strategy in HCC management, the post-operative recurrence rate within five years remains over 70%, with the majority of recurrence occurring within the first two years2,3. Accurate and timely assessment of recurrence risk is crucial for improving HCC patient prognosis by facilitating early intervention strategies.
Des-γ-carboxy prothrombin (DCP) is an acknowledged HCC diagnosis biomarker that has been widely applied in clinical practice4,5, which has been recommended by Asia-Pacific and the Japan Society of Hepatology clinical practice guidelines for HCC screening6,7. Despite DCP’s value in diagnosis, its potential in prognosis has remained doubtful8,9,10. Currently, studies regarding post-operative measurements of DCP remained rare and corresponding data was still lacking. However, a few available studies have indicated that post-operative DCP concentrations were only associated with patients’ overall survival but not recurrence-free survival (RFS), suggesting that DCP might not effectively reflect the recurrence risk of HCC11. Although some studies have focused their efforts on utilizing other DCP features, such as the half-life of DCP or the ratio of pre-treatment DCP and post-treatment DCP12,13, for evaluating patients’ prognosis, their results have been less than satisfying due to the small sample sizes, which failed to provide sufficient evidence for clinical applications. A multicenter cohort study that provides a comprehensive profile of post-operative DCP is needed to fully explore the prognostic potential of DCP in HCC.
Here, we present a retrospective analysis of DCP measurements across two independent HCC cohorts. By examining post-operative DCP trends, we identify potential patterns in DCP dynamics related to HCC recurrence, thereby proposing an effective strategy to realize the prognostic potential of DCP. Thus, we introduce a measurement named the DCP dynamic rate, which quantifies the dynamic change of DCP levels normalized by each patient’s baseline. The association between DCP dynamic rate and prognosis is confirmed in the multicenter analysis and it could predict patients’ recurrence seven months ahead of imaging diagnosis. This study addresses the long-debated question regarding the prognostic value of DCP in clinic and points out an effective strategy for utilizing clinically established biomarkers by integrating their dynamics along with clinical courses rather than single test results.
Methods
Study design and patient selection
The flowchart depicting the study design is shown in Fig. 1. Our study encompasses two retrospective HCC cohorts and one prospective liver cirrhosis (LC) cohort to fully explore the profiles of post-operative DCP during clinical courses. The first retrospective cohort included patients diagnosed with HCC who underwent curative hepatectomy at the Mengchao Hepatobiliary Hospital of Fujian Medical University from July 2015 to August 2021. The inclusion criteria were as follows: (1) Histopathological confirmed hepatocellular carcinoma; (2) completion of R0 resection, denoting the removal of all visible tumor nodules during hepatectomy14; (3) availability of pre-operative DCP data alongside at least two post-operative DCP measurements within 2 years; and (4) had complete physio-biochemical clinicopathological data. Patients were excluded if they met any of the following criteria: (1) recurrence within the first month following hepatectomy; (2) loss to follow-up within three months; or (3) having less than two DCP measurements before recurrence. Another retrospective HCC cohort was included for validation, which contained patients from Shanghai Eastern Hepatobiliary Hospital between January 2015 and June 2018 based on the same inclusion and exclusion criteria.
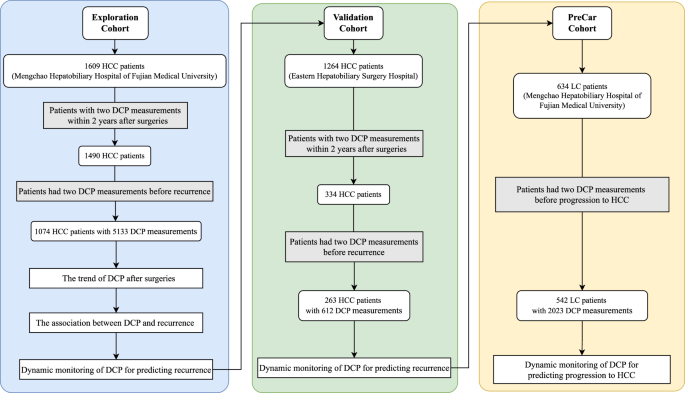
A multicenter retrospective analysis, including an Exploration Cohort and a Validation Cohort, was performed to investigate the association between DCP and HCC recurrence. Additionally, the PreCar Cohort, a program providing prospective surveillance for early hepatocellular carcinoma, was used to confirm the utility of dynamic DCP monitoring in predicting progression of LC liver cirrhosis to HCC.
To further validate our findings in other clinical scenarios, we collected data from the PreCar program conducted from August 2018 to December 2019. This program aimed to provide prospective surveillance for early HCC. The PreCar program included patients meeting following criteria: (1) age within 30–75 years; (2) diagnosis of liver cirrhosis (for patients with liver biopsy: METAVIR scores of 4 or Ishak scores of 5–6; for patients without liver biopsy: Presence of ascites, hepatic encephalopathy, or variceal hemorrhage). To extract patients that met the requirement of DCP evaluation, additional inclusion criteria were applied; (1) at least two recorded DCP measurements and (2) a duration of follow-up longer than 3 months. Patients lacked two DCP measurements prior to HCC diagnosis were excluded. The diagnosis of HCC adhered to the stringent criteria established by the European Association for the Study of the Liver15.
The study protocol was in compliance with the ethical guidelines of the 1975 Declaration of Helsinki (6th revision, 2008) and received approval from the Institutional Review Board of the Mengchao Hepatobiliary Hospital of Fujian Medical University (Approval ID: KESHEN 2021_065_01). Broad informed consents were obtained from all patients for the use of their data in clinical research.
Collection of clinicopathological data and patient follow-up
Clinicopathological data were systematically extracted from the electronic medical record system and manually reviewed. The dataset included demographic and clinical variables such as age, sex, tumor characteristics (size and number), histopathological differentiation grade, and microvascular invasion (MVI) status, in addition to serum levels of alpha-fetoprotein (AFP) and DCP. Serum AFP and DCP levels were quantified using an electrochemiluminescence immunoassay conducted on the LUMIPULSE G1200 immunoassay analyzer (Fujirebio Inc., Tokyo, Japan), strictly adhering to the manufacturer’s protocols. The cutoff values for HCC diagnosis were established at 25 mAU ml−1 for AFP and 40 mAU ml−1 for DCP.
All patients were regularly followed up, with a time interval of every three months during the initial two years post-hepatectomy, extending to biannual assessments thereafter. These follow-ups included comprehensive liver and kidney function tests, along with abdominal imaging via enhanced computed tomography (CT) or magnetic resonance imaging (MRI) conducted at outpatient clinics.
The primary outcome was defined as recurrence-free survival (RFS). When stratifying patients according to their status, RFS was calculated as the time interval from the date of hepatectomy to the first evidence of either intrahepatic recurrence, distant metastasis (confirmed by imaging modalities) or death from any cause. For survival analysis using time-varying covariates, patients with multiple measurements of such covariates were split into separate observations. In this context, RFS was calculated as the interval from the time of each covariate measurement to the first occurrence of intrahepatic recurrence, distant metastasis (confirmed by imaging), or death from any cause. Early recurrence was defined as any recurrence events occurring within 24 months following the hepatectomy16.
Measurement and analysis of DCP dynamic rate
DCP data were collected to span the entirety of the post-operative period up to two years, including the final measurement prior to hepatectomy and all subsequent measurements, whilst excluding any data obtained post-recurrence. To ensure the temporal relevance and consistency, only DCP measurements with intervals ranging from 3 to 180 days between consecutive assessments were considered as valid.
To elucidate the post-operative DCP trends and present the trajectory of DCP after hepatectomy, the Latent Class Growth Mixture Model (LCGMM) was used17. This model allows for the identification of distinct latent subgroups with varying DCP trajectories over time. Log transformation was applied for serum DCP levels because of its left skewness. Models were initially fitted with class numbers ranging from two to five, after which they were filtered using following criteria: (1) posterior probabilities greater than 0.75 for each class;(2) each class size representing at least 5% of the total population. The optimal model was then selected using indices including the Bayesian Information Criterion and Akaike Information Criterion.
The DCP dynamic rate was quantified through a methodical approach: the difference value between successive DCP measurements was computed, normalized by the initial measurement (baseline measure), and divided over the time interval between these measurements. This quotient was then converted to a percentage to represent the rate of change in DCP levels over time. The method for calculating the DCP dynamic rate incorporates the baseline of each patient, ensuring a balanced and individualized evaluation. This can be formalized in the following equation (Eq. (1)):
Here, DCP1 and DCP2 represent the first and the second consecutive DCP measurements, respectively, and the time interval is the number of days between these two measurements. The unit of the DCP dynamic rate is expressed as percentage per day.
The optimal cutoff value for DCP dynamic rate was identified by both decile and X-tile analysis18. The decile analysis ordered the DCP dynamic rates in an ascending sequence and divided them into ten equal parts, each representing 10% of the dataset. The demarcation of each decile serves as a potential cutoff point for subsequent risk stratification. The hazard ratio (HR) for recurrence was calculated comparing patients above each decile cutoff to those within the first decile, which served as the reference group. An increase in HR alongside ascending deciles that exceeded a predefined magnitude, indicated the identification of an optimal cutoff value. Concurrently, the X-tile method determined optimal cutoff values by analyzing data variability and identifying the point that maximizes the statistical difference between groups, which was visualized through survival analyses for stratification.
Statistics and reproducibility
Differences among various groups were assessed utilizing either Student’s t test or the non-parametric Mann–Whitney U-test for continuous variables, complemented by the chi-square test for categorical variables. The Kaplan–Meier analysis was employed to calculate RFS estimates for the DCP dynamic rate, with the differences accessed by the log-rank test. Further, Cox proportional hazards models facilitated the exploration of associations between DCP dynamic rate and the risk of recurrence. The capability of DCP to predict HCC occurrence in LC patients was quantified through the area under the receiver operating characteristic curve (AUC).
For the execution of latent class trajectory modeling, Kaplan–Meier analyses, Cox regression, and ROC curve plotting, R software (version 4.1.0) was utilized, incorporating with the packages hlme, survival, survminer and pROC. Additional statistical computations were conducted using SPSS (version 19.0.0.1, IBM, 2010; Chicago, IL, USA) and the X-tile software for optimal cutoff determination. All tests of significance were two-sided, with a P-value threshold of <0.05 designated for statistical significance.
Reporting summary
Further information on research design is available in the Nature Portfolio Reporting Summary linked to this article.
Results
Study design and characteristics of HCC patients
To fully explore the spectrum of post-operative DCP and investigate if and how DCP could be utilized in prognosis evaluation, we conducted a discovery and external validation workflow in this study, as depicted in Fig. 1. The Exploration Cohort comprised 1074 HCC patients with 5133 DCP measurements (details in Supplementary Fig. 1), with a median follow-up of 23.3 (16.6–39.2) months, observing 46.3% (497/1074) patients experienced HCC recurrence within two years after hepatectomy. The Validation Cohort consisted of 263 HCC patients with 612 DCP measurements over a median follow-up of 10.4 (5.7–19.0) months. Among the Validation Cohort, 52.1% (137/263) patients underwent recurrence within two years. Additionally, a cohort of 542 LC patients with 2023 DCP measurements was enrolled to explore whether the application of our discovered DCP dynamic change patterns could be further extended to other scenarios. A total of 50 patients in this cohort progressed to HCC during the median follow-up time of 18.1 (11.9–25.3) months. Baseline characteristics for each cohort was detailed in Table 1.
The trajectory of DCP after hepatectomy
To understand how DCP change during patients’ clinical course after surgery, we first depicted the average trend of serum DCP in 1074 patients of Exploration Cohort (Fig. 2a). As expected, a notable decrease in DCP levels was observed following hepatectomy. This decrease resulted in most post-operative DCP concentrations falling predominantly below the commonly used threshold of DCP in HCC diagnosis (40 mAU ml−1, indicated by the dot line in Fig. 2b). Meanwhile, the last DCP measurements before recurrence showed noticeable elevation (depicted by the blue bars in Fig. 2b), which is consistent with tumor relapse. However, most of them still fell below the 40 mAU ml−1 threshold. This finding implies that relying solely on a 40 mAU ml−1 cutoff for determining HCC recurrence risk might lack sensitivity given the post-operative reduction following tumor removal. We also examined some other features prompted by previous studies including DCP half-life12 and DCP ratio between pre-operative and post-operative time points, but none of them showed promising performance in predicting tumor recurrence (Supplementary Fig. 2).
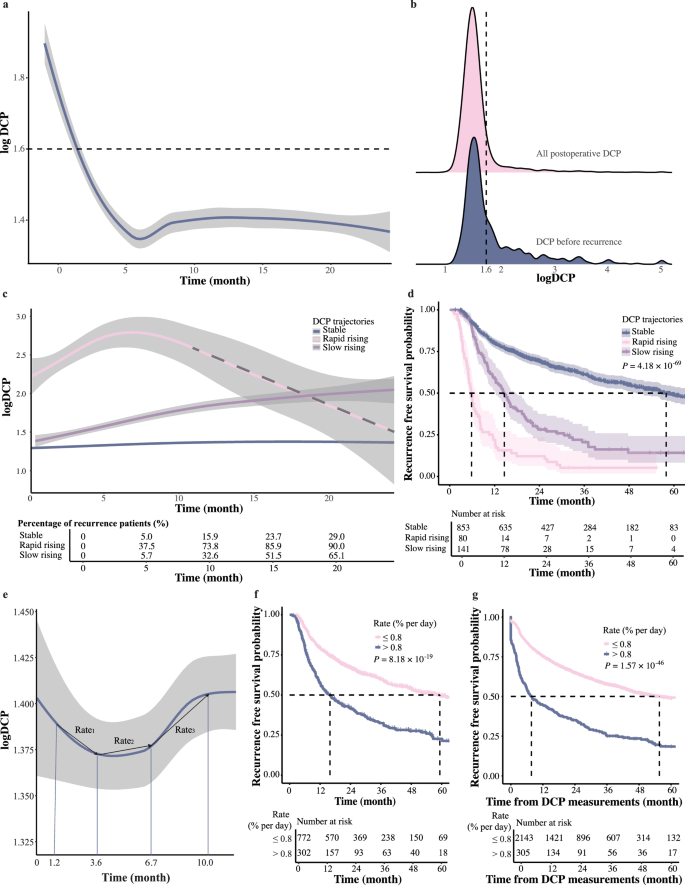
a The average trend of serum DCP from pre-operative to two years post-operative in 1074 patients of the Exploration Cohort (n = 6207 DCP measurements), the shaded areas around the lines indicate the 95% confidence intervals. b Post-operative DCP concentrations measured within two years. Red represents all post-operative DCP, and blue represents the last DCP before recurrence (n for all post-operative DCP = 5133 and n for the last DCP before recurrence = 498). c Three latent post-operative DCP trajectories: stable (blue), rapid rising (red), and slow rising (purple). The risk table below illustrates the percentage of recurrent patients at 5, 10, 15, and 20 months (n = 5133 DCP measurements), the shaded areas around the lines indicate the 95% confidence intervals. d The Kaplan–Meier curves of RFS according to the three DCP trajectories (log-rank test) (n = 1074 HCC patients), the shaded areas around the lines indicate the 95% confidence intervals. e The average trend of serum DCP over two years post-operatively, the shaded areas around the lines indicate the 95% confidence intervals. The median time of the first four DCP measurements were 1.2, 3.6, 6.7, and 10.0 months. The first four DCP measurements were analyzed for Rate1 (between DCP1 and DCP2), Rate2 (between DCP2 and DCP3), and Rate3 (between DCP3 and DCP4) (n = 5133 DCP measurements). f The Kaplan–Meier curves of RFS according to whether the rates were greater than 0.8% per day (log-rank test) (n = 1074 HCC patients). g The Kaplan–Meier curves of RFS using the DCP dynamic rate as a time-varying covariate (log-rank test) (n = 2567 DCP dynamic rates).
Therefore, we further evaluated how DCP level change during patients’ clinical courses, especially when they were undergoing tumor recurrence. We used LCGMM to capture the diversity of DCP trajectories and classify HCC patients into different classes based on their DCP trajectory patterns. Details on the model parameters for each class configuration were provided in Supplementary Table 1. Three latent post-operative DCP trajectories were identified as follows (Fig. 2c): rapid rising (7.4%, n = 80), slow rising (13.1%, n = 141), and maintaining stable (79.4%, n = 853). Corresponding clinical characteristics were detailed in Supplementary Table 2. The rapid rising group showed a sharp increase in DCP levels from an elevated baseline (above 40 mAU ml−1), the slow rising group exhibited DCP levels gradually increase during follow-up, and the stable group maintained DCP levels within the 0–40 mAU ml−1 range, indicating no marked fluctuations. Within expectation, significant prognostic differences among these groups were observed (P = 4.18 × 10−69, Fig. 2d), with the rapid rising group showed the worst RFS (median:5.8 months) and the stable group showed the best RFS (median: 57.9 months), while the slow rising group showed intermediate RFS (median: 14.6 months). The HRs for the rapid and slow rising groups were 2.809 (2.244–3.515) and 7.537 (5.747–9.885) respectively, further underscoring the association between DCP trends and recurrence risk. These results indicated that the dynamic change of post-operative DCP could reflect early recurrence risk in HCC patients, with the rising rates of DCP levels playing a crucial role. Therefore, we might need to utilize dynamics of DCP levels obtained from multiple measurements for a sensitive evaluation of HCC early recurrence.
The DCP dynamic rate
To better quantify fluctuations of DCP after hepatectomy, we proposed the concept of DCP dynamic rate, which is defined as the difference value between successive DCP measurements divided by the initial measurement and the time interval between the two measurements. In this formula, the first post-operative DCP value was used as the personalized baseline to minimize individual variability, as depicted in Fig. 2e. The first four DCP measurements after surgeries were analyzed for Rate1 (between DCP1 and DCP2), Rate2 (between DCP2 and DCP3), and Rate3 (between DCP3 and DCP4).
We then investigated how the DCP dynamic rates might be related to patients’ prognosis by dividing patients into ten deciles according to their DCP dynamic rates. Using the lowest decile as the reference, detailed HRs for various ranges of Rate1, Rate2, and Rate3 revealed that patients with DCP dynamic rates exceeding 0.8% per day exhibited progressively increased risks of recurrence (Table 2). Specifically, for Rate1 in the ranges of 0.794–1.111, 1.111–2.308, and >2.308 % per day, the HRs were 2.348 (1.366–4.038), 2.526 (1.476–4.323), and 6.271 (3.701–10.624), respectively. For Rate2 in the ranges of 0.556–0.958, 0.958–3.429, and >3.429 % per day, the HRs were 2.212 (1.072–4.564), 4.094 (2.022–8.291), and 13.266 (6.819–25.808), respectively. Similar patterns were observed for Rate3, in the ranges of 0.683–1.429 and >1.429 % per day, the HRs were 2.292 (1.104–4.757) and 6.101 (3.027–12.294). Meanwhile, when the DCP dynamic rates were below the threshold of 0.8% per day, their increase/decrease did not significantly affect patients’ prognosis.
Consistent with this, patients with DCP dynamic rates exceeding 0.8% per day at any time point had a significantly reduced median RFS compared to those below this threshold (15.9 vs. 59.3 months, P = 8.18 ×10⁻¹⁹, shown in Fig. 2f ). Furthermore, we performed Kaplan–Meier analysis as well as univariate Cox analysis using the DCP dynamic rate as a time-varying covariate to better illustrate its value in evaluating patients’ recurrence risk. The result again showed a strong correlation between DCP dynamic rates and patients RFS in both Kaplan–Meier analysis (P = 1.57 ×10−46, Fig. 2g) and univariate Cox analysis with a HR of 2.711 (2.351–3.126, P = 1.92 ×10−43). Thus, DCP dynamic rate could serve as a key measurement of early recurrence risk, and this threshold was used for subsequent analyses.
The association between DCP dynamic rate and recurrence
With the DCP dynamic rate proved to be associated with patients’ tumor relapse, we further combined it with the diagnosis threshold of DCP to see whether this combination could better predict tumor recurrence. Patients were classified into three groups: double negative (below both the 0.8% per day for the DCP dynamic rate and 40 mAU ml−1 level for DCP concentration), single positive (exceeding one of these thresholds), and double positive (exceeding both thresholds). Specifically, the three-month recurrence rates were 6.3% for double-negative, 17.4% for single-positive, and 48.3% for double-positive patients (P = 6.72 ×10−76). Furthermore, six-month recurrence rates for different groups were 13.5%, 27.9%, and 63.2%, respectively (P = 7.60 ×10−68, Fig. 3a). Consistent with above results, patients with both DCP dynamic rates exceed 0.8% per day and DCP levels above 40 mAU ml−1 exhibited the worst RFS compared to those who met only one criterion. Those negative for both showed the best RFS (66.0 vs. 26.5 and 9.0 months, P = 1.05 ×10−36, Fig. 3b). Furthermore, Kaplan–Meier analysis using the group classification as a time-varying covariate also showed a consistent correlation between the classification and patients’ RFS (P = 3.41 ×10−107, Fig. 3c).
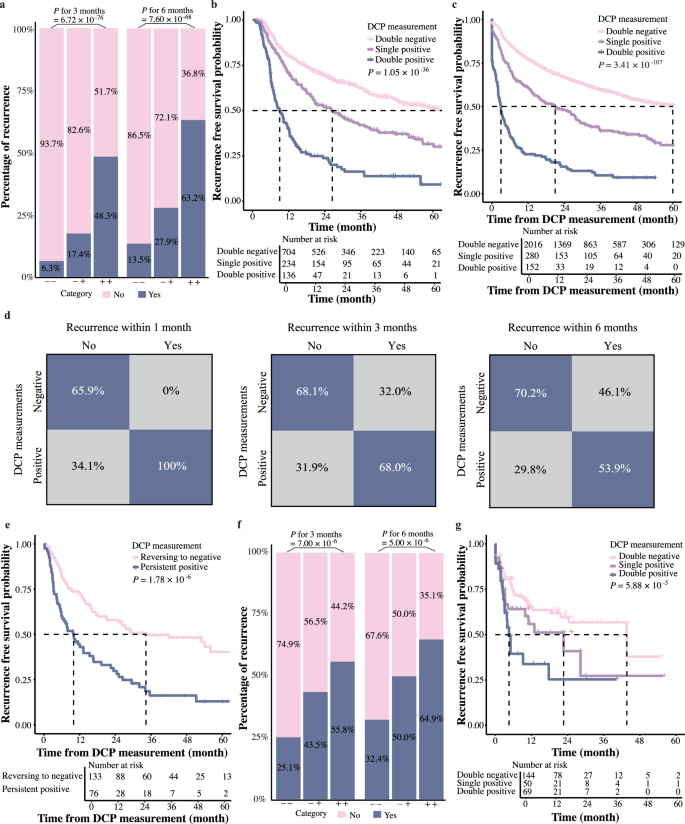
a The bar plot showing the percentage of patients with recurrence within three and six months after surgeries. “−−” represents DCP dynamic rates ≤ 0.8% per day and DCP concentrations <40 mAU ml−1. “−+” indicates that either the DCP dynamic rates or DCP concentrations exceeded the threshold. “++” represents that both values exceeded the thresholds (n = 2567 measurements combining DCP dynamic rate and DCP concertation). b The Kaplan–Meier curves of RFS according to whether the DCP dynamic rates and DCP concentrations exceeded their respective thresholds (log-rank test) (n = 1074 HCC patients). c The Kaplan–Meier curves of RFS using the DCP dynamic rate and DCP concentrations as a time-varying covariate (log-rank test) (n = 2567 measurements combining DCP dynamic rate and DCP concertation). d Confusion matrix showing DCP performance for classifying recurrence. Positive: either or both the DCP dynamic rates or DCP concentrations exceeded the thresholds. Negative: neither exceeded the thresholds (n = 2567 measurements combining DCP dynamic rate and DCP concertation). e The Kaplan–Meier curves comparing RFS between patients with consistently positive DCP levels after the first positive results and those whose status reverted to negative (log-rank test) (n = 209 measurements combining DCP dynamic rate and DCP concertation). f The bar plot showing the percentage of patients with recurrence within three and six months in the Validation Cohort (n = 318 measurements combining DCP dynamic rate and DCP concertation). g The Kaplan–Meier curves of RFS in the validation cohort according to whether the DCP dynamic rates and DCP concentrations exceeded their respective thresholds in the Validation Cohort (log-rank test) (n = 263 HCC patients).
These results indicated that combination of the absolute value of DCP concentration along with its dynamic change could indeed distinguish patients at an elevated risk of tumor recurrence. With this strategy, 68.0% of HCC recurrences could be predicted three months prior to diagnosis and 53.9% could be predicted six months before tumors were detected by imaging (Fig. 3d), which could be valuable in monitoring HCC recurrence.
To confirm the robustness of the findings, further analysis stratifying patients by clinical characteristics was performed. The results revealed that the trends in DCP were associated with early recurrence across different sex, ages, tumor sizes, differentiation grade, and MVI status. These results remained consistent even when considering the competing nature of death and tumor recurrence (HR = 1.958, range: 1.838–2.078, P = 0, Table 3). Notably, the association between changes in DCP levels and early recurrence remained evident even in patients with negative AFP at either pre- and post-operative timepoints, the HRs were 2.195 (1.687–2.857) and 2.050 (1.661–2.529), respectively. It reinforced the robust predictive value of DCP trends for early recurrence evaluation in HCC.
Dynamic monitoring of DCP for predicting recurrence
With the number of positive DCP measurement increased, the recurrence risk escalated, with the HR was 1.557 (1.41–1.715) and a beta value of 0.443, signifying a 44.3% rise in recurrence risk per additional positive DCP measurement. This association has been substantiated across diverse patient groups, as detailed in Supplementary Table 3, underscoring the predictive power of repeated positive DCP in forecasting recurrence across a spectrum of clinical scenarios, indicating the necessity of dynamic monitoring of DCP in predicting patients’ recurrence.
For evaluating how regular DCP measurements could benefit HCC recurrence prediction, a small group of HCC patients (99 out of 1074) in Exploration Cohort with approximately regular DCP tests at three time points (1-month, 4-month and 7-month after surgeries) was extracted. The results showed that routine DCP assessments combined with our proposed DCP evaluation strategy could effectively evaluate patients’ recurrent risk (P = 3.99 ×10⁻⁵, shown in Supplementary Fig. 3), allowing for early prediction of recurrence an average of 410 days before imaging diagnosis.
Following a positive DCP measurement, patients whose subsequent tests continued to yield positive results faced a higher recurrence risk than those whose results reverted to negative. The median RFS was 10.0 months for patients with persistent positive measurements and 34.3 months for those whose measurements returned to negative (P = 1.78 ×10⁻⁶, Fig. 3e). After adjusting for sex, ages, tumor sizes and number, differentiation grade, and MVI between two groups, multivariate Cox regression analysis revealed a HR of 1.912 (1.308–2.794, P = 0.001). This data highlighted the role of dynamic DCP monitoring in facilitating the timely evaluation of intervention outcomes and guiding strategic modification of treatment protocols.
External validation of DCP dynamic rate
To validate our findings, 263 HCC patients from Shanghai Eastern Hepatobiliary Hospital were enrolled as the Validation Cohort, with a total of 612 DCP tests. The trends of DCP in this cohort was depicted in Supplementary Fig. 4. DCP levels in the validation cohort differed from those in the exploratory cohort, with 49.2% of DCP values exceeding 40 mAU ml−1. Nonetheless, the DCP dynamic rate remained applicable. The analysis results were consistent with Exploration Cohort, demonstrating that the probabilities of recurrence within three months for patients with double-negative, single-positive, and double-positive statuses were 25.1%, 43.5%, and 55.8%, respectively, and within six months were 32.4%, 50.0%, and 64.9% respectively (Fig. 3f ). Patients that exhibited both DCP dynamic rates >0.8% per day and levels exceeding 40 mAU ml−1 had the worst RFS compared to those positive for only one criterion, whereas patients negative for both showed the best RFS (9.3 vs. 12.3 and 22.7 months, P = 5.88 × 10⁻⁵, Fig. 3g and Supplementary Fig. 4). These results affirmed the combination of the DCP dynamic rate and concentration for predicting recurrence risk. This underscores the value of dynamic DCP monitoring for HCC progression risk assessment and early recurrence prediction.
Expanding the application of DCP dynamic rate to other clinical scenarios
Above results have demonstrated that DCP dynamics could be utilized to evaluate the change of low-level tumor burden. This raised the question whether such approach could be applied in other clinical scenarios. Therefore, we further investigated whether our prompted DCP dynamic rate could also aid the risk assessment in predicting HCC occurrence in LC patients.
The patients in the prospective surveillance PreCar cohort were enrolled and the same analytical methodology was applied. We initially reviewed all DCP levels in LC patients (illustrated by the red part in Fig. 4a). Similar to post-operative HCC patients, the majority of DCP levels in LC patients remained below the 40 mAU ml-1 threshold. We then assessed the final DCP measurements before progression to HCC in 50 patients. These measurements predominantly stayed below 40, showing only minimal fluctuations (highlighted by the blue part in Fig. 4a). This implied a risk of insufficient sensitivity when using only a 40 mAU ml−1 cutoff to predict HCC occurrence in LC patients. Capturing minor fluctuations might be crucial when DCP levels are persistently low. Therefore, the approach we previously proposed, which combines DCP dynamic rates with absolute values, is particularly suited in this scenario.
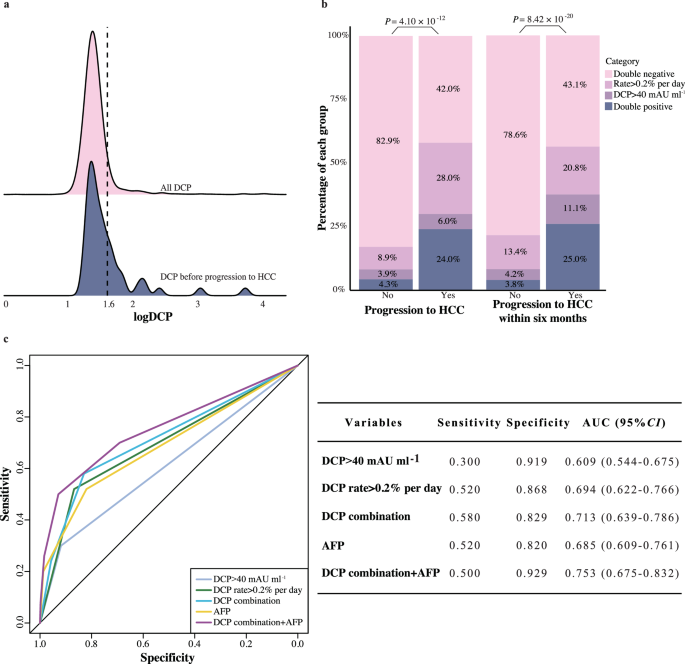
a DCP levels during the follow-up period for all LC patients. Red represents all DCP measurements, while blue represents the last DCP before diagnosis for the 50 patients who progressed to HCC (n for all DCP measurements = 2973 and n for the last DCP before diagnosis = 50). b Bar plot showing the percentage of patients who progressed to HCC based on DCP categories (n = 170 measurements combining DCP dynamic rate and DCP concertation). c ROC curve demonstrating the diagnostic performance of DCP for HCC (n = 542 LC patients). AFP Alpha Fetoprotein.
In line with the previous analyses, DCP dynamic rates for each measurement were analyzed and a cutoff value of 0.2% per day was established using decile and X-tile analysis. Incorporating DCP dynamic rate greater than 0.2% per day with DCP concentration markedly improved predictive capability, identifying an additional 28.0% of patients at risk for progressing to HCC compared to solely using the 40 mAU ml−1 threshold (Fig. 4b). This combination approach achieved a 58.0% sensitivity for early detection of HCC. Dynamic DCP changes identified 56.9% of high-risk LC patients likely to develop HCC six months in advance of diagnosis by imaging (Fig. 4b). Predictive accuracy of DCP trends, represented by an AUC of 0.713, was further improved to 0.753 when combined with AFP (Fig. 4c). These results again proved that DCP change could indeed reflect the emergence of tumor with high sensitivity, suggesting our prompted concept could have the potential to be further applied in other clinical aspects.
Discussion
Utilizing the LCGMM, this study identified three distinct post-operative DCP trends with significantly different prognosis. The DCP dynamic rate was crucial for predicting recurrence and integrating it with the standard diagnostic thresholds (40 mAU ml−1) significantly improves early detection. Moreover, timely interventions that reduce DCP levels are linked with lower recurrence risks. Additionally, when applicable to LC patients, DCP dynamic rate can enhance HCC surveillance. Therefore, monitoring the DCP dynamic rate could improve both diagnostic and prognostic outcomes in managing HCC.
The prognostic value of established HCC diagnostic biomarkers such as DCP and AFP has been long debated19,20,21,22 and there were rare studies regarding post-operative measurements of DCP, let alone fully explore the profiles of post-operative DCP in prognosis evaluation. Some studies including data of post-operative DCP pointed out that its performance is unsatisfiable in discovering tumor recurrence compared to other biomarkers including serum angiopoietin 2 and circulating tumor DNA11,23. This is majorly because most patients showed over 50% reduction in DCP, with levels remaining below the diagnostic threshold for up to ten months5,24. Other studies have proposed some alternative metrics including DCP half-life or the ratio of pre- and post-treatment DCP levels25,26, but their sample sizes are limited, and they still use a uniform threshold for all patients, without fully considering individual differences. Using the multicenter study, we thoroughly explored the profiles of post-operative DCP during patients’ clinical course and pointed out that the post-operative DCP levels of HCC patients showed strong individual differences, with the post-operative DCP levels ranging from 6 to 34099 mAU ml−1. In current study, when building the strategy to quantify the dynamic change of DCP, we integrated the DCP levels at previous time-point as the baseline to reduce the bias caused by individual differences. Our approach indeed achieved the object of predicting HCC recurrence risk and demonstrated that establishing a corrected personal baseline in serials DCP tests could be essential for a more accurate, personalized assessment.
Our research aimed to close the gap for utilizing DCP as a prognostic marker in HCC, revealing how its dynamic change could reflect the change of patients’ disease status and what strategy should be deployed to utilize it in evaluating patients’ risk of recurrence. Our analysis pointed out routine assessments of DCP are vital for timely detection, as abnormal changes in DCP levels reflect the growth of tumor, like other prognostic biomarkers presented by different studies14,27, and a sudden increase of DCP levels reflected by DCP dynamic rates might hint the expansion of tumor cell population, which would eventually leads to tumor recurrence. Our analysis revealed that repeating the test of DCP dynamic rates proved more effective than a single measurement. The second DCP test after the DCP dynamic rates become positive, could further enhance the assessment of whether the tumor burden increase is suppressed by treatments, as evidenced by a change of DCP dynamic rates from positive to negative. We proposed the ideal monitoring interval of post-operative DCP tests should be three months. However, patients with routine DCP tests remained rare, as it could be observed in our cohorts where most patients have regular follow-ups. It’s recommended to further improve routine DCP testing to better monitor tumor burden and improve the accuracy of early recurrence predicting. However, our results also showed that even with irregular testing, patients still could benefit, as more frequent DCP measurements increased the likelihood of early detection, even if not conducted on a regular schedule of every three months. In fact, DCP tests with an interval as long as 178 days could still predict patients’ recurrence ahead of imaging diagnosis. Therefore, we provided scientific insights that might help the development of future clinical guidelines regarding the application of DCP in prognostic evaluations. In cases of low tumor burden, our strategy confirmed that the DCP dynamic rate could supplement existing clinical thresholds28, providing a more accurate assessment of tumor recurrence. This strategy might also be useful in other scenarios, including the early HCC detection in high-risk population, which is shown in our analysis results of LC cohort. Therefore, our research methodology has the potential applicability and generalizability in future clinical applications.
However, our study still had several limitations. Firstly, it focused exclusively on patients undergoing hepatectomy. However, the use of targeted therapy, immunotherapy, and combination treatments has been increasingly prevalent in recent years29,30 Therefore, future studies should explore the value and applicability of DCP across various treatment modalities. Secondly, irregular follow-up testing and the limited number of cases with DCP measurements in the current cohorts call for additional cohort studies with more systematic testing schedules, despite external and prospective validations were already performed. Lastly, given that our study focused on Chinese patients primarily with HBV-related HCC, the methods also require further adjustment to be applicable to diverse ethnicities and etiologies, underscoring the necessity for expansive prospective cohort studies.
In summary, our analysis thoroughly investigates how to utilize DCP, an established clinical HCC biomarker, in prognostic evaluation. Long-term dynamic changes in post-operative DCP provide progznostically relevant information and combining our proposed DCP dynamic rate with the absolute concentration of DCP could achieve sensitive prediction of tumor recurrence. This approach greatly improves the prediction of early recurrence risks and have potential in other clinical scenarios.
Responses