Design of sensitive monospecific and bispecific synthetic chimeric T cell receptors for cancer therapy

Main
Adoptive immunotherapy with T cells expressing a chimeric antigen receptor (CAR) specific for B cell lineage antigens induces rapid regression of relapsed or refractory lymphoma, acute leukemia and multiple myeloma1,2,3,4,5,6. Despite high response rates, many patients relapse after CAR T cell treatment due to the outgrowth of tumor cells with low levels or complete loss of the target antigen2,3,4,5,6,7,8,9. Genomic analysis of tumors identified preexisting or emergent clones that evade CAR T cells because of biallelic loss of the gene encoding the target antigen, point mutations in the epitope or downregulation of antigen expression due to epigenetic silencing10,11. These findings illustrate the need for T cell therapies that are highly sensitive and specific for multiple antigens.
The CAR design was inspired by the understanding that T cell receptor (TCR) and costimulatory signals are required for full T cell activation12. Each TCR assembles with CD3δ, CD3ε, CD3γ and CD3ζ homodimers or heterodimers providing ten immunoreceptor tyrosine-based activation motifs (ITAMs)13,14. The first CAR fused a single-chain variable fragment (scFv) of a monoclonal antibody to the CD3ζ subunit, which has only three ITAMs15. Costimulation was added by incorporating one or more costimulatory domains into the receptor architecture16,17,18,19. After engaging the antigen, CAR T cells exhibit reduced phosphorylation of ZAP70 and linker for activation of T cells (LAT) compared to a TCR, which may contribute to their reduced antigen sensitivity20,21,22. Chimeric receptors that better engage the TCR apparatus have been designed to improve sensitivity23,24,25,26. The human leukocyte antigen (HLA)-independent TCR (HIT) and the synthetic T cell and antigen receptor (STAR) fuse the Vh and Vl chains of an antibody to the TCR constant α (TRAC) and β (TRBC) chains, respectively25,26. To reduce mispairing with endogenous TCR chains, previous studies inserted the HIT receptor transgene into the TRAC locus and designed a STAR that used mouse TCR constant chains containing an interchain disulfide bond to promote pairing (mutSTAR)25,26. T cells expressing the HIT and mutSTAR receptors were more sensitive for a single antigen than T cells expressing conventional CARs, but these approaches do not eliminate mispairing or competition for assembly with CD3 chains and would not target antigen-negative tumors.
We sought to develop a chimeric TCR (ChTCR) that could target two antigens with high sensitivity. We first constructed a monospecific receptor termed the ‘full ChTCR’ in which the scFv, rather than a Vh or Vl fragment, is fused to the TRAC chain while the TRBC chain is left void of an antigen-binding domain. Base editing was used to eliminate the expression of endogenous TRAC and TRBC chains and prevent mispairing with the ChTCR. T cells expressing the full ChTCR recognized lower levels of antigen than T cells expressing CD28/ζ or 4-1BB/ζ CARs, and the full ChTCR was superior to the mutSTAR and HIT receptors. The full ChTCR format also enabled bispecific antigen targeting by linking a second scFv specific for a different tumor antigen to the TRBC chain. Bispecific ChTCRs (Bi-ChTCRs) more effectively eliminated heterogeneous and antigen-low leukemia and multiple myeloma cells in vitro and in vivo compared to monospecific ChTCRs and bispecific CARs. The Bi-ChTCR design can be broadly applied for sensitive targeting of multiple pairs of antigens in B cell malignancies and multiple myeloma.
Results
ChTCRs recapitulate TCR structure, synapse and signaling
We designed two CD19-specific ChTCRs, a ‘split’ format in which the Vh and Vl fragments of the CD19-specific antibody (FMC63) were fused to the TRAC and TRBC chains of the TCR, respectively26, and a ‘full’ ChTCR format in which the scFv (Vl-linker-Vh) was fused to TRAC chain while TRBC chain was coexpressed but left void of a ligand-binding domain (Fig. 1a and Extended Data Fig. 1a). For comparison, we used clinically approved CD19-specific CD28/CD3ζ3 and 4-1BB/CD3ζ CARs2 (Fig. 1a and Extended Data Fig. 1a).

a, CD19-specific ChTCRs and CARs. Left to right—Split ChTCR, VhCα:FMC63 variable heavy chain-TCRα constant chain; VlCβ:FMC63 variable light chain-TCRβ constant chain. Full ChTCR, FMC63 VlVh-Cα:Cβ TCR. The ChTCRs are shown associated with CD3 subunits. 28z CAR, CD28ζ CAR with FMC63 VlVh scFv linked to the CD28 hinge/transmembrane (H/T) and costimulatory domain and CD3ζ. BBz CAR, BBζ CAR with FMC63 VlVh scFv linked to the IgG4 hinge, CD28 transmembrane domain, 4-1BB costimulatory domain and CD3ζ. b, Flow plots of CD8+ T cells stained with anti-TCRαβ antibody and rCD19 protein after transduction and endogenous TCRαβ KO. c, Geometric mean ± s.d. of rCD19-APC binding to T cells expressing the split or full ChTCR with and without KO of TRAC, TRBC or both chains (TRAC + TRBC) (n = 5 independent samples). d, Representative TCRαβ expression on unedited and TCRαβKO ChTCR+ and CAR+ T cells. e, Left: representative CD3ε expression on unedited and TCRαβKO ChTCR+ and CAR+ T cells. Right: geometric mean ± s.d. of CD3ε-BUV395 (n = 4 independent donors). f, Left: TIRF images of ChTCR+ and CAR+ T cells interacting with a lipid bilayer functionalized with ICAM-1-AF488 (green) and CD19-AF647 (blue) and stained with an anti-CD45-AF555 antibody. Scale bars, 10 μm. g, Normalized mean intensity of ICAM-1-AF488 (green) and CD19-AF647 (blue) staining across cell radiuses in synapses; dots represent the mean at each position, with a solid trend line (n = 100 cells). h, Left: calcium flux after antigen cross-linking of T cells expressing each specified receptor. Arrows indicate the cross-linking of receptors and the addition of phorbol myristate acetate/ionomycin (PMA/iono). Right: area under the curve of calcium flux over 300 s, mean ± s.d. (n = 4 independent experiments). i, Left: western blot of LAT pTyr220, actin and LAT after antigen activation of T cells expressing the indicated receptor. Separate blots were run for phosphorylated and total protein analytes. Membranes were cut and processed to detect analytes of different molecular weights in parallel. Actin loading controls are displayed adjacent to the corresponding analyte. Right: heat map of the mean band intensity of LAT pTyr220 normalized to actin control (n = 3 independent experiments; FC, fold change). j, Left: western blot of ZAP70 pTyr319, actin and ZAP70 after antigen activation of T cells expressing the indicated receptor. Right: heat map of the mean band intensity of ZAP70 pTyr319 normalized to actin control (n = 3 independent experiments). P values, where shown, were calculated using a two-way analysis of variance (ANOVA). Panel a created using BioRender.com.
Source data
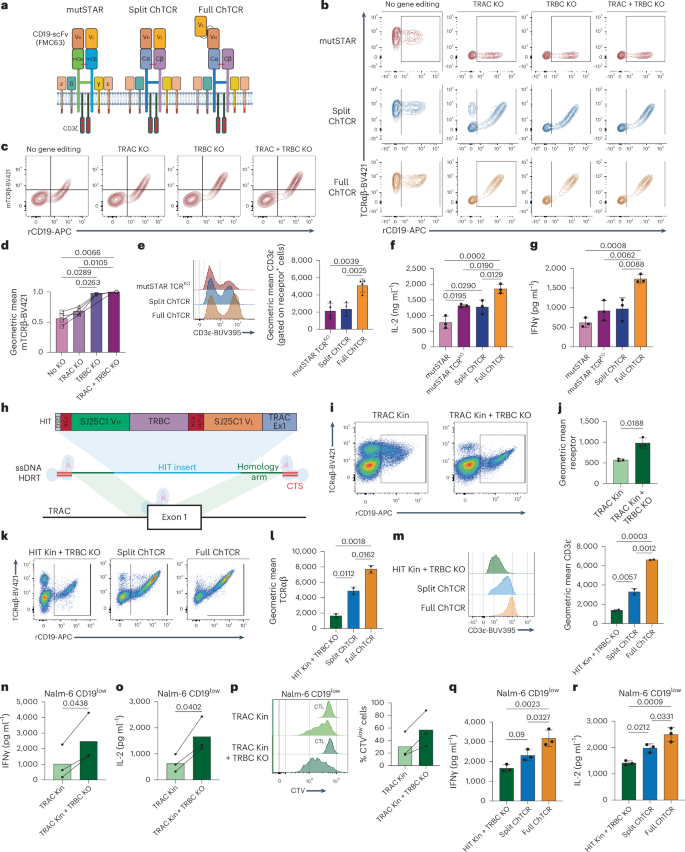
The split and full CD19-specific ChTCRs and the CARs were expressed in CD8+ T cells by lentiviral delivery, and cytosine base editors (CBEs) were used to knock out (KO) endogenous TCRαβ expression to prevent mispairing of ChTCR chains with endogenous TCR chains and competition for CD3 subunits (Extended Data Fig. 1b). TCR KO efficiency was greater than 90% and improved the expression level and frequency of split and full ChTCR+ T cells compared to no KO and single TRACKO or TRBCKO T cells (Fig. 1b,c and Extended Data Fig. 1c,d). Cell surface levels of ChTCRαβ and CD3ε were higher on full ChTCR+ T cells than on split ChTCR+ T cells, suggesting that the full format more efficiently assembled with CD3 chains and trafficked to the cell surface (Fig. 1d,e). Assembly of the ChTCR with all CD3 subunits was shown by linking ChTCRs to a hemagglutinin (HA) tag, immunoprecipitating with an anti-HA antibody and immunoblotting for individual CD3 subunits (Extended Data Fig. 2).
T cells form a well-organized synapse with a cognate peptide–MHC complex that amplifies and regulates signaling27,28. TCRs are concentrated in a central supramolecular complex (cSMAC) with adhesion molecules such as LFA-1 that binds ICAM-1 at the periphery of the synapse (pSMAC), with the CD45 phosphatase excluded to the distal SMAC. We examined immune synapses formed between ChTCR- or CAR-expressing T cells and soluble lipid bilayers (SLBs) containing fluorescently labeled CD19 and ICAM-1 using total internal reflection fluorescence (TIRF) microscopy. The synapses formed by CD28/ζ and 4-1BB/ζ CD19 CAR T cells were disorganized with CD19 and ICAM-1 intertwined across the synapse, as previously described29. In contrast, ChTCR T cells formed an organized cSMAC containing CD19 surrounded by a peripheral ring of ICAM-1 (Fig. 1f,g).
Many CARs tonically signal without binding the antigen, which can drive T cell exhaustion, limit persistence in vivo and increase toxicities30,31. To evaluate tonic signaling, we transduced Jurkat reporter cells with the split and full CD19 ChTCRs, 28/ζ and 4-1BB/ζ CARs, and an NY-ESO-1-specific TCR. A low frequency of cells expressing the TCR, 4-1BBζ CAR or either of the ChTCRs showed NFAT (nuclear factor of activated T cells) and NF-κB (nuclear factor-κB) activation, whereas a high frequency of cells expressing the 28ζ CAR activated NFAT and NF-κB in the absence of antigen (Extended Data Fig. 3a–c). We evaluated intracellular signaling in primary T cells expressing the CD19-specific ChTCRs and CARs, first by measuring calcium influx after cross-linking the receptors with the CD19 antigen. The split and full ChTCRs and the 28ζ CAR fluxed calcium with similar magnitudes, whereas calcium influx was barely detectable in T cells expressing the 4-1BBζ CAR (Fig. 1h). We then compared the phosphorylation of LAT and ZAP70 after antigen activation of CAR-, ChTCR- or TCR-expressing T cells. T cells expressing the split and full ChTCRs exhibited rapid phosphorylation of LAT Y220 and Y171 and ZAP70 Y319 at 1 min, matching the kinetics of the NY-ESO-1 TCR (Fig. 1i,j and Extended Data Fig. 3d). In contrast, T cells expressing the CARs showed less intense and a later peak in LAT and ZAP70 phosphorylation. Thus, both ChTCR formats assemble with all CD3 chains, form TCR-like synapses, lack tonic signaling and induce rapid antigen-specific signaling.
The CD19 full ChTCR has superior antigen sensitivity
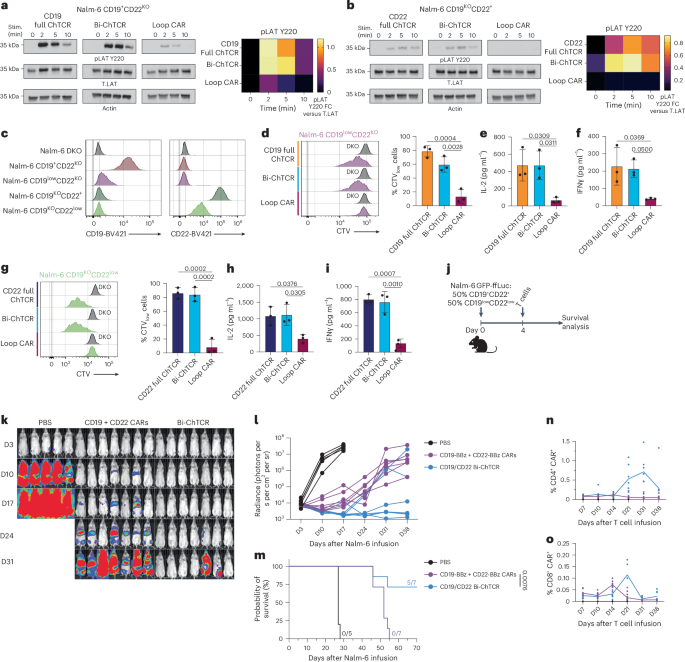
We flow-sorted CD8+ T cells for split and full ChTCR, CD28ζ CAR and 4-1BBζ CAR expression and tested their ability to recognize Nalm-6 cells expressing high, medium and low levels of CD19 (23,999, 2,619 and 230 molecules, respectively) (Fig. 2a). When cocultured with CD19high tumor cells, CD28ζ CAR T cells produced more interleukin-2 (IL-2) and interferon-γ (IFNγ) compared to 4-1BBζ CAR and ChTCR T cells (Fig. 2b,c). However, when cocultured with tumor cells expressing medium or low CD19 levels, split and full ChTCR T cells produced more IL-2 and IFNγ than 4-1BBζ and CD28ζ CAR T cells. Strikingly, T cells expressing the full ChTCR produced higher levels of IL-2 and IFNγ than T cells expressing the split ChTCR (Fig. 2b,c). Consistent with the cytokine data, ChTCR T cells proliferated more than CAR T cells when cocultured with CD19mid and CD19low tumor cells, and full ChTCR T cells proliferated more than split ChTCR T cells to the CD19low tumor (Fig. 2d). CD4+ T cells transduced with the full ChTCR also expressed higher levels of the ChTCR and CD3ε compared to those expressing the split ChTCR (Extended Data Fig. 4a–d), and produced more IL-2 and IFNγ in response to the CD19low tumor compared to split ChTCR T cells and 28ζ and 4-1BBζ CAR T cells (Extended Data Fig. 4e,f). Consistent with their superior recognition of the CD19low tumor, T cells expressing the full ChTCR exhibited more robust LAT phosphorylation compared to CAR+ and split ChTCR+ T cells following coculture with Nalm-6 CD19low cells (Fig. 2e). Thus, CD8+ and CD4+ T cells expressing ChTCRs more effectively recognized CD19low tumor cells compared to CAR T cells, and the full ChTCR was superior to the split ChTCR.
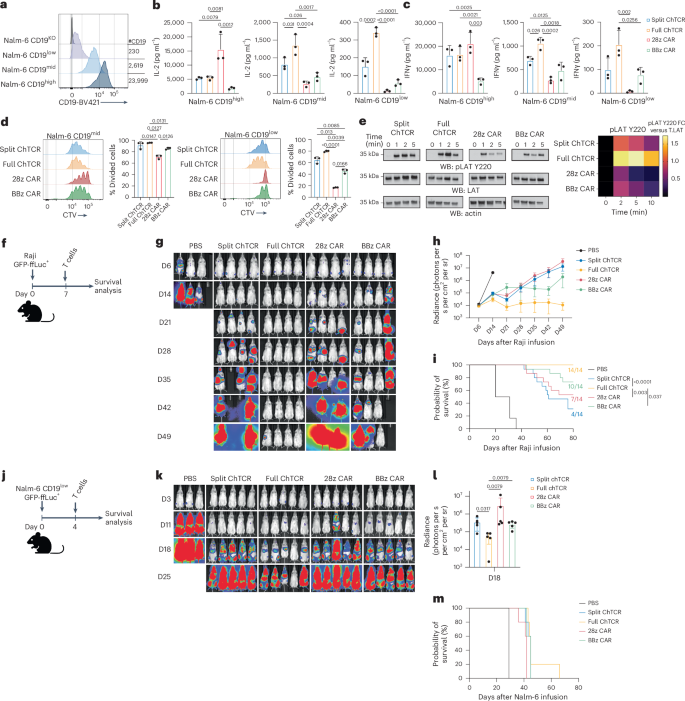
a, Flow histograms of CD19 expression in Nalm-6 cell variants. b, IL-2 concentration in supernatants after coculture of T cells expressing each indicated receptor with Nalm-6 CD19high, CD19mid and CD19low cells at a 1:1 E/T ratio. Data are shown as the mean ± s.d. for three independent experiments. P values were calculated using a two-way ANOVA. c, IFNγ concentration in supernatants for each experimental group described in b. Data are shown as the mean ± s.d. for three independent experiments. P values were calculated using a two-way ANOVA. d, Left: representative histograms of CTV dye dilution in T cells expressing the indicated receptors after coculture with Nalm-6 CD19mid and Nalm-6 CD19low tumor cells. Right: percentage of divided cells (mean ± s.d.) for three independent experiments. P values were calculated using a two-way ANOVA. e, Left: western blot (WB) of LAT pTyr220, actin and LAT after coculture of CD8+ T cells expressing each indicated receptor with Nalm-6 CD19low tumor cells. Right: heat map of the mean band intensity of LAT pTyr220 normalized to the total LAT control (n = 3 independent experiments). f, Schematic of the Raji GFP-ffLuc+ NSG mouse model. g, Representative bioluminescence images of Raji-ffLuc tumor burden in NSG mice treated with 2 × 10⁶ T cells expressing each indicated receptor (D, day). h, Tumor burden (mean ± s.d. radiance (photons per s per cm2 per steradian (sr))) of Raji GFP-ffLuc+ tumor-bearing NSG mice treated as in f (n = 3 mice per control group or 4 mice per treatment group; three independent experiments). i, Kaplan–Meier survival of Raji GFP-ffLuc+ tumor-bearing NSG mice treated as in f (n = 14 mice per treatment group). P values were calculated using a log-rank test. Ratios indicate mouse survival. j, Schematic of the Nalm-6 CD19low GFP-ffLuc+ NSG model. k, Representative bioluminescence images of Nalm-6 CD19low GFP-ffLuc+ tumor-bearing NSG mice treated with 2 × 10⁶ T cells expressing the indicated receptors (n = 5 mice per group). l, Tumor burden (mean ± s.d. radiance (photons per s per cm2 per sr)) 18 days after treatment (n = 5 mice per group). P values were calculated using a nonparametric Kruskal–Wallis test. m, Kaplan–Meier survival of NSG mice treated as described in j (n = 5 mice per group). Mouse icons in f and j created with BioRender.com.
Source data
In vivo antitumor activity of T cells expressing ChTCRs and CARs was compared by treating cohorts of NSG mice engrafted with Raji lymphoma (Fig. 2f). T cells expressing the full ChTCR quickly eradicated tumor cells in all treated mice and improved survival compared to mice treated with split ChTCR, CD28ζ or 4-1BBζ CAR T cells (Fig. 2g–i). We then tested the efficacy of ChTCR+ T cells in NSG mice engrafted with Nalm-6 CD19low cells that do not express CD80 and CD86 costimulatory ligands. Even with a low dose of T cells and the absence of any CD19high tumor cells to drive T cell proliferation in vivo, T cells expressing the full ChTCR exhibited superior antitumor activity early after infusion compared to T cells expressing the split ChTCR, CD28ζ CAR or 4-1BBζ CAR. However, the antitumor activity was transient and did not translate into improved survival over other treatment groups (Fig. 2j–m). These data show that CD19 ChTCRs are more sensitive in recognizing antigen-low tumor cells compared to conventional CARs and that the full ChTCR is the most effective receptor in vitro and in vivo.
TCR KO improves the expression and function of ChTCRs
We evaluated the expression and function of the full and split ChTCRs compared to the previously described mutSTAR and HIT receptors, which have a similar architecture to the split ChTCR. Unlike our approach, the strategies for expressing the HIT and mutSTAR in T cells did not eliminate the expression of both endogenous TCR chains. The mutSTAR used mouse TRAC and TRBC chains to facilitate preferential pairing of the transgenic TCR, and the HIT receptor was introduced by targeted knockin to the TRAC locus, thereby eliminating one of the two endogenous TCR chains. We constructed a CD19-specific mutSTAR composed of mouse TCR constant chains fused to Vl and Vh of FMC63 (refs. 25,32) (Fig. 3a) and expressed the mutSTAR, split ChTCR and full ChTCR in primary T cells, either without TCR KO as originally described25,32, with TRAC KO or TRBC KO only, or with KO of both TCR chains. As observed previously, the expression of the full and split ChTCRs was higher in T cells with KO of both TCR chains (Fig. 1c). The mutSTAR was expressed on the cell surface in T cells without TCR KO, consistent with prior data25,32 (Fig. 3b). However, the level of mutSTAR expression determined by staining of the mouse TCRβ and binding to recombinant CD19 protein was significantly higher with KO of both endogenous TCR chains to eliminate competition for CD3 subunits (Fig. 3c,d). MutSTAR TCRKO T cells expressed similar surface levels of CD3ε as split ChTCR T cells, but both had lower levels of CD3ε than full ChTCR T cells (Fig. 3e). Higher expression of mutSTAR achieved with TCRαβ KO resulted in superior antigen sensitivity in response to the CD19low tumor compared to the non-TCRKO T cells, although sensitivity was still inferior to TCRαβKO cells expressing the full ChTCR (Fig. 3f,g). We also expressed the HIT receptor using a CRISPR–Cas9-mediated targeted insertion within the TRAC locus, with or without concomitant TRBC KO (Fig. 3h). The frequency of HIT+ T cells and the expression level of the HIT receptor were increased when targeted integration was combined with TRBC KO (Fig. 3i,j). HIT TCRKO T cells showed lower TCRαβ and CD3ε levels than both split and full ChTCR T cells (Fig. 3k–m), suggesting that receptor expression with targeted knockin to the TRAC locus is inferior to that achieved by lentiviral delivery, although we cannot exclude potential effects of a different scFv. Higher expression of HIT receptors achieved with TCRαβ KO resulted in superior antigen sensitivity in response to CD19low tumor cells compared to the non-TCRKO T cells (Fig. 3n–p), although sensitivity was still inferior to TCRαβKO cells expressing the full ChTCR constructed with FMC63 (Fig. 3q,r). These data demonstrate the importance of editing both endogenous TCR chains to achieve high-level expression of HLA-independent ChTCRs.
a, CD19-specific mutSTAR, split ChTCR and full ChTCR. b, Flow plots of mutSTAR and ChTCR T cells stained with TCRαβ-BV421 and rCD19-APC without TCR KO and after TRAC KO, TRBC KO or both TRAC and TRBC KO. c, Flow plots of mutSTAR T cells stained with mouse TCRβ-BV421 and rCD19-APC without or with KO of the indicated TCR chain. d, Geometric mean of mouse TCRβ-BV421 in T cells transduced with mutSTAR without or with KO of the indicated TCR chain. Data are shown as the mean ± s.d. for four independent experiments. e, Left: flow cytometry of TCRKO T cells expressing the mutSTAR, split ChTCR and full ChTCR stained with CD3ε-BUV395 antibody. Right: geometric mean of CD3ε on TCRKO T cells expressing the mutSTAR, split ChTCR and full ChTCR. Data are shown as the mean ± s.d. for three independent experiments. f,g, IL-2 (f) and IFNγ (g) concentrations in supernatants after coculture of T cells with Nalm-6 CD19low target cells at an E/T of 1:1. Data are shown as the mean ± s.d. for three independent experiments. h, Schematic of CD19-specific HIT receptor and targeted knockin to the TRAC locus. i, Flow cytometry of TRAC knocked-in (Kin) HIT T cells stained with TCRαβ-BV421 and rCD19-APC with or without TRBC KO. j, Geometric mean of rCD19-APC binding to HIT-expressing T cells with or without TRBC KO. The mean ± s.d. for three independent experiments is shown. k, Flow plots of T cells expressing the HIT receptor, with TRAC Kin and TRBC KO, split ChTCR or full ChTCR, with TRAC/TRBC KO, stained with TCRαβ-BV421 and rCD19-APC. l, Geometric mean of TCRαβ-BV421 in TCRKO T cells, KO as described in k, expressing the HIT receptor, split ChTCR or full ChTCR. The mean ± s.d. for three independent experiments is shown. m, Flow cytometry histograms (left) and geometric mean (right) of CD3ε-BUV395 in TCRKO T cells, KO as described in k, expressing the HIT receptor, split ChTCR or full ChTCR. The mean ± s.d. for three independent experiments is shown. n,o, IFNγ (n) and IL-2 (o) concentrations in supernatants after coculture of T cells expressing the HIT receptor with or without TRBC KO with Nalm-6 CD19low cells at an E/T of 1:1. The mean for three independent experiments is shown. p, Left: histograms of CTV dye dilution in T cells expressing the HIT receptor with and without TRBC KO after coculture with Nalm-6 CD19low tumor cells. Right: percentage of divided cells (mean) for three independent experiments. q,r, IFNγ (q) and IL-2 (r) concentrations in supernatants after coculture of TCRKO T cells expressing the HIT receptor, split ChTCR or full ChTCR with Nalm-6 CD19low cells at an E/T of 1:1. The mean ± s.d. for three independent experiments is shown. P values, where shown, were calculated using a two-way ANOVA. Panels a,h created using BioRender.com.
Source data
Design of a sensitive CD22 monospecific ChTCR
The unoccupied TRBC chain in the CD19-specific full ChTCR could allow the targeting of a second antigen by fusing an scFv of different specificity to TRBC chain. Bispecific targeting of CD19 and CD22 is of clinical interest because CD19- and CD22-negative or -low relapses occur after monospecific therapies targeting these antigens7,33. Unfortunately, a CD19/CD22 bispecific CAR, termed the ‘Loop’ CAR, demonstrated compromised sensitivity to each antigen compared to the respective monospecific CARs, and patients treated with the Loop CAR relapsed with CD19low–negCD22+ tumor cells7. We sought to determine whether the ChTCR platform could provide an effective bispecific CD19/CD22 receptor.
We first evaluated CD22 monospecific ChTCRs by fusing the m971 or 9A8 scFv to TRBC chain34. ChTCRs were constructed in both Vh/Vl and Vl/Vh orientations, expressed in TRBC- and TRAC-edited T cells and compared to 4-1BBζ CARs constructed with the same scFvs (Fig. 4a). T cells expressing all constructs bound soluble recombinant CD22, with the m971 CAR and ChTCR showing a higher mean fluorescence intensity of CD22 binding than observed with 9A8 (Fig. 4b,c). However, m971 ChTCR+ T cells produced less IL-2 and IFNγ and proliferated poorly to Nalm-6 wild-type (WT) cells compared to T cells expressing the 9A8 ChTCR; neither m971 nor 9A8 ChTCR T cells responded to Nalm-6 CD22KO cells (Fig. 4d–f and Extended Data Fig. 5a). CAR T cells constructed with each scFv recognized Nalm-6 WT cells, with m971 CAR T cells producing higher cytokine levels and proliferating better than 9A8 CAR T cells (Fig. 4d–f). In the same experiment, a ChTCR in which the m971 scFv was fused in the Vl/Vh or Vh/Vl orientation to the TRAC chain also bound soluble CD22 but did not function against CD22+ tumor cells (Extended Data Fig. 5b–f). The discrepancy between the binding of soluble CD22 by the m971 and 9A8 ChTCRs and the function in response to the tumor suggested that the m971 epitope on membrane-bound CD22 is less accessible to a ChTCR. This was supported by an analysis of synapse formation. 9A8 ChTCR T cells formed a synapse with CD22 localized to the center surrounded by ICAM-1, whereas m971 ChTCR T cells showed minimal CD22 accumulation in the synapse (Fig. 4g–i).
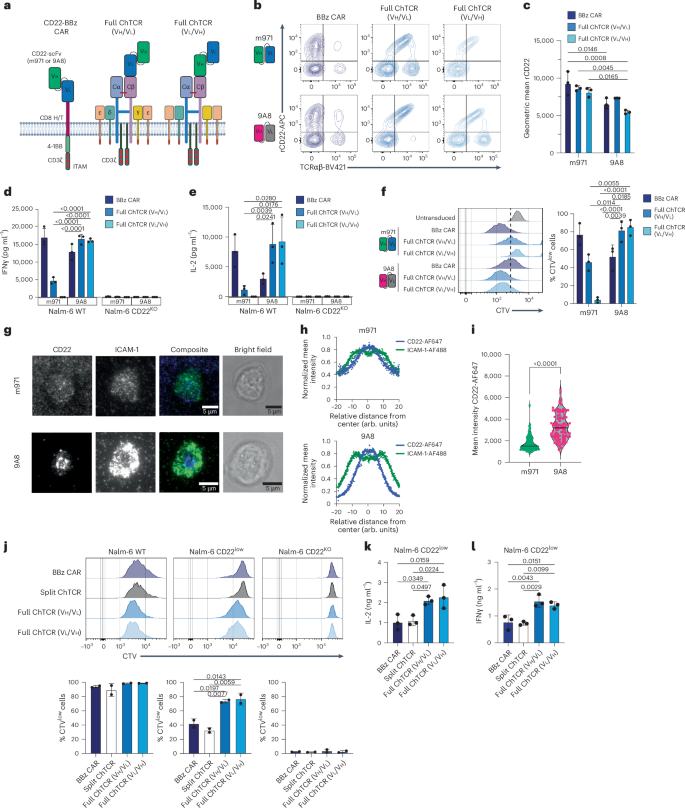
a, CD22-specific receptors. CD22 BBζ CAR, anti-CD22 scFV Vh–Vl (m971 or 9A8), CD8 hinge/transmembrane domain, 4-1BB costimulatory domain and CD3ζ; CD22 full ChTCRs, m971 or 9A8 (Vh/Vl or Vl/Vh orientation) linked to TRBC chain. Panel a created using BioRender.com. b, Representative flow plots of CD8+ T cells stained with anti-TCRαβ and rCD22-APC after transduction and TCRαβ KO. Top row: T cells expressing the m971 CAR and ChTCRs. Bottom row: T cells expressing the 9A8 CAR and ChTCRs. c, Geometric mean ± s.d. of rCD22-APC binding to 9A8 and m971 CAR and ChTCR T cells. Data are shown for three independent donors. P values were calculated using a two-way ANOVA. d,e, IFNγ (d) and IL-2 (e) concentrations in supernatants after coculture of T cells expressing each indicated receptor with Nalm-6 WT or Nalm-6 CD22KO cells. Data are shown as the mean ± s.d. for n = 3 independent donors. P values were calculated using a two-way ANOVA. f, Left: representative histograms of CTV dilution measured after coculture of the indicated T cells with Nalm-6 cells. Right: frequency of divided cells. Data are shown as the mean ± s.d. for n = 3 independent donors. P values were calculated using a two-way ANOVA. g, Representative TIRF microscopy images (n = 100 cells) of CD22 ChTCR T cells constructed with the m971 scFv (top) or 9A8 scFv (bottom) interacting with a lipid bilayer functionalized with ICAM-1 (green) and CD22 (blue); the corresponding brightfield images are shown. Scale bars, 5 μm. h, Normalized mean intensity of ICAM-1-AF488 and CD22-AF647 staining across cell radiuses in synapses for the samples shown in g; dots represent the mean at each position, with a trend line (n = 100 cells). i, Mean intensity of CD22-AF647 within the synapse of 100 T cells expressing m971 or 9A8 ChTCRs. P value was calculated using a two-tailed t test. j, Top: representative flow histograms of CTV dilution (n = 3 independent experiments) measured after coculture of T cells expressing the indicated receptors with Nalm-6 cells expressing different levels of CD22 or with CD22 KO. Bottom: frequency of divided cells in each group. The mean ± s.d. for n = 3 independent donors is shown. P values were calculated using a two-way ANOVA. k,l, IL-2 (k) and IFNγ (l) concentrations in supernatants after coculture with Nalm-6 CD22low cells. The mean ± s.d. for n = 3 independent experiments is shown. P values were calculated using a two-way ANOVA.
Source data
We next compared antigen binding and sensitivity between T cells expressing the split and full 9A8 ChTCRs and T cells expressing a 9A8 4-1BBζ CAR (Extended Data Fig. 6a). CD22 binding to T cells expressing the full ChTCR (VhVl and VlVh) and 4-1BBζ CAR was similar to and higher than that observed in T cells expressing the split ChTCR (Extended Data Fig. 6b,c). T cells expressing the full ChTCR also showed higher TCRαβ expression than T cells expressing the split ChTCR (Extended Data Fig. 6d). To evaluate antigen sensitivity, we used Nalm-6 CD22WT (11,912 molecules per cell) and CD22low cell lines (959 molecules per cell) as target cells (Extended Data Fig. 6e). T cells expressing the full and split ChTCRs and the 4-1BBζ CAR proliferated similarly after coculture with Nalm-6 WT cells (Fig. 4j). However, full ChTCR T cells demonstrated greater proliferation than split ChTCR and CAR T cells after coculture with Nalm-6 CD22low cells and produced more IL-2 and IFNγ (Fig. 4k,l). Because CD28ζ CAR T cells have higher antigen sensitivity than 4-1BBζ CAR T cells in some contexts35,36, we evaluated T cells transduced with a CD28ζ CAR designed with the 9A8 scFv. CD28ζ CAR T cells produced lower levels of cytokines after coculture with Nalm-6 CD22low cells than 4-1BBζ CAR T and ChTCR+ T cells (Extended Data Fig. 6f–h). These findings demonstrate that the CD22 full ChTCR provides better recognition of CD22low tumor cells than the CD22 split ChTCR, CD28ζ CAR and 4-1BBζ CAR, and provides a rationale to evaluate a bispecific CD19/CD22 ChTCR.
Design of a bispecific CD19/CD22 ChTCR
We fused the CD19-specific FMC63 scFv to TRAC chain in a Vh/Vl orientation and the CD22-specific 9A8 scFv to TRBC chain in a Vl/Vh orientation and transduced TCRKO CD8+ T cells (Fig. 5a and Extended Data Fig. 7a). For comparison, T cells were transduced with the CD19 monospecific 4-1BBζ CAR, the CD22 monospecific 4-1BBζ CAR using the m971 scFv, and the Loop CAR33,34 (Fig. 5a,b). The mean fluorescence intensity of rCD19 and rCD22 binding was superior for T cells expressing the Bi-ChTCR compared to T cells expressing the Loop CAR (Fig. 5b–d). Bi-ChTCR and monospecific CD19 and CD22 4-1BBζ CAR T cells exhibited minimal antigen-independent activation of NFAT, NF-κB and AP-1, whereas Loop CAR T cells exhibited high antigen-independent activation (Extended Data Fig. 7b–d). The Bi-ChTCR formed an organized synapse, with CD22 taking a more central position than CD19 in the cSMAC (Fig. 5e).
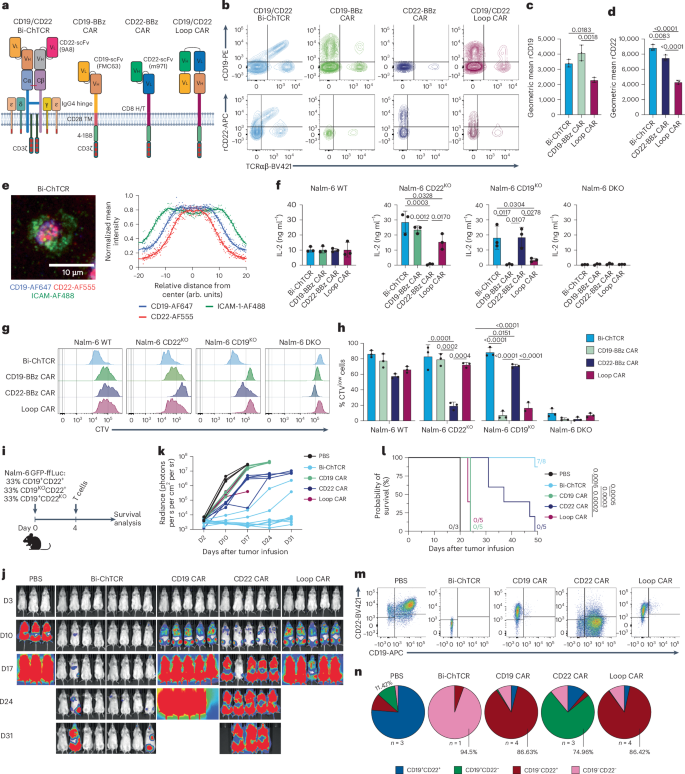
a, Bispecific CD19/CD22 ChTCR, monospecific CD19 and CD22 4-1BB/CD3ζ CARs, and a bispecific CD19/CD22 CAR7. The CD19-specific FMC63 scFv and the CD22-specific 9A8 scFv were used for the Bi-ChTCR; FMC63 and m971 scFvs were used in all CARs. Image created using BioRender.com. b, Flow plots of transduced and TCRαβKO CD8+ T cells stained with anti-TCRαβ and rCD19 (top) or rCD22 (bottom). c,d, Geometric mean ± s.d. of rCD19-PE (c) or rCD22-APC (d) binding to T cells expressing the indicated receptors (n = 3 independent experiments). P values were calculated using a two-way ANOVA. e, Left: TIRF microscopy of CD19/CD22 Bi-ChTCR T cells interacting with a lipid bilayer functionalized with ICAM-1-AF488 (green), CD19-AF647 (blue) and CD22-AF555 (red). Scale bar, 10 μm. Right: normalized mean intensity of ICAM-1-AF488, CD19-AF647 and CD22-AF555 staining across cell radiuses in synapses. Dots represent the mean at each position, with a trend line (n = 100 cells). f, IL-2 concentration in supernatants after coculture of T cells expressing the indicated receptors with Nalm-6 WT, Nalm-6 CD22KO, Nalm-6 CD19KO and Nalm-6 DKO cells. Data are shown as the mean ± s.d. for T cells from three independent healthy donors. P values were calculated using a two-way ANOVA. g, Flow histograms of CTV dilution after coculture of T cells expressing the indicated receptors with Nalm-6 cells expressing CD19 and CD22 or with KO for one or both targets. h, Frequency of divided T cells (CTVlow cells) expressing the indicated receptors. Data are shown as the mean ± s.d. from three independent donors. P values were calculated using a two-way ANOVA. i, Schematic of the NSG mouse model. Mouse icon created with BioRender.com. j, Representative bioluminescence images of Nalm-6 GFP-ffLuc+ tumor-bearing mice treated with 2 × 10⁶ T cells expressing the indicated CARs or the Bi-ChTCR. k, Tumor burden (mean ± s.d. radiance (photons per s per cm2 per sr)) in each treatment group (n = 3 mice per control group, 5 mice per CAR treatment group and 8 mice in the Bi-ChTCR treatment group). l, Kaplan–Meier survival of mice treated with CARs or Bi-ChTCRs (n = 3–8). P values were calculated using a log-rank test m,n, Flow plots (m) and pie charts (n) showing CD19 and CD22 expression on Nalm-6 GFP-ffLuc+ tumor cells collected from the bone marrow at killing, for each treatment group (n = 1–4 mice per group as indicated in the figure).
Source data
We tested the T cell recognition of WT Nalm-6 cells and Nalm-6 cells expressing only CD19 (Nalm-6 CD22KO), only CD22 (Nalm-6 CD19KO) or neither CD19 nor CD22 (Nalm-6 double KO (DKO)) (Extended Data Fig. 7e). Bi-ChTCR T cells demonstrated robust proliferation and cytokine production in response to Nalm-6 WT cells and Nalm-6 cells expressing only CD19 or CD22 (Fig. 5f–h and Extended Data Fig. 7f). In contrast, Loop CAR T cells showed reduced functions when cocultured with CD19KO cells compared to Nalm-6 WT or CD22KO cells, and CD19 and CD22 monospecific CAR T cells responded only to tumor cells expressing their cognate antigen (Fig. 5f–h and Extended Data Fig. 7f). T cells expressing the Bi-ChTCR lysed Nalm-6 WT, Nalm-6 CD22KO and Nalm-6 CD19KO cells, whereas T cells expressing the Loop CAR lysed Nalm-6 CD22KO cells but lysed Nalm-6 CD19KO target cells poorly (Extended Data Fig. 7g). Monospecific CAR T cells failed to recognize Nalm-6 cells lacking the cognate antigen (Extended Data Fig. 7g).
We next evaluated in vivo therapy of a tumor inoculum with heterogeneous antigen expression. NSG mice were engrafted with an equal mixture of Nalm-6 WT (CD19+/CD22+), Nalm-6 CD19KO/CD22+ and Nalm-6 CD19+/CD22KO cells (Fig. 5i). Mice treated with Bi-ChTCR T cells showed improved tumor clearance and survival compared to mice treated with monospecific CAR or bispecific Loop CAR T cells (Fig. 5j–l). In control (untreated) mice, tumor cells collected at killing were predominantly CD19+CD22+ with a smaller frequency of CD19+CD22− and CD19−CD22+ cells than in the initial tumor inoculum, illustrating a proliferative advantage for Nalm-6 WT tumor cells. Mice that received CD19 CAR or Loop CAR T cells relapsed with predominantly CD19−CD22+ tumor cells and minor populations of CD19lowCD22+ and CD19−CD22− tumor cells. In CD22 CAR T cell-treated mice, the persisting tumor was predominantly CD19+CD22− with a small frequency of CD19+CD22+/low and CD19−CD22− cells (Fig. 5m,n). Analysis of one mouse with a progressive tumor in the Bi-ChTCR T cell-treated group showed that tumor cells were predominantly CD19−CD22− with a small fraction of CD19−CD22low cells. Thus, the heterogeneity in antigen expression that limits the antitumor activity of monospecific and bispecific CAR T cells can be overcome with Bi-ChTCR T cells.
Bi-ChTCR T cells maintain sensitivity to each antigen
The sensitivity of the Bi-ChTCR for each antigen was evaluated by signaling and functional assays. LAT phosphorylation was comparable in intensity and kinetics between the Bi-ChTCR and the monospecific CD19 or CD22 full ChTCRs and the weakest with the Loop CAR (Fig. 6a,b). We compared the T cell recognition of Nalm-6 CD22KO cells expressing low levels of CD19 and Nalm-6 CD19KO cells expressing low levels of CD22 (Fig. 6c). CD19/CD22 Bi-ChTCR T cells exhibited strong proliferation and cytokine production against both CD22KOCD19low and CD22lowCD19KO tumor cells (Fig. 6d–i), equivalent to T cells expressing the monospecific CD19 and CD22 full ChTCRs and superior to T cells expressing the Loop CAR.
a,b, Left: western blot of LAT pTyr220, actin and LAT in T cells expressing the indicated receptors after stimulation (Stim.) with Nalm-6 CD19+CD22KO (a) or Nalm-6 CD19KOCD22+ (b) cells. Right, heat map of the mean band intensity of LAT pTyr220 normalized to LAT (n = 3 independent experiments). c, Flow plots depicting CD19 and CD22 expression levels on Nalm-6 cells after gene KO. d, Left: flow histograms of CTV dilution measured after coculture with Nalm-6 CD19KOCD22KO (DKO, control) or Nalm-6 CD19lowCD22KO cells. Right: frequency of divided cells (CTVlow cells) after coculture with Nalm-6 CD19lowCD22KO cells (mean ± s.d.) (n = 3 independent donors). P values were calculated using a two-way ANOVA. e,f, IL-2 (e) and IFNγ (f) concentrations in supernatants after coculture with Nalm-6 CD19lowCD22KO cells (mean ± s.d.) (n = 3 independent donors). P values were calculated using a two-way ANOVA. g, Left: flow histograms of CTV dilution after coculture with Nalm-6 DKO cells or Nalm-6 CD19KOCD22low cells. Right: frequency of divided cells (CTVlow cells) after coculture with Nalm-6 CD19KOCD22low cells (mean ± s.d.) (n = 3 independent donors). P values were calculated using a two-way ANOVA. h,i, IL-2 (h) and IFNγ (i) concentrations in supernatants after coculture with Nalm-6 CD19KOCD22low cells (mean ± s.d.) (n = 3 independent donors). P values were calculated using a two-way ANOVA. j, Schematic of NSG mice engrafted with a mixture of CD19+CD22+ and CD19lowCD22low Nalm-6 GFP-ffLuc+ cells and treated with 2 × 10⁶ T cells expressing CD19 and CD22 BBζ CARs (1:1 ratio) or the CD19/CD22 Bi-ChTCR. Mouse icon created with BioRender.com. k, Representative bioluminescence images of Nalm-6 GFP-ffLuc+ tumor-bearing mice. l, Tumor burden (mean ± s.d. radiance (photons per s per cm2 per sr)) of tumor-bearing mice (n = 5 mice in the control group and 7 mice per treatment group). m, Kaplan–Meier survival of Nalm-6 GFP-ffLuc+ tumor-bearing NSG mice. P value was calculated using a log-rank test. n,o, Frequencies of CD4+ (n) and CD8+ (o) T cells expressing the CARs or Bi-ChTCR in the blood at the indicated time points (n = 7 mice per treatment group, % of live+lymphocyte+).
Source data
We evaluated the in vivo efficacy of Bi-ChTCR T cells against a tumor inoculum composed of Nalm-6 cells expressing high and low levels of CD19 and CD22 (Fig. 6j). Because monospecific and bispecific CAR T cells failed to control heterogeneous tumors with high antigen levels (Fig. 5i–n), we compared Bi-ChTCR T cells to CD19 and CD22 4-1BBζ CAR T cells co-infused at a 1:1 ratio34,37. Bi-ChTCR T cells showed superior antitumor activity and improved mouse survival compared to mice treated with the mixed CD19 and CD22 BBζ CAR T cell product (Fig. 6k–m), and efficacy correlated with greater expansion of CD4+ and CD8+ ChTCR+ T cells in the blood (Fig. 6n,o). Notably, the Bi-ChTCR T cells were more effective against a tumor inoculum containing CD19lowCD22low Nalm-6 and Nalm-6 WT cells than the monospecific CD19 full ChTCR T cells were for CD19low Nalm-6 cells. It is possible that Nalm-6 WT cells drove greater proliferation of the Bi-ChTCR T cells or that the higher density of CD22 on CD22low Nalm-6 cells contributed to better efficacy. These nuances notwithstanding, the data show that Bi-ChTCR T cells maintain superior antigen sensitivity against each target antigen in vitro and are more effective than the two CAR T cell products in eliminating tumors with heterogeneous and low antigen levels.
Bi-ChTCR specific for multiple myeloma antigens
To determine whether the Bi-ChTCR architecture could be used to target two multiple myeloma antigens, we designed BCMA/SLAMF7 Bi-ChTCRs. We tested different guide RNAs to delete the expression of SLAMF7 and avoid potential fratricide as SLAMF7 is expressed on some T cells38 (Extended Data Fig. 8a). Simultaneous editing of SLAMF7 and TCRαβ was highly efficient in primary T cells (Extended Data Fig. 8b,c). We then transduced T cells with monospecific split and full ChTCRs using the HuLuc63 (anti-SLAMF7) scFv and compared the antigen sensitivity of flow-sorted ChTCR+ T cells using titrations of plate-bound antigen (Extended Data Fig. 8d). Similar to the CD19 and CD22 data, the surface expression and antigen sensitivity of the SLAMF7 full ChTCR were superior to those of the split ChTCR (Extended Data Fig. 8e–h). Split and full monospecific BCMA ChTCRs were also constructed with the C11D5.3 scFv. In this case, the split ChTCR showed higher expression and improved sensitivity over the full ChTCR, illustrating the need to compare the split and full formats for individual scFvs (Extended Data Fig. 8i–m). The BCMA full ChTCR still showed robust reactivity and was used in the design of BCMA/SLAMF7 Bi-ChTCRs.
We designed four BCMA/SLAMF7 Bi-ChTCR formats and expressed each in TCRKO Jurkat cells (Extended Data Fig. 9a). All four Bi-ChTCRs restored the cell surface expression of CD3ε and were expressed at similar levels, as measured by the binding of rBCMA and rSLAMF7 (Extended Data Fig. 9b–e). We proceeded with an analysis of format 1 as the Vh/Vl orientation provided a direct comparison to previously designed BCMA and SLAMF7 CARs (Fig. 7a and Extended Data Fig. 10a). The BCMA/SLAMF7 Bi-ChTCR and monospecific BCMA and SLAMF7 CARs were expressed in T cells with CBE-mediated KO of endogenous TRAC, TRBC and SLAMF7 (ref. 38). Gene-edited SLAMF7 and BCMA/SLAMF7 Bi-ChTCR T cells expanded in culture and had the same expansion as BCMA CAR T cells (Extended Data Fig. 10b). Binding of soluble BCMA and SLAMF7 was significantly higher for T cells transduced with the monospecific CARs compared to the Bi-ChTCR (Fig. 7b–d). However, Bi-ChTCR T cells exhibited more rapid and intense phosphorylation of ZAP70 compared to monospecific BCMA and SLAMF7 CAR T cells (Fig. 7e,f) and produced higher amounts of IFNγ when cultured with titrated levels of the plate-bound antigen (Extended Data Fig. 10c,d). BCMA/SLAMF7 Bi-ChTCR T cells recognized INA-6 multiple myeloma cells expressing both BCMA and SLAMF7, as well as INA-6 cells engineered to express only a single antigen, whereas monospecific CAR T cells recognized only INA-6 cells that expressed their cognate antigen (Fig. 7g–i). We compared expression and signaling between BCMA/SLAMF7 Bi-ChTCR T cells and T cells expressing a previously described BCMA/SLAMF7 bispecific CAR39. We observed superior binding of BCMA and SLAMF7 to the Bi-ChTCR compared to the bispecific CAR (Extended Data Fig. 10e–g), and Bi-ChTCR T cells exhibited more rapid and intense ZAP70 phosphorylation after stimulation with bead-coated BCMA and SLAMF7 antigens, alone or together (Extended Data Fig. 10h,i).
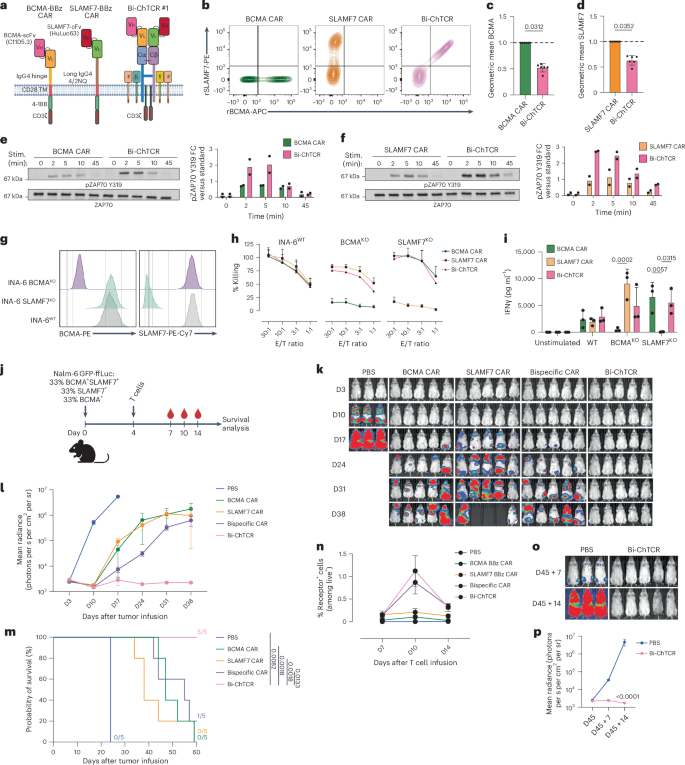
a, BCMA and SLAMF7 CARs and Bi-ChTCR. The BCMA BBζ CAR has the C11D5.3 scFV Vh–Vl linked to an IgG4 hinge, CD28 transmembrane domain, 4-1BB and CD3ζ. The SLAMF7 BBζ CAR has the HuLuc63 Vh–Vl linked to a long IgG4 4/2NQ hinge, CD28 transmembrane domain, 4-1BB and CD3ζ. The BCMA/SLAMF7 Bi-ChTCR has the C11D5.3 scFV Vh–Vl fused to TRAC chain and the HuLuc63 Vh–Vl fused to TRBC chain. b, Flow plots of transduced, TCRαβKO and SLAMF7KO T cells stained with rSLAMF7-PE and rBCMA-APC. c,d, Normalized geometric mean ± s.d. of binding of rBCMA-APC (c) or rSLAMF7-PE (d) to T cells expressing each CAR or the Bi-ChTCR. Data are shown for six independent experiments. P values were calculated using a paired t test. e,f, Left: western blot of lysates from BCMA CAR and Bi-ChTCR (e) or SLAMF7 CAR and Bi-ChTCR (f) T cells cross-linked with antigen-coated beads for ZAP70 pTyr319 and ZAP70. Right: FC in the mean intensity of ZAP70 pTyr319 normalized to total ZAP70 per stimulation time point (n = 2 independent experiments). g, Flow histograms of BCMA (left) and SLAMF7 (right) expression in INA-6 WT, INA-6 SLAMF7KO and INA-6 BCMAKO cells. h, Cytotoxicity of CAR or Bi-ChTCR T cells against the indicated INA-6 cells measured by Cr51 release assay. Data are shown as the mean ± s.d. for three independent experiments. i, IFNγ concentration in supernatants after overnight coculture of T cells expressing the indicated receptors with WT and single-antigen KO INA-6 cells. The mean ± s.d. for three independent experiments is shown. P values were calculated using a two-way ANOVA. j, NSG mice engrafted with Nalm-6 cells heterogeneous for BCMA and SLAMF7 expression and treated with 2 × 10⁶ CAR or ChTCR T cells. Mouse icon created with BioRender.com. k, Bioluminescence imaging of mice in each treatment group. l, Mean ± s.d. radiance (photons per s per cm2 per sr) for each treatment group (n = 3 mice in the control group and 5 mice per treatment group). m, Kaplan–Meier survival of mice in each treatment group. P values were calculated using a log-rank test. n, Frequencies of CAR+ and Bi-ChTCR+ T cells in the blood at the indicated time points (n = 3 mice in the control group and 5 mice per treatment group) (% of live+lymphocyte+). o, Bioluminescence images of mice rechallenged with a mixture of BCMA+SLAMF7+, BCMA−SLAMF7+ and BCMA+SLAMF7− Nalm-6 GFP-ffLuc cells 45 days after the initial tumor infusion. p, Mean of Nalm-6 GFP-ffLuc tumor burden after rechallenge in the new control group or mice previously treated with Bi-ChTCR T cells (mean radiance ± s.d.) (photons per s per cm2 per sr) (n = 3 mice in the control group and 5 mice in the Bi-ChTCR group). P value was calculated using a two-way ANOVA.
Source data
We then asked whether BCMA/SLAMF7 Bi-ChTCR+ T cells could eliminate a tumor inoculum that was heterogeneous for BCMA and SLAMF7 expression (Fig. 7j). Bi-ChTCR+ T cells rapidly eliminated tumors in all mice and improved survival compared to bispecific CAR+ T cells and each monospecific CAR+ T cell product (Fig. 7k–m). Bi-ChTCR T cells demonstrated superior expansion in the blood compared to cells in all other treatment groups, despite the absence of a costimulatory domain in the receptor (Fig. 7n). We rechallenged mice that were tumor-free after the administration of the Bi-ChTCR with the same tumor mixture. Control mice quickly developed tumors, whereas all mice from the Bi-ChTCR-treated group were protected from tumor challenge (Fig. 7o,p). These data extend the utility of Bi-ChTCRs for sensitive targeting of two multiple myeloma antigens.
Discussion
The outgrowth of tumor cells with downregulated or lost target antigen expression is a major mechanism for the failure of CAR T cells6,7,10,11,40,41. Improving efficacy requires the development of receptors that are both highly sensitive and capable of recognizing multiple tumor antigens. Bispecific CARs often have reduced sensitivity for each antigen, enabling the escape of tumor cells expressing low antigen levels7,42. Here, we describe ChTCRs that simultaneously target two tumor antigens with high sensitivity.
The concept of linking an antigen-binding domain to the TCR to improve sensitivity is not new; however, as shown here for the mutSTAR and HIT receptors, mispairing of ChTCR chains with endogenous TCR chains and competition for CD3 molecules compromise cell surface expression and sensitivity24,25,26,43,44. We used base editing to disrupt endogenous TRAC and TRBC expression without inducing double-strand DNA breaks, which can lead to chromosome losses, translocations and/or recombinations45,46. Base editing can disrupt the expression of multiple genes in T cells with high efficiency and is being used for editing T cells in clinical trials47. Our data show that eliminating endogenous TCR chains was required for optimal expression of split and full ChTCRs and improved both the cell surface expression and sensitivity of HLA-independent mutSTAR and HIT receptors. The monospecific full ChTCR, in which an scFv is linked to a single TCR constant chain, demonstrated higher surface expression and superior antigen sensitivity in vitro and antitumor activity in vivo compared to the split ChTCR for CD19, CD22 and SLAMF7 antigens. When the expression of the full ChTCR was lower, as in the BCMA ChTCR, antigen sensitivity was reduced. Modeling of ChTCRs alone and bound to target antigens may help elucidate why the full ChTCR structure is generally superior to split formats and could facilitate scFv selection for new targets48.
ChTCRs assemble with all CD3 subunits, providing diversity in ITAM sequences and potentially contributing to TCR-like synapse formation13,49,50. Immune synapses have a pivotal role in regulating T cell activation, from signal initiation to propagation and termination51. This regulation is likely to be preserved in ChTCR T cells and may be important for antigen sensitivity. Other studies have incorporated specific signaling portions from the CD3ε, CD3δ and CD3γ subunits into CARs to provide additional CD3 motifs and improve CAR T cell function. In particular, CD3ε CARs exhibited improved T cell persistence and function in vivo. However, the antigen sensitivity, synapse formation and signaling of CD3ε-modified CARs were not evaluated13,52,53.
Even without a receptor-intrinsic costimulatory domain, CD19 full ChTCR+ T cells were more effective in vivo against CD19high tumors than CD28ζ and 4-1BBζ CAR T cells that have a costimulatory domain. ChTCR T cells also secrete lower amounts of cytokines in response to tumor cells expressing high antigen levels. High cytokine levels correlate with the severity of cytokine release syndrome and neurotoxicities observed after CAR T cell therapy54, and it is reasonable to expect a better toxicity profile with ChTCRs when most tumor cells express high antigen levels. Costimulation is provided to T cells by a variety of molecules, including LFA-1 and CD2 that are involved in synapse formation55,56,57. Thus, the dependency on additional costimulation may rely somewhat on the ability to form TCR-like synapses, which differs between ChTCRs and CARs. When mice were engrafted with a tumor inoculum comprising only Nalm-6 CD19low tumor cells, T cells expressing the full ChTCR were only modestly superior to CAR T cells. In this scenario, providing additional costimulation to ChTCR T cells might improve efficacy, as shown for the HIT receptor58. Approaches to incorporate costimulation into ChTCRs without driving excessive cytokine release are the subject of ongoing work.
We leveraged the superior monospecific full ChTCR format to design Bi-ChTCRs that target CD19 and CD22 or BCMA and SLAMF7. Given the lack of rules for designing optimized ChTCRs, we constructed monospecific CD22 ChTCRs with two CD22 scFvs that had similar binding affinities (m971 and 9A8)34,59. Surprisingly, while T cells expressing ChTCRs using each scFv bound the soluble CD22 protein, only T cells expressing the 9A8 ChTCR formed an organized immune synapse and recognized CD22+ tumor cells. In contrast, the m971 scFv was superior to 9A8 in CAR T cells60. These findings highlight potential differences between scFvs optimal for CARs versus ChTCRs, perhaps related to distinct synaptic distance requirements between the two receptor classes61,62. Unlike CARs, ChTCRs do not possess a hinge domain between the TCR constant chains and the scFv, which could limit the flexibility necessary to engage the membrane-proximal epitope of a bulky protein such as CD22. These findings underscore the need to define rules for optimal ChTCR design, informed by functional screening of large numbers of scFvs of known epitope specificity.
T cells expressing Bi-ChTCRs targeting CD19 and CD22 or BCMA and SLAMF7 recognized cells expressing one or both target proteins and exhibited superior sensitivity for tumors with low antigen levels compared to T cells expressing monospecific and bispecific CARs. In vivo models that mimic therapy of tumors with heterogeneous antigen expression and low antigen levels showed improved efficacy of Bi-ChTCR T cells compared to bispecific CAR T cells and two monospecific CAR T products33,39. The reduced sensitivity of bispecific CAR T cells allows the escape of antigen-low tumor cells, as demonstrated in our study, and the use of two products adds manufacturing complexity and cost42,63. Collectively, these data identify the ChTCR as an adaptable design for sensitive recognition of two target antigens with a single engineered T cell product that holds promise for reducing antigen escape and relapse in both B cell malignancies and multiple myeloma.
Methods
Our research complies with all relevant ethical guidelines. Details of the committees and institutions that approved the study protocol can be found in each specific section.
Cell lines
Lenti-X 293T cells were acquired from Takara Bio. Jurkat 76 TPR cells64 were a gift from M. Heemskerk (University Medical Center Utrecht). Nalm-6 (CRL-3273), Raji (CCL-86), H929 (CRL-3580), INA-6 and Jurkat E6.1 (TIB-52) cells were acquired from the American Type Culture Collection, whereas MOLP8 cells were acquired from DSMZ (ACC569). Lenti-X 293T cells were maintained in complete culture medium (DMEM (Gibco, 11965-092), 10% FBS (Corning, 35-011-CV), 2 mM l-glutamine (Gibco, 25030-081), 1× penicillin–streptomycin (Gibco, 15140-122), 25 mM HEPES (Gibco, 15630080)). Nalm-6, Raji, INA-6 and Jurkat cells were maintained in RPMI 1640 medium (Gibco, 22400-089) supplemented with 10% FBS, 2 mM l-glutamine and 1× penicillin–streptomycin. MOLP8 and H929 cells were maintained in RPMI 1640 medium (Gibco, 22400-089) supplemented with 20% FBS, 2 mM l-glutamine and 1× penicillin–streptomycin. Cells were maintained at a density of 0.3–0.6 × 10⁶ cells per ml. Tumor cell lines were authenticated in the Fred Hutchinson Cancer Center Genomics Core, and cell lines were routinely checked to ensure negativity for mycoplasma.
Generation of Nalm-6 variants
Nalm-6 cells expressing various levels of CD19 and CD22 were generated as described using CRISPR–Cas9 to KO CD19, CD22 or both35. Briefly, 1 × 10⁶ cells were resuspended in SF buffer (Lonza, V4XC-1032) mixed with 20 nM of the ribonucleoprotein protein (RNP) complex formed with CRISPR–Cas9 enzyme (Horizon Discovery, CAS12207) and single guide RNAs (sgRNAs) of interest (Horizon Discovery). Nalm-6 cells negative for CD19 or CD22 were sorted by flow cytometry, transduced with a lentiviral vector encoding either a truncated CD19 protein (extracellular and transmembrane domains only, UniProt P15391) or full-length CD22 (UniProt P20273). Transduced cells were subjected to single-cell flow sorting, and cell lines expressing the desired levels of CD19 and CD22 were expanded for analysis and use in assays. Nalm-6 cells expressing BCMA and/or SLAMF7 were generated by transduction with a lentiviral plasmid encoding for the extracellular and transmembrane domains of BCMA (UniProt Q02223) or SLAMF7 (UniProt Q9NQ25) and sorted by flow cytometry for purity.
Generation of lentivirus
A lentivirus vector (HIV7) was used for transduction of T cells. CAR and ChTCR sequences were synthesized after codon optimization and inserted into the HIV7 plasmid backbone under the EF1α promoter by Gibson assembly; in some cases, full plasmids were synthesized commercially (Twist Bioscience). Sequences for scFvs were previously described: anti-CD19 FMC63 (ref. 65), anti-CD22 m971 (ref. 33), anti-CD22 9A8 (ref. 34), anti-BCMA C11D5.3 (ref. 66) and anti-SLAMF7 HuLuc63 (ref. 38). To generate split ChTCRs, we inserted the human TRBC chain (UniProt P01850, amino acids 1–176) immediately after the antibody Vl chain. A furin site, P2A sequence and granulocyte-macrophage colony-stimulating factor (GM-CSF) signal peptide were inserted between the TCR chains. The TRAC chain sequence (UniProt P01848, amino acids 1–140) was inserted immediately after the antibody Vh sequence from the scFv. Full ChTCRs were designed by expressing the TRBC chain, fused to a furin site, P2A sequence and GM-CSF signal peptide before the scFv sequence (Vl-linker-Vh) and the TRAC chain. For Bi-ChTCRs, each target-specific scFv was fused to one TCR chain. TRBC S56C and TRAC T47C substitutions were made to improve chain pairing67. The mutSTAR was designed using sequences previously described25,32 and comprised the Vl and Vh domains from FMC63 fused to mouse TRBC1 (UniProtKB P01852, amino acids 146–173) and TRAC (UniProtKB P01849, amino acids 113–138) sequences, respectively, with the following mutations: mTCR-Cα S48C, mTCR-Cβ S57C and mTCR-Cα transmembrane domain LSVMGLRIL mutated to LLVIVLRIL. The HIT receptor sequence incorporating the CD19-specific scFv SJ25C1 was described in the study by Mansilla-Soto et al.26. In some experiments, the CAR and ChTCR constructs included an HA tag to facilitate immunoprecipitation. Lentiviruses were produced by transient transfection of Lenti-X cells using pPAX2, pVSVG and receptor-encoding lentiviral vector using Xfect polymer transfection reagent (Takara Bio, 631318), according to the manufacturer’s protocol. The lentiviral supernatant was collected after 48 h, filtered using a 0.45-mm PES syringe filter and concentrated with Lenti-X Concentrator (Takara Bio, 631232).
T cell isolation
Peripheral blood mononuclear cells (PBMCs) were obtained from healthy human donors after obtaining written informed consent on research protocols approved by the Institutional Review Board of the Fred Hutchinson Cancer Center (Seattle, WA). PBMCs were also purchased from Bloodworks Northwest. PBMCs were isolated by density gradient using SepMate-50 (Stem Cell Tech, 85450) and lymphocyte separation medium (Corning, 25-072-CV). Bulk CD8+ and CD4+ T cells were isolated using the EasySep T cell Isolation kit (Stem Cell Tech, 17953) following the manufacturer’s instructions. T cells were cryopreserved for later use.
T cell transduction and gene editing
CD8+ and CD4+ T cells were activated using Dynabeads Human T-Activator CD3/CD28 (Gibco, 11131D) at a 3:1 bead-to-T cell ratio. T cells were cultured in T cell medium (CTL) comprising RPMI 1640 (Gibco, 22400-089), 10% human serum (Bloodworks Northwest), 2 mM l-glutamine (Gibco, 25030-081), 1× penicillin–streptomycin (Gibco, 15140-122) and 0.5 mM β-mercaptoethanol and supplemented with IL-2 (50 IU ml−1). One day after activation, the lentiviral supernatant was added with LentiBOOST Solution B (100×) (SIRION Biotech, SB-P-LV-101-12) and polybrene (Millipore, TR-1003-G) at a final concentration of 4.4 μg ml−1. T cells were spinoculated at 800g at 32 °C for 90 min. After overnight incubation, beads were removed before gene editing. Cytidine base editing was performed to KO the expression of endogenous TRAC, TRBC or both, as well as SLAMF7 in some experiments. T cells (1 × 10⁶) were resuspended in P3 buffer (Lonza, V4XP-3032), mixed with 1 μg concentration of RNA guide and 1.5 μg of CBE BE4max mRNA (Addgene, plasmid 112093) (Aldevron) and electroporated using the Lonza 4D device (Lonza)68. The sequences for sgRNAs are described in Supplementary Table 1. T cells were cultured in CTL supplemented with IL-2 (150 IU ml−1), IL-7 (5 ng ml−1) and IL-15 (5 ng ml−1) initially and then maintained in CTL supplemented with IL-2 (50 IU ml−1) for 1 week before being used for assays. CAR+ and ChTCR+ T cells were purified by flow cytometry and cultured for 3 days before functional assays. For western blot analysis and calcium flux assays requiring larger cell numbers, flow-sorted CAR- and ChTCR-specific T cells were expanded using OKT3 (30 ng ml−1) or PHA-L (500×) (Thermo Fisher Scientific, 00-4977-93), γ-irradiated B-lymphoblastoid cells (LCLs) (8,000 rad) and γ-irradiated PBMCs at an LCL-to-T cell ratio of 100:1 and a PBMC-to-T cell ratio of 600:1. IL-2 was added 24 h after coculture, and OKT3 or PHA-L was washed out on day 4. Cultures were fed with CTL supplemented with IL-2 (50 IU ml−1) and rested without IL-2 addition before assays.
ssDNA production and TRAC-targeted knockin
Single-stranded DNA (ssDNA) incorporating Cas9 target sequences (CTSs) were produced as described by Shy et al.69 and used as a homology-directed repair template (HDRT) for targeted knockin experiments. Briefly, a plasmid encoding the HIT receptor with flanking homology arm sequences from Twist Bioscience served as a template for generating a PCR amplicon. CTSs and a 5′ biotin modification were added during the PCR reaction. Double-stranded DNA was purified using SPRI beads. ssDNA was then isolated as described by Shy et al.69 and Wakimoto et al.70. Complementary oligonucleotides to CTSs were mixed at a 4:1 molar ratio to ssDNA and annealed by heating at 95 °C before cooling gradually. ssDNA templates were then immediately used in electroporation experiments. The sequences of the HDRT encoding the HIT receptor, PCR primers and TRAC- or TRBC-specific sgRNAs are described in Supplementary Table 1. RNPs of Cas9 enzyme (Dharmacon Horizon) and sgRNAs were produced by complexing sgRNAs to Cas9 (sgRNA/Cas9 molar ratio of 2:1). ssDNA electroporation enhancer was added to the sgRNA solution before mixing with Cas9 (ref. 71). RNP mixtures were incubated at 37 °C for 15–30 min after mixing. A 50 pmol concentration of RNP was used for each electroporation. Two micrograms of ssDNA encoding the HIT receptor and TRAC-targeting RNPs were mixed and incubated for at least 5 min, combined with activated T cells resuspended in P3 buffer and electroporated using the Lonza 4D device using program EH-115 (Lonza). When indicated, RNPs targeting TRBC were also added.
Flow cytometry
T cells were stained to detect CAR or ChTCR expression with specific recombinant proteins (ACROBiosystems, CD19 (CD9-H82E9, 0.25 μg per test), BCMA (BCA-H82E4, 0.25 μg per test), CD22 (Siglec-2) (SI2-H82E3, 0.25 μg per test) and SLAMF7 (HL7-H82E0, 0.5 μg per test)) and anti-TCRα/β-BV421 (BD, 744778, 1:50) and anti-CD3ε-BUV395 (BD, 563546, 1:40) antibodies. When proteins directly conjugated to a fluorescent label were not available, biotinylated recombinant proteins were used, followed by incubation with fluorescently labeled streptavidin (BioLegend, APC (405207, 1:300), PE (405204, 1:300), BV421 (405226, 1:300); BD Biosciences, BUV395 (564176, 1:200)). Tumor lines were stained for the detection of target proteins with BioLegend antibodies (CD19 (302212, 1:50), CD22 (363512, 1:100), BCMA (357520, 1:40), SLAMF7 (331810, 1:200)) and stained with fluorescently tagged isotype controls when indicated. Antigen density was quantified using QuantiBRITE beads (BD Biosciences, 240495 or custom-made). Data were collected on BD FACSymphony A5 and BD FACSCelesta cytometers. FlowJo version 10.8.2 was used to analyze flow cytometry files.
Generation, fluorescent labeling and density quantification of extracellular protein domains
The 12× His-tagged CD19 (N138Q) and ICAM-1 extracellular domains were produced using the ‘Daedalus’ mammalian expression system72. Briefly, HEK293F cells were transduced with a lentivirus expressing CD19 (N138Q)-12× His tag or ICAM-1-12× His tag constructs. Proteins were captured from the expression culture supernatant by HisTrap FF crude (Cytiva, 11000458) Ni-affinity chromatography and polished by Superdex 200 (Cytiva, 28-9909-44) size-exclusion chromatography. Purified proteins were flash-frozen in liquid nitrogen in 1× PBS and stored at −80 °C. The extracellular domain of CD22-10× His tag is commercially available (ACROBiosystems, CD2-H52H8). For labeling, 100 μg His-tagged extracellular proteins were concentrated to 1 mg ml−1 using Amicon Ultra centrifugal filters (Millipore, UFC500396), and pH was adjusted to 8.3 by adding NaHCO3. Proteins were incubated with Alexa Fluor 488 TFP ester, Alexa Fluor 647 NHS ester or Alexa Fluor 555 NHS ester (ICAM-AF488, CD19-AF647, CD22-AF555, CD22-AF647) at room temperature for 15 min. Nonreactive dye was removed by size-exclusion chromatography, followed by repeat buffer exchange with Amicon Ultra centrifugal filters. Aliquots of protein were frozen and stored at −80 °C until use. The molecular density of extracellular domains in the SLB was determined using SLB-coated silica beads, as previously described57. Briefly, silica microspheres (Bangs Laboratories, SS05003) equaling the surface area of a single 96-well chamber were washed and resuspended in PBS. Beads were incubated with lipids (as described in ‘SLB generation and TIRF imaging’ in the Methods) and washed following the same steps as the bilayer preparation on a 96-well plate. His-tagged proteins were serially diluted and incubated with SLB-coated silica beads for 30 min with gentle shaking. Beads were run on a flow cytometer (BD FACSCelesta) along with Quantum Alexa Fluor 488 MESF (molecule of equivalent soluble fluorochrome) or Quantum Alexa Fluor 647 MESF (Bangs Laboratories, 647A/488A). The degree of protein labeling was determined by measuring absorbance at 280 nm and fluorescence intensity, and MESF standards were used to determine the absolute molecular density of proteins on silica beads.
SLB generation and TIRF imaging
SLBs were generated on 96-well chambered coverslips, as previously described73. Briefly, 96-well plates (Ibidi, 89627) were washed overnight with 5% Hellmanex III (Sigma, Z805939) and rinsed with ultrapure water. Wells were incubated with 20% HCl 3× for 1 h on a 50 °C hot plate. Small unilamellar vesicles (SUVs) were generated using 97.5% POPC (Avanti, 850457C, 200 mg), 0.5% PEG-5000-PE (Avanti, 880230) and 2% DGS-NTA (Avanti, 790404). SUVs were generated by repeated (35×) freeze–thaw cycles, moving between liquid nitrogen and a 37 °C water bath, followed by centrifugation at 33,500g for 45 min at 4 °C. SLBs were generated by covering the wells with SUVs and incubating for 1 h at 37 °C, followed by washing three times with PBS. SLBs were incubated with His-tagged proteins at determined concentrations (ICAM, 200 molecules per μm2; CD19 and CD22, 50 molecules per μm2) for 2 h and then washed three times with PBS. T cells were washed and resuspended in cell imaging buffer (RPMI without phenol red (Gibco, 11835-03H), 1% FBS, 25 mM HEPES) and incubated on the bilayer for 40 min, followed by fixation with 4% paraformaldehyde. Bilayers were washed three times with PBS before imaging. Imaging was performed using a Nikon Eclipse Ti2 stand equipped with iLas2 module (Gataca Systems) using the Apo TIRF 100×/1.49 objective and 488-nm (515/30), 561-nm (595/31) and 640-nm (860/42) laser lines. Images were acquired with an Andor iXon-L-897 electron-multiplying CCD camera. The microscope was controlled using Nikon NIS Elements software (version 5.41.01). The distribution of proteins within a synapse was quantified based on a previously described method74. Briefly, radial averages were generated by rotating cell images to all angles (1–359°); all rotated images were compressed to a single stack, and a z-projection of mean intensity was acquired. Radial averages combined from all cells were measured, and intensity values were normalized to the maximum intensity. Analysis was performed in Fiji (ImageJ2, version 2.9.0/1.53t).
Multiplexed calcium flux measurement by flow cytometry
CAR and ChTCR T cells were collected and washed once with PBS. Cells were stained with anti-human CD45 antibody (clone HI30), such that T cells expressing each receptor were stained with a unique CD45 fluorescent barcode (single or double staining with APC-CD45 (1:50, BioLegend, 304012), PE-CD45 (1:50, BD, 555483), PerCp-Cy-5.5-CD45 (1:50, BD, 564105), FITC-CD45 (1:50, BioLegend, 304006), BUV805-CD45 (1:50, BD, 612891)). Cells were washed three times and pooled. Cells were stained with 5 μM indo-1AM dye (Invitrogen, I1223) in calcium stain buffer (phenol-free RPMI, 1% FBS, 0.5 mM probenecid (Sigma, P8761-100G), 10 mM HEPES) at 37 °C for 45 min. Cells were then washed twice with calcium stain buffer, resuspended in 4 ml calcium stain buffer and split into four tubes. Before calcium measurement, cells were incubated with biotinylated proteins and antibodies (1 μg ml−1 CD19-biotin (ACROBiosystems, CD9-H82E9), 0.5 μg ml−1 anti-CD28-biotin (BioLegend, 302904)) for 5 min at 37 °C. Baseline indo-1AM fluorescence was measured for 30 s before the addition of 20 μg ml−1 avidin to cross-link biotinylated proteins. Calcium flux was measured for 5 min before the addition of 1× cell stimulation cocktail (Invitrogen, 00-4970). Multiplexed populations were deconvoluted, calcium plots were generated in FlowJo software (BD), and area under the curve measurements were made using Prism software (GraphPad).
Western blot analysis
Beads for T cell stimulation were prepared as previously described21. ChTCR and CAR T cells (2 × 10⁶ cells in total) were washed and resuspended in 50 μl warm CTL, incubated with either 30 μl/106 beads or an equal number Nalm-6 cells for specified times, immediately washed with 1 ml ice-cold PBS and lysed with NP-40 RIPA lysis buffer (20 nM Tris, pH 8, 150 mM NaCl, 1% NP-40, 5 mM EDTA, 0.1% SDS) supplemented with protease and phosphatase inhibitors (Thermo Scientific, 186093, 78428). Cell lysates were sonicated before centrifuging at 10,000g for 15 min at 4 °C; when present, beads were removed during the lysate-clearing step. Total protein concentration was quantified using the Micro BCA assay kit (Thermo Scientific, 23235). Equal masses of protein were loaded on Tris–glycine SDS gels (Bio-Rad, 4561086), and proteins were transferred to a polyvinylidene fluoride membrane (Bio-Rad, 1704274). Membranes were cut using molecular weight markers so that proteins with different molecular weights could be detected in parallel. Phosphorylation site-specific and total protein antibodies were used on separate membranes when indicated. Actin served as a loading control on all membranes and is shown adjacent to each analyte detected on the same membrane for easy reference. Membranes were blocked with blocking buffer (Bio-Rad, 12010020) and incubated overnight with the primary antibody diluted (1:2,000–1:500) in blocking buffer. Membranes were washed three times for 5 min with Tris-buffered saline supplemented with 0.1% Tween and then incubated with the secondary antibody diluted in blocking buffer (1:10,000). The following antibodies and dilutions were used: phospho-LAT (Tyr220) (1:1,000, Cell Signaling, 3584), phospho-LAT (Tyr171) (1:1,000, BioLegend, 946602), LAT (E3UCJ) (1:1,000, Cell Signaling, 45533), phospho-ZAP70 (Tyr319) (65E4) (1:1,000, Cell Signaling, 2717), ZAP70 (D1C10E) (1:1,000, Cell Signaling, 3165) and β-actin (13E5) (1:2,000, Cell Signaling, 4970). Membranes were incubated with ECL substrate (Bio-Rad, 1705062) and imaged with iBright 1500. Band intensities were quantified using ImageJ, normalized to total protein, loading control and control sample, as indicated.
Cytokine measurements
T cell cytokines were measured after coculturing ChTCR and CAR T cells with target cells or plate-bound antigens for 18–24 h. For target cell simulation, T cells and target cells were cocultured at a 1:1 effector-to-target (E/T) ratio, the supernatant was collected, and IL-2 (BioLegend, 431816) and IFNγ (BioLegend, 430116) concentrations were determined by ELISA. For plate-bound antigen stimulation, 96-well plates were coated with avidin (10 μg ml−1) overnight and incubated with PBS + 3% BSA to block nonspecific protein binding. Avidin-coated plates were then coated with biotinylated extracellular protein domains for 1 h at specific concentrations before culture with 50,000 T cells. In coculture experiments assessing the recognition of BCMA on MOLP8 and H929 multiple myeloma cell lines, SLAMF7 antigen was masked to prevent recognition by BCMA/SLAMF7 Bi-ChTCR T cells by preincubating target cells for 1 h with elotuzumab antibody (10 μg ml−1, Selleckchem, A2034) from which the HuLuc63 scFv used to design the Bi-ChTCR is derived.
T cell proliferation
ChTCR and CAR T cells were collected and washed with warm PBS. CellTrace Violet (CTV) cell proliferation dye (Invitrogen, C34557) was resuspended in 200 μl DMSO. T cells were resuspended in 1 ml PBS and incubated with 2 μl CTV for 10 min at 37 °C with periodic mixing. FBS (1 ml) was added to absorb unbound dye, and cells were washed and resuspended in CTL. T cells were cocultured with Nalm-6 cells expressing the appropriate target antigen at a 1:2 E/T ratio for 72 h. Cells were collected, washed with PBS and stained with anti-CD8-APC antibody (BioLegend, 344722) before acquisition by flow cytometry.
T cell cytotoxicity
Target tumor cells were incubated with Cr51 overnight, washed, resuspended in culture medium and plated with effector T cells to achieve the indicated E/T ratios. Plates were briefly centrifuged (100 rpm for 1 min) and then incubated for 4 h. After incubation, 30 μl of the supernatant was collected, transferred to LumaPlate (Revvity, 6006633) wells and dried overnight. Plates were read using a scintillation counter, and the percentage of specific lysis was calculated using the standard formula.
NSG mouse tumor models
All mouse experiments were performed with the approval of the Institutional Animal Care and Use Committee (protocol no. 50884) of the Fred Hutchinson Cancer Center and performed in accordance with institutional and national guidelines and regulations. Female NOD/SCID/γc−/− mice (6–8 weeks old) were purchased from The Jackson Laboratory or bred in-house. For in vivo treatment studies, mice were randomized before the start of treatment to ensure that each group started with an approximately equal mean tumor size. No statistical methods were used to predetermine sample sizes, but our sample sizes are similar to those reported in previous publications21,26. Data collection and analysis were not performed blind to the conditions of the experiments. No animals or data points were excluded from the analysis. Animals were monitored daily for health status and killed when they reached the endpoints of the study, including loss of 20% of body weight, respiratory distress, lack of grooming or abnormal appearance of the limbs. For the Raji model, mice were engrafted with 0.5 million Raji/GFP-ffLuc cells intravenously by tail vein injection. For the Nalm-6 models, mice were engrafted with 0.5 million Nalm-6 WT GFP-ffLuc or 1 million Nalm-6 CD19low GFP-ffLuc cells by tail vein injection. For experiments with Bi-ChTCR T cells, mice were engrafted with a heterogeneous mixture of Nalm-6 WT cells and Nalm-6 cells expressing only a single target antigen. Antigen expression in all tumor lines was confirmed by flow cytometry. Mice were injected intravenously 7 days (Raji/GFP-ffLuc) or 4 days (Nalm-6/GFP-ffLuc) after tumor inoculation with the ChTCR- or CAR-modified CD8+ and CD4+ T cells at a 1:1 ratio or with PBS. T cell numbers were normalized before infusion based on the total number of ChTCR+ or CAR+ cells in the total cell population, as determined by flow cytometry. Mice were followed by bioluminescence imaging after intraperitoneal injection of luciferin substrate using the Xenogen IVIS imaging system (Caliper Life Sciences) and for survival. Living Image Software version 4.7.3 (Caliper Life Sciences) was used to analyze luciferase activity and photon flux within regions of interest that encompassed the entire body of each mouse. Blood was obtained from mice at various time points, and single-cell suspensions from the peripheral blood were prepared by lysing red blood cells using AKC (ammonium chloride–potassium) lysing buffer (Quality Biological, 118-156-101). Single-cell suspensions were stained with the following antibody panel for flow cytometry: Nalm-6-GFP, anti-CD45-PE (BioLegend, 304008, 1:200), anti-CD8-BUV805 (BD, 612889, 1:640), anti-CD4-cFluor R840 (Cytec, R7-20165, 1:640), rBCMA-biotin (ACROBiosystems, BCA-H82E4, 0.25 μg per test), rSLAMF7-biotin (ACROBiosystems, SL7-H82E0, 0.5 μg per test) and streptavidin-APC (Invitrogen, 17-4317-82, 1:300).
Immunoprecipitation of ChTCRs and CARs
HA-tagged ChTCR and CAR lentiviral constructs were expressed in primary human CD8+ T cells as described. Nontransduced T cells without an HA tag were used as a negative control. Cells (30 × 106) were washed once in PBS and lysed in 500 μl coimmunoprecipitation lysis buffer (20 mM Tris–HCl, pH 8, 137 mM NaCl, 2 mM EDTA, 10% glycerol, 1× protease inhibitor, 1× phosphatase inhibitor (Thermo Scientific, 186093, 78428), 0.5% Brij O10 (Sigma, P6136-100g)) for 30 min on ice. The lysate was cleared by centrifugation at 10,000g for 15 min at 4 °C. A 10% portion of the lysate was removed for whole-cell lysate controls, and equal masses of the remaining lysate were used for anti-HA immunoprecipitation according to the manufacturer’s instructions (Thermo Fisher, 8836). Immunoprecipitated proteins were analyzed by western blotting. Coimmunoprecipitated proteins were detected using the following antibodies and dilutions: TCRα (H-1) 1:1,000 (SCBT, sc-515719), TCRβ (E9I1D) 1:100 (Cell Signaling, 65123), CD247 1:1,000 (BD Pharmingen, 551034), CD3δ (F-1) 1:100 (SCBT, sc-137137 HRP), CD3γ 1:100 (EPR4517) (Abcam, ab134096), CD3ε (D7A6E) 1:1,000 (85061) and HA tag 1:1,000 (C29F4) (Cell Signaling, 3724).
Reporting summary
Further information on research design is available in the Nature Portfolio Reporting Summary linked to this article.
Responses