Developing a rapid assessment framework for China earthquake disaster losses: insights from physical simulations of the Yangbi earthquake

Introduction
Earthquakes remain a natural disaster that cannot be fully predicted, posing significant threats to human life. Consequently, the rapid assessment of post-earthquake disaster losses provides an effective means to assist governments and social organizations in making timely emergency response decisions, thereby reducing casualties and preventing further damage1. Despite advancements in technology enhancing our understanding of earthquakes, the global challenge persists in how to quickly and effectively assess disaster losses following earthquakes.
Typically, the accuracy and speed of ground motion calculations are critical factors that significantly influence both the precision and rapidity of assessments for earthquake disaster losses. Theoretically, dense networks of stations along with detailed observational data enable the prompt acquisition of high-precision ground motion measurements. For example, the Geological Survey of Japan (GSJ) has developed the rapid assessment system known as QuiQuake. Operating across the high-dense strong-motion seismograph networks K-NET and KiK-net, this system is capable of promptly releasing detailed seismic intensity distribution maps immediately following an earthquake2,3. However, many regions worldwide lack sufficient such advanced facilities and instead rely on Ground Motion Prediction Equations (GMPEs) based on empirical methods. The datasets that underpin GMPEs frequently lack enough records from significant near-fault earthquake events. This deficiency renders these models less effective in accurately capturing the intricate impacts of near-fault zones, which are typically the primary areas of earthquake damage4. Furthermore, GMPEs incorporate ergodic assumptions, which compromise their accuracy in predicting ground motions for specific areas using data from multiple sources5. The Prompt Assessment of Global Earthquakes for Response (PAGER), developed by the U.S. Geological Survey (USGS), is currently the most widely utilized system for rapid earthquake loss assessment6. The ground motion calculations within the PAGER system predominantly rely on GMPEs, supplemented by limited observational corrections. Although the primary advantage of this system is the rapid computation of ground motion on a global scale, its accuracy is less than that achieved by physical simulation methods. Conversely, physics-based numerical simulation methods for strong ground motion thoroughly incorporate the realistic effects of heterogeneous velocity media and undulating terrain on seismic wave propagation. These methods are extensively utilized in ground motion simulation and disaster analysis7,8,9. With recent advancements in graphics processing unit (GPU) and supercomputing technologies, large-scale and high-resolution 3D parallel simulation techniques have progressed rapidly. These technological developments have enabled the feasibility of rapid ground motion calculations based on physical methods following earthquakes10.
Earthquake disaster loss assessments can generally be divided into inventory and macro methods. The inventory method requires a detailed inventory of social exposure structures. It considers numerous additional factors, such as structural types, vulnerability, temporal variations in occupancy rates, and loss rates for different structures11,12,13. The widespread application of the inventory method has been constrained by factors such as the incomplete availability of social inventory databases and inconsistencies in statistical data across different regions. Furthermore, current exposure databases typically only include building information, but loss estimates from earthquakes should also account for significant damage to various infrastructures and equipment, including lifeline facilities such as transportation systems, communication systems, power systems, and water supply systems, as well as non-structural losses resulting from earthquakes, such as damages to natural resources, crops, and livestock. Additionally, the data exhibit considerable dynamic variability and uncertainty with social development. Therefore, the inventory method is unsuitable for rapidly assessing natural earthquake losses.
Macro methods typically employ macro indicators—such as population distribution, gross domestic product, purchasing power parity index, and fixed assets—to characterize the exposure of earthquake-affected areas14,15,16,17. Loss function curves are derived from regression analyses of historical earthquake loss data. These curves are then multiplied by the population and social asset exposure in the affected region to assess human and economic losses from an earthquake. The earliest empirical loss curve was introduced by Kawasumi in 1954, establishing a linear relationship between potential fatalities and the number of destroyed buildings in Japan18. Subsequent scholars have refined and expanded upon this foundational work, increasing the complexity of the expressions and establishing relationships between various earthquake parameters and exposure, including functions related to magnitude19,20,21, ground motion22,23, and earthquake intensity24,25,26. Earthquake intensity is a macro indicator that reflects the severity of surface damage caused by an earthquake. Compared to magnitude, earthquake intensity provides a more accurate representation of ground-level damage. Additionally, historical data on earthquake intensity is generally more accessible than ground motion parameters. Earthquake intensity is one of the most used parameters in empirical methods. This study will utilize a disaster loss assessment model27,28 derived from regression analyses of a substantial dataset of historical earthquake events29 for calculations.
This study aims to explore a universal and rapid assessment framework for earthquake disaster losses based on physical simulations post-earthquake. Its objectives are to quickly estimate the seismic intensity distribution, quantitative fatalities, and direct economic losses, and to suggest activation levels for earthquake emergency response plans. The study employs the 2021 Yangbi earthquake (Fig. 1) as a case study to demonstrate the efficacy and results of the rapid assessment framework. The results illustrate that the Yangbi earthquake could potentially result in 5 fatalities, with a 65.2% probability of 0–10 fatalities. This event is likely to be classified as a “general earthquake disaster event”, corresponding to a level IV emergency response. The most probable range for economic losses resulting from this earthquake is 10–100 billion yuan, with an estimated economic loss of 48.62 billion yuan. The calculated results show a high degree of consistency with the official statistics collected after the earthquake. Additionally, the numerical simulations also align well with the observations recorded at the stations. These assessments will aid government and related agencies in making decisions for emergency response, earthquake relief operations, resource allocation, post-disaster reconstruction, and seismic insurance planning, thereby minimizing additional socio-economic losses and saving more lives.

The red pentagram represents the surface projection of the epicenter. The beachball illustrates the focal mechanism solution. The black outline denotes the surface projection of the fault. The red triangles indicate strong motion stations. The white solid lines show the distribution of faults. The gray circles represent ≥ Ms 5.0 historical earthquake events.
Results
Physics-based strong ground motion simulation
Following the Yangbi earthquake, a finite fault rupture model was derived from station waveform inversion data. This model was subsequently utilized as input for conducting a numerical simulation of strong ground motion using the CGFDM3D-EQR platform. Figure 2 illustrates the wavefield snapshots of the east-west velocity component (Vx). The velocity components on either side of the fault exhibit distinctive polarity characteristics: the left side of the fault displays a pronounced negative polarity, whereas the right side predominantly exhibits a positive polarity. The seismic wave energy predominantly propagates both along and perpendicular to the fault direction, with relatively weaker propagation observed in other orientations. Given the limited spatial extent of the primarily strike-slip fault slip, the seismic source closely resembles a double-couple point source. It produces strong S-wave energy along and perpendicular to the fault direction, consistent with the radiation pattern of a double-couple point source. The relatively weak energies in the east-west and north-south directions coincide with the lighter impact of the disaster in Dali City, which is close to the east side of the epicenter. Figure 2 also illustrates abundant multiple reflections near the mountain peaks and ridges along the fault direction, which coherently superpose to amplify the ground motion.
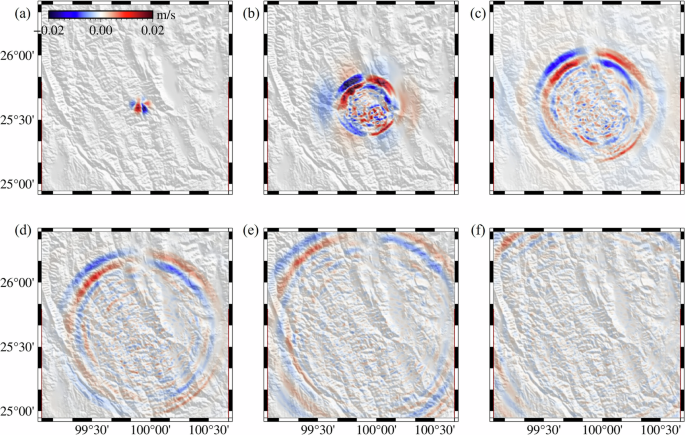
a–f correspond to the snapshots from 6.8 to 40.8 seconds, respectively. (Note: The color range of -0.02 to 0.02 m/s does not represent the actual amplitude range of Vx but is artificially narrowed to enhance the clarity of the ground motion details).
Seismic ground motion represents the particle vibrations at the surface caused by seismic waves released from an underground source, making it the physical parameter most directly related to surface damage. Seismic intensity is a macroscopic parameter that describes the degree of surface damage based on expert opinion. Therefore, there is a quantifiable relationship between these two parameters in describing surface damage. The relationship between ground motion and seismic intensity is outlined in the Chinese national standard “Chinese Seismic Intensity Scale (GB/T 17742-2020)” based on extensive statistical analysis30. Consequently, this study converted the numerically calculated peak ground velocity (PGV) into the seismic intensity distribution.
Earthquake disaster losses estimations
Figure 3 shows seismic intensity distribution, where the base map is the LandScan population distribution data31. The results indicate that the maximum seismic intensity for this earthquake is VIII. The VIII intensity zone is centered around the seismic fault and extends outward along and perpendicular to the fault, forming a butterfly-shaped distribution. The most severe damage is concentrated entirely within Yangbi County. The VII intensity zone was mostly within Yangbi County, with a minor extension into the sparsely populated regions of Yongping County to the southwest. The densely populated regions in the surrounding counties and cities adjacent to Yangbi County experienced a maximum intensity of VI. Additionally, the densely populated areas of Eryuan County to the north and Yongping County to the southwest only suffered an intensity of V. It is generally believed that the seismic damage caused by V–VI intensity is quite limited30. Therefore, it is estimated that the overall losses caused by this Yangbi earthquake are relatively minor.
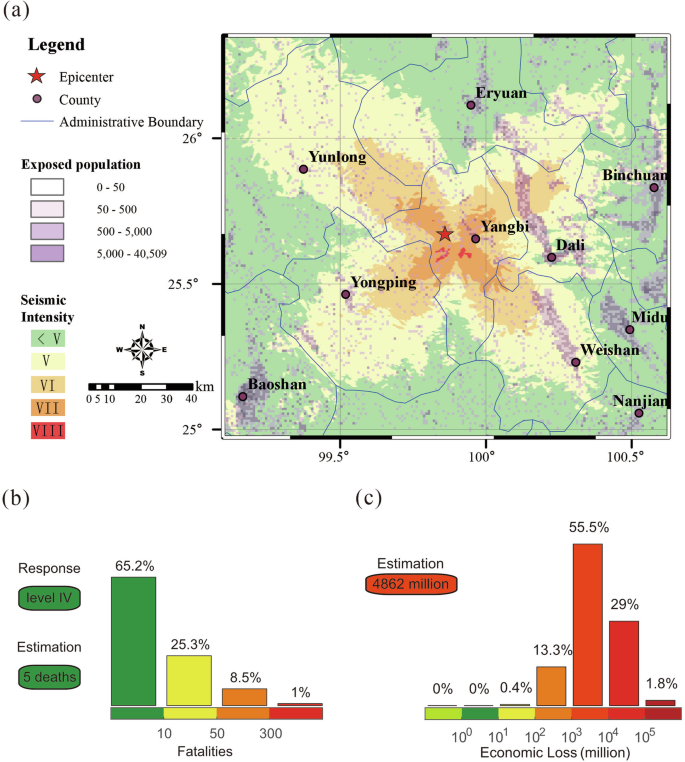
a Rapid assessment of seismic intensity and population distribution. b Recommended levels of earthquake emergency response and rapid assessment of fatalities. c Rapid assessment of economic losses (million RMB).
To estimate the losses incurred, Geographic Information System (GIS) software is initially employed to perform a spatial integration of pre-stored population distribution and fixed asset data across different seismic intensity zones, obtaining the population exposure and fixed asset value for each intensity zone. Subsequently, the fatality and economic loss rates corresponding to different seismic intensities are multiplied by the aforementioned data to calculate the fatalities and economic losses, respectively. Finally, the cumulative normal distribution method is employed to calculate the probability values for fatalities and economic losses across different loss intervals, thereby enabling an assessment of the level of earthquake emergency response (see Fig. 3b and c).
Figure 3b illustrates that the Yangbi earthquake could potentially result in 5 fatalities, with a 65.2% probability of 0–10 fatalities. According to the regulations of the National Earthquake Emergency Plan32, this event is likely to be classified as a “general earthquake disaster event”, corresponding to a level IV emergency response. Figure 3c shows that the most probable range for economic losses resulting from this earthquake is 10–100 billion yuan, with an estimated economic loss of 48.62 billion yuan. Near the epicenter, Dali is situated to the east and Weishan County to the southeast. In these cities, the densely populated areas experienced seismic intensities no greater than VI. Notably, the most densely populated regions in Dali encountered damage at levels ranging from IV to V intensity. Consequently, the overall impact of the Yangbi earthquake was relatively minor, consistent with actual news reports.
Based on the rapid assessment conducted subsequent to the earthquake, this study recommends that the government initiate a level IV emergency response plan (Fig. 3b). Priority in the earthquake relief efforts should be assigned to Yangbi County, followed by Weishan County, Dali City, Eryuan County, Yunlong County, and Yongping County. For post-disaster reconstruction, special emphasis should be placed on the entirety of Yangbi County, as well as the northern region of Dali City and the northwestern region of Weishan County.
Discussion
To analyze the reliability and validity of the numerical simulations of strong ground motion for the Yangbi earthquake, we selected nine seismic stations located near the epicenter, as shown in Fig. 1. Both the numerically simulated strong ground motions and the recorded seismic waves from the strong-motion stations underwent bandpass filtering between 0.02–0.2 Hz, followed by normalization and superimposition for comparative analysis, as shown in Fig. 4. Figure 4a–c present the waveform comparisons for the east-west component (Vx), north-south component (Vy), and vertical component (Vz), respectively. The comparison results indicate that, although there are detailed differences between the observed and simulated seismic waveforms at different stations, the overall consistency is good, especially the main phases aligning well. These findings suggest that the simulation of strong ground motion for the Yangbi earthquake is relatively reliable and valid, thereby supporting the reliability of the earthquake intensity distribution data generated by CGFDM3D-EQR. This outcome is sufficiently robust for preliminary applications in the rapid assessment of post-earthquake disaster losses.
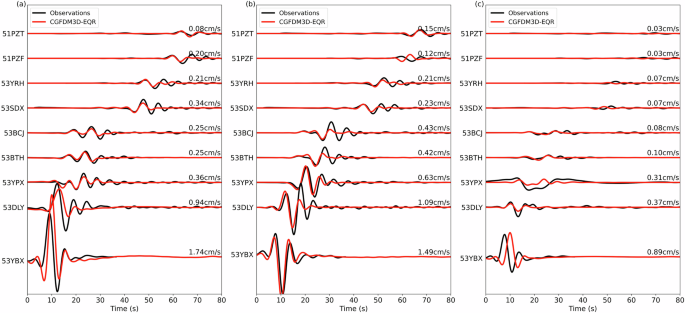
a–c represent the waveforms for the east-west component (Vx), north-south component (Vy), and vertical component (Vz), respectively. The names of the stations are labeled on the left side of the seismic records, and their locations are shown in Fig. 1. The maximum absolute value (cm/s) for each observed component is listed at the end of each seismic record.
According to the post-earthquake survey report released by the Chinese Ministry of Emergency Management six months after the event, the official statistics indicate that the Yangbi earthquake resulted in 3 fatalities and economic losses amounting to 3.32 billion yuan33. These records fall within the loss range established by the rapid assessment results of this study and closely match the expected value. Moreover, the local government initiated a level II earthquake emergency response plan (although a level IV response would have been more appropriate), evidently overestimating the potential impact of the earthquake. The emergency response level estimated by our method more accurately reflects the actual situation, thereby further demonstrating the practical application value of this loss assessment framework based on physical simulations proposed in this study. This assessment framework can play a significant role in earthquake emergency response, seismic relief, and post-disaster reconstruction efforts.
In this study, we compare the estimation outcomes for the Yangbi earthquake with those from the USGS PAGER system, as depicted in Fig. 5. To facilitate a coherent comparison, we adjust the fatality intervals originally adapted for Chinese policy (shown in Fig. 3b) to conform to the intervals used by the PAGER system. For the estimation of economic losses, we employed the 2021 USD to RMB exchange rate (1 USD = 6.45 RMB, as reported by the World Bank), resulting in the data presented in Fig. 5b. Official statistics suggest that the most likely range for earthquake-related fatalities lies between 1-10 individuals. An analysis of Fig. 5a and c reveals that the fatality estimation for the Yangbi earthquake in this study surpassed the accuracy of those by PAGER. The official direct economic loss was estimated at 514.7 million USD, positioning the most probable economic loss interval between 100-1,000 million USD. The comparison of Fig. 5b and d indicates that while both methodologies yield relatively consistent results regarding economic losses, our study presents higher probability values, thereby reinforcing the confidence that the economic losses from this earthquake should align within the identified range. Consequently, we infer that the estimation methodology employed in this study offers superior accuracy in evaluating both the fatality and economic impacts of the Yangbi earthquake compared to the PAGER system.
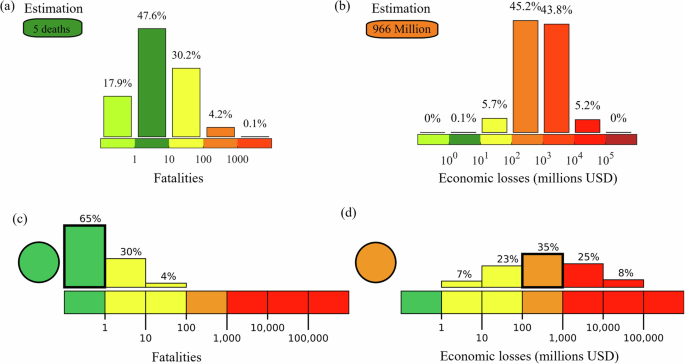
a The estimated earthquake fatalities by this study. b The estimated earthquake economic losses by this study. c The estimated earthquake fatalities by PAGER52. d The estimated earthquake economic losses by PAGER52.
This rapid assessment framework ensures that the effects of real 3D physical parameter fields are fully considered while achieving a more generalized application. Although high-frequency information in near-field data may reveal more physical details, it is often the case that there are insufficient seismic stations in near-field areas, or such data cannot be quickly obtained due to confidentiality. Therefore, this study attempts to utilize teleseismic data to establish a universal framework for rapid post-earthquake loss assessment. The comparison of simulation results with observations from strong-motion stations further validates the potential rationality of the assessment framework employed in this study. The minimum shear wave velocity on the surface of the model domain is 1250 m/s, and the average grid spacing in the 3D computational domain is set at 100 m. Considering that the CG-FDM requires 6 points to accurately define the effective wavenumber of each wavelength, the effective upper-frequency limit for simulating ground motion in this study is approximately 2.1 Hz. The results of seismic numerical simulations are typically influenced by input data such as the seismic source model, underground media, and topography. Among these variables, except for topography, there is no consensus in the academic community on the others, and their scientific validation falls outside the scope of this paper. The framework for assessing earthquake disaster losses utilizes a regression-based empirical analysis approach. Consequently, the assessment results cannot be used to precisely predict fatalities and economic losses caused by an earthquake. However, the greatest practical significance of this model lies in its ability to evaluate reasonable loss ranges, which sufficiently meet the initial needs of government and social sectors for emergency response efforts.
This study develops a rapid assessment framework for earthquake disaster losses based on physical simulations through the case study of the 2021 Ms 6.4 Yangbi earthquake. The results indicate that the assessment of fatalities and economic losses is relatively ideal compared to actual reported data. This highlights the potential practical application of the proposed rapid assessment framework in assisting government efforts for quick emergency responses following earthquakes. In the future, should other regions of the world experience destructive earthquakes, applying this rapid assessment framework could facilitate the rapid estimation of the scale of destruction and the extent of disaster losses, including both fatalities and economic losses. Furthermore, it could provide recommendations for initiating appropriate earthquake emergency response levels. This framework offers timely and reasonable quantitative references for decision-making and actions in post-earthquake emergency responses, seismic relief, and resource allocation. Additionally, it provides auxiliary suggestions for post-disaster reconstruction and earthquake insurance planning. Ultimately, the goal is to minimize further losses caused by earthquakes and to save more lives through scientifically informed seismic relief efforts. To enhance earthquake response efforts, future research should emphasize the assessment of strong shaking areas, road traffic conditions, and potential isolation zones. Understanding these factors is essential for optimizing disaster relief strategies and improving overall preparedness for seismic events.
Methods
This study develops a rapid assessment framework for earthquake disaster losses based on physical simulations. The specific flow chart of the proposed method is shown in Fig. 6. Using the 2021 Yangbi earthquake as an illustrative case, the specific process of the rapid loss assessment framework is outlined as follows: This study initially employs a finite fault source derived from the inversion of teleseismic data. This source is then integrated into a 3D parallel strong ground motion numerical simulation platform. This platform is developed utilizing the finite difference method, enhanced with GPU acceleration technology. It is feasible to compute ground motion at a higher spatial resolution within a reduced timeframe, while comprehensively accounting for the effects of heterogeneous media and terrain. Subsequently, the data are integrated into a mathematical model for earthquake disaster loss assessment, which is derived from historical statistics. By utilizing pre-stored data on population and fixed asset values, along with a developed loss rate function, the model enables the rapid estimation of the earthquake emergency response level, quantitative fatalities, and direct economic losses.
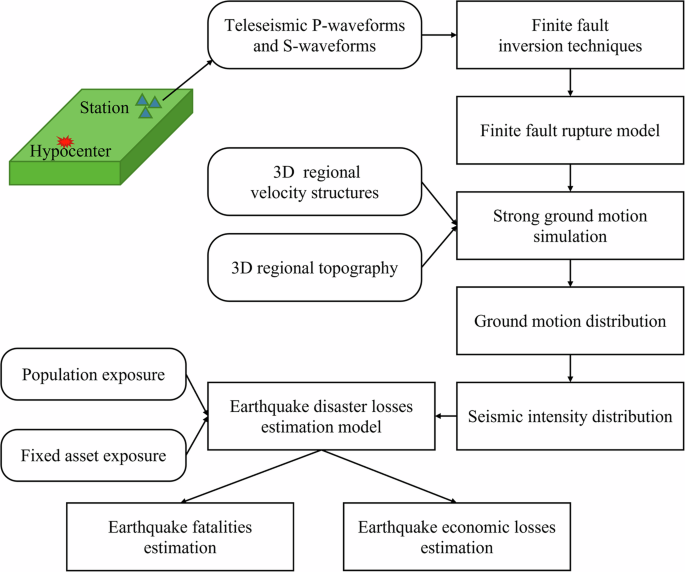
Flow chart of the proposed rapid assessment framework for earthquake disaster losses based on physical simulations.
Yangbi earthquake and Velocity model
On May 21, 2021, a Ms 6.4 earthquake struck Yangbi County, Dali Bai Autonomous Prefecture, Yunnan Province, China. According to the China Earthquake Networks Center, the epicenter was located at 99.87°E, 25.67°N, with a focal depth of 8 km. This earthquake occurred near the southwest boundary of the Sichuan-Yunnan block, a region that is historically recognized for its seismic activity. The seismogenic fault, identified as the Weixi-Qiaohou fault (WQF), is located approximately 12 km northeast of the epicenter. It exhibits a northwest-southeast trend with a right-lateral strike-slip mechanism34. The fault distribution within this region is characterized by a complex and intersecting pattern, as illustrated in Fig. 1. To the east of the epicenter, the Honghe fault (HF) runs nearly parallel to the WQF. Additionally, several secondary faults intersect in this area, including the Longpan-Qiaohou fault (LQF), the Eryuan-Heqing fault (EHQ), and the Chenghai fault (CF). To the west of the epicenter, the Nujiang Fault (NF) and the Lancangjiang Fault (LF) are located35. Since 2013, the area has witnessed a phase of moderate to strong seismic activity. Four notable earthquakes with magnitudes exceeding Ms 5.0 occurred prior to the 2021 Yangbi earthquake: two in Eryuan County (Ms 5.5 and Ms 5.0) in March 2013, one in Yunlong County (Ms 5.0) on May 18, 2016, and one in Yangbi County (Ms 5.1) on March 27, 201736,37,38. The Ms 6.4 Yangbi earthquake in 2021 represents the most significant seismic event recorded in historical documents for the region surrounding the WQF, signaling an escalation in seismic activity within this area35.
The velocity model used in this study is the 3D shear wave (Vs) reference model of China21. This model has a horizontal resolution of 0.5° × 0.5° and a vertical resolution of 500 m. We used this velocity model to evaluate the Vs velocity of each grid in computational domains through linear interpolation. For the grids above sea level, we performed linear extrapolation to obtain the velocities. Using empirical relations between the elastic wave speeds and density39, we obtained the corresponding Vp and density on each grid. The topographic data are from the Shuttle Radar Topography Mission (SRTM90), with a resolution of approximately 90 m22.
Finite fault rupture model
This study employs the finite fault rupture model and source mechanism solutions obtained through finite fault inversion techniques40,41. Specifically, Wang et al. selected 14 teleseismic P-waveforms and 21 SH-waveforms with high signal-to-noise ratios and a relatively uniform azimuthal distribution from the Incorporated Research Institutions for Seismology (IRIS)20. The inversion results indicate that the maximum slip during the earthquake was 45 cm, and the total duration of fault rupture was approximately 12 seconds. The spatial resolution of this finite fault model is 3 km × 3 km (fault strike × dip direction). As shown in Fig. 1, the black beachball represents the focal mechanism solution for this earthquake, characterized by a fault strike of 138°, a dip of 73°, and a slip angle of -163°, indicating a high-angle strike-slip earthquake. This aligns closely with the inversion results from the USGS. The black line frame delineates the surface projection of the fault, the red pentagram marks the surface projection of the epicenter, and the red triangles represent nearby strong-motion stations.
Numerical simulations
We utilize the curved-grid finite difference method (CG-FDM) for conducting strong ground motion simulations. The CG-FDM effectively addresses traction-free boundary conditions in simulations of seismic wave propagation23. It employs curved grids to discretize the computational space and thus is able to incorporate the irregular topography of the simulated research area. The GPU technology is employed to accelerate the CG-FDM solver, developing the post-earthquake rapid response platform CGFDM3D-EQR10. This platform integrates preprocessing and input interfaces for finite fault source models, terrain models, and heterogeneous medium models, enabling the completion of an earthquake simulation in an extremely short time and quickly obtaining ground motion. The CG-FDM has been widely validated by simulating the dynamic rupture process of natural earthquakes42,43,44,45 and scenario earthquakes9,46,47. This study employs CGFDM3D-EQR for the rapid computation of ground motion, which is then transformed into seismic intensity using the intensity-PGV relationship30. This study employs a Linux-based GPU server platform, equipped with 8 Nvidia Tesla A100 GPUs. The calculation grid size is 1600 × 1600 × 400. The spatial resolution of the computational grid is 100 m, with a time interval of 0.004 s and 15,000 time steps. The total computation time was 2,264.24 seconds. The calculation parameters of numerical simulation are shown in Table 1.
Loss estimation methods
This study employs the earthquake fatality estimation model27 and the earthquake economic loss estimation model28 based on the development of regression analysis of earthquake disaster loss datasets in China from 1949 to 201929. These models have been validated against a substantial amount of historical earthquake disaster loss records27,28. The following equations are used for estimating fatalities or economic losses:
where, ({E}_{F,or,E}) represents fatalities estimated (EF) or economic losses estimated (EF) for an earthquake. ({r}_{F,or,E}(Int)) represents a fatality or economic loss ratio function based on seismic intensity (Int). The Human Development Index (HDI) is the indicator proposed by the United Nations Development Program for comprehensively evaluating the social development level. (Exposure(gird,event-year,Pop,or,Fcs)) represents the total population (Pop) or fixed capital stock (Fcs) at the grid point within the calculation domain for the current year. Φ is the normal cumulative distribution function. ({mathrm{ln}}({E}_{F,or,E})) is the expectation of the distribution, which is calculated by the loss estimation model with Eq. 1. ζ is the standard deviation of the distribution, which represents the uncertainty of the loss estimation model. The reasonableness of the model has been confirmed through normality tests and has been subject to uncertainty analysis27,28.
In the temporal dimension, the model incorporates adjustments for the potential impacts of societal development factors—such as building fortification, emergency preparedness, and public awareness—on earthquake disaster loss rates by utilizing the Human Development Index (HDI). In the spatial dimension, the model adopts a zonal strategy to account for regional variations in seismic structures and economic development that could influence loss rates. This strategy synergizes seismological and sociological factors, formulating a suite of region-specific loss rate functions characterized by distinct mathematical expressions for various sub-regions across China. According to the location and applicable intensity range of Yangbi earthquake, this study belongs to the regional model of Qinghai-Tibet Plateau in China. The corresponding standard deviation (ζ) and HDI term coefficients (h) for fatalities and economic losses estimation model are 1.7485, 1.0 and 1.4418, 2.0, respectively35,36. The fatality and economic loss ratio functions are as follows:
Where, ({r}_{F}) and ({r}_{E}) represent the fatality ratio and economic loss ratio, respectively. For the function expressions and free parameters pertaining to other sub-regions in China, refer to the research conducted by Li et al. on the earthquake damage loss assessment model27,28. This approach has been successfully applied to studies of natural earthquakes and scenario earthquakes in China in recent years9,45,48,49.
In this study, population exposure is determined using grid population datasets provided by LandScan31. These datasets are annually updated and offer global population spatial distribution data in ESRI grid format, featuring a spatial resolution of 1 km (30″× 30″). Fixed asset exposure is calculated by employing the perpetual inventory method50,51. By combining intensity simulated with pre-stored data on population and fixed asset exposure, along with a set of developed loss rates and parameters, the model enables the rapid estimation of earthquake fatalities and economic losses.

")


Responses