Developing a suicide risk model for use in the Indian Health Service

Introduction
Despite generations of research, our ability to identify individuals at risk of suicide and associated behaviors remains limited1. Existing methods do not always account for the complexity of factors that drive risk. Therefore, researchers have started using more data-intense methods—including information from electronic health records (EHRs)—to identify at-risk patients2. Several large health systems, including the United States Veterans Administration (VA)3,4,5, Kaiser Permanente6,7,8, and other academic medical institutions9,10,11,12, have developed EHR-based risk models using statistical machine learning, which show promise13,14,15. However, none have been developed specifically for American Indian/Alaska Native populations who face the highest burden of suicide of any racial or ethnic group in the United States. Here, we show the development of a model that performed better than the existing screening.
The relative strength of statistical machine-learning models versus traditional risk scores or calculators lies in their ability to combine large numbers of patient variables to identify patterns and risk factors that might otherwise remain hidden. However, their validity depends on the quality and relevance of the data from which they are developed. The same complexity that gives statistical machine-learning models their power can make those models more sensitive to changes in context or population, known as dataset shift16. To date, there have been few suicide risk models developed in the highest priority suicide prevention populations, including racial and ethnic groups that face significant or growing inequities, such as American Indian and Alaska Natives (AI/ANs)17,18.
To address this gap, we developed and evaluated an EHR-based suicide risk model in partnership with the Indian Health Service (IHS). This effort contributes to broad efforts to improve health equity for AI/AN communities. The literature on applying standardized suicide screening tools to AI/AN populations is conflicted. Some American Indian/Alaska Native populations have unique patterns of risk and protective factors for suicide19,20,21. While screening tools are fairly standard, we have seen from other literature and reports from community partners that these tools can be culturally insensitive and challenging to implement. Accordingly, no current screening tools for suicide risk have been validated in AI/AN populations. In terms of machine learning-based suicide risk models, some evidence points to potential racial and ethnic disparities22. Other work shows that models developed in other healthcare settings maintain a high level of accuracy when applied in patient populations that are majority Native Alaskan23.
In our previous work, we developed, implemented, and tested the impact of a machine learning-based model in partnership with a community-based suicide prevention and care system within the White Mountain Apache Tribe (WMAT). This model was developed using data collected by case managers who were part of the Celebrating Life program24,25. The model was found to be highly accurate (AUC = 0.87)26, acceptable to case managers who used it27, improved the reach of care, and reduced the risk of subsequent suicide-related events for those flagged by the model as the highest risk28. While this previous work showed strong promise, the Celebrating Life program is somewhat unique and operates outside the traditional healthcare system. The IHS operates within the Department of Health and Human Services in the United States. Its primary responsibility is to uphold the federal government’s treaty obligation to provide health services to AI/AN populations. Members of federally recognized tribes can receive free care at any IHS facility. Therefore, tools developed for IHS can have substantial reach across AI/AN communities.
This paper aims to describe the development and evaluation of a novel, culturally specific model of suicide risk among an AI population. The results may be compared to models serving other populations and those developed specifically for AI/AN populations. In a parallel effort, we evaluated the performance of existing models developed in other populations in an IHS setting. In creating a new, culturally specific model, we seek to advance the body of knowledge prioritizing health equity and cultural relevance, thus paving the way for more effective, culturally sensitive interventions.
Results
Descriptive results
In total, 16,835 patients met our inclusion criteria. Sample characteristics for these patients are in Table 1. The average patient age at the first included visit was 40, and 51% of patients were female. American Indian/Alaskan Native was the dominant reported race (85%), followed by white (9%) and less than 3% of patients in any other racial category. During the study period, there were 417 suicide attempts among 324 (1.9%) patients, and 37 (0.2%) patients died by suicide (not mutually exclusive). Among the 388 attempts and 36 deaths that occurred at least 90 days following the start of our data or the patient’s 18th birthday, 280/388 attempts (72%) and 18/36 deaths (50%) occurred in the 90 days following an IHS patient contact at which suicide risk might have been acted upon. In unadjusted comparisons, we found that suicide attempt or death during the study period was associated with younger age, Medicaid enrollment, a diagnosis of depression, anxiety, bipolar, PTSD, TBI, or suicidal ideation, a diagnosis related to alcohol, cannabis, stimulant, or other substance abuse, and a past positive screen for intimate partner violence, suicide risk, or depression. After reducing the dataset to only visits when potential suicide risk could be addressed (e.g., an ED or clinic visit vs. a vaccine appointment), there were 331,588 included visits among 13,761 (82%), and the population was 94% AI/AN.
Model performance
Visit-level performance metrics are in Table 2, and performance plots are in Fig. 1. For the primary outcome of a 90-day attempt or death, existing screening had an Area Under the ROC Curve (AUROC) of 0.64 [95% CI 0.60–0.67], a sensitivity of 32.4% [26.2%–38.6%], and a positive predictive value (PPV) of 2.5% [1.7%–3.2%]. Overall, the logistic regression and random forest models were statistically indistinguishable, and both improved substantially on the baseline with AUROCs of 0.83 [0.80–0.86] for both models. At the sensitivity of the existing screen (32.4%), the logistic regression and random forest models had risk PPVs of 3.4% [1.7%–5.1%] and 2.4% [1.6%–3.3%], respectively. PPVs for alternative cutoffs are in Table 2 and Fig. 1b. Both models were well calibrated, as shown in Fig. 1c. Table 1 shows model performance metrics stratified by gender, age, visit year, and emergency department. Neither model showed performance differences based on gender; however, both models had higher AUROC in older patients. Both models and the existing screen had higher AUROC but lower PPV post-2020 when increased screening was initiated. Finally, the sensitivity of existing screening for 90-day suicide death was 0% (AUROC is not meaningful for a binary screen with 0% sensitivity). In contrast, the logistic regression and random forest models had AUROCs of 0.79 [0.69–0.89] and 0.77 [0.66–0.88], respectively.

This figure shows a the Receiver Operating Characteristic (ROC) curve; b a plot comparing a range of sensitivities of the model to the corresponding positive predictive value (PPV); c a risk concentration plot that shows the proportion of visits with an outcome compared to the risk score decile; and d the model calibration curves along with 95% confidence intervals (shaded regions).
Feature importance
Coefficients and SHAP values for the logistic regression model are in Figs. 2 and 3. Since the logistic regression and random forest models had nearly identical performance, we focus our presentation on the feature importance of the logistic model. However, SHAP values for the random forest model can be found in Supplementary Fig. 1. The top ten most influential features based on average SHAP value included alcohol abuse, age, Medicaid enrollment, mental health-related ED visits, diagnosis codes for injury, poisoning, or depression, and gender. Medicaid enrollment, age, alcohol abuse, and prior mental health ED visits were also among the covariates with the largest absolute coefficients but had coefficients smaller than indicators for prior ideation. Interestingly, mental health inpatient visits in the past three months ranked among the top ten largest coefficients but were negatively associated with risk (odds ratio = 0.65), suggesting that inpatient treatment may have a potential protective effect.
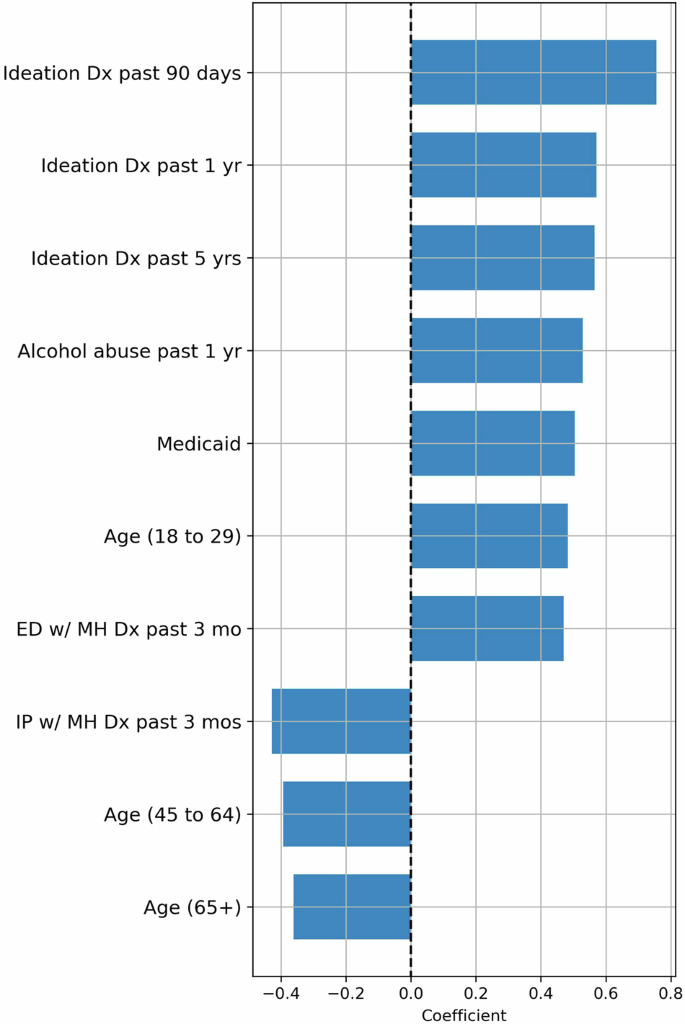
This figure shows the most important features ranked by the value of their absolute coefficients in the logistic regression model.
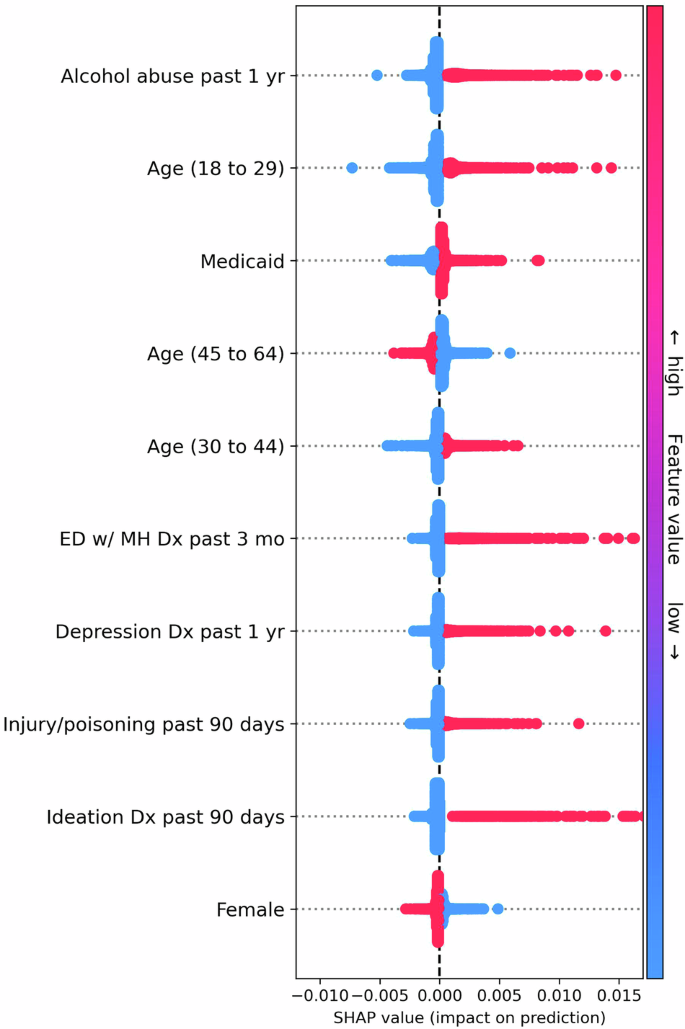
This figure shows the most important features ranked by mean absolute Shapley Additive Explanation (SHAP) value in the logistic regression model. SHAP values represent the influence that a covariate has on the risk score for a particular visit. Each dot represents a visit, and the x axis represents the SHAP value. Each row of dots shows the spread of SHAP values for a particular feature, with dots to the right of zero indicating samples where the feature increased the risk score and vice versa. Additionally, the color of each dot represents the (normalized) feature value, with red dots indicating high value and blue dots indicating low value. For example, in the top row, blue and red dots represent patients with and without an alcohol abuse diagnosis in the past year, respectively. Thus, each row also indicates the relationship between feature values and impact on model predictions.
Discussion
We developed a machine-learning statistical model to assess the 90-day risk of suicide attempt or death among a predominantly AI/AN adult population. The resulting model had a high AUROC (0.83) and substantially outperformed existing screening approaches. This study builds on our previous work developing and testing machine-learning models to identify people at risk in partnership with AI/AN communities26,27,28. However, it is the first paper leveraging data from the IHS, a health system serving 2.2 million Americans annually29, and a population with the largest suicide-related racial and ethnic disparities.
These results are roughly in line with models developed in other settings, which found AUROCs ranging from 0.59 to 0.9313, and with our previous work in a community-based setting26. In particular, these results are similar to those of Simon et al. (AUROC 0.85), who used a similar set of covariates7. Simon et al. developed a logistic regression model for 90-day suicide attempts and death using health records from a cohort of patients containing only 1% AI/AN patients. Since we reused many of the same features used in their model, the similar performance of our model to theirs suggests that these features are quite general and transfer well between populations. This runs somewhat counter to Coley et al. which found that the model developed in Simon et al. performed poorly on AI/AN patients22. Coley et al. note that the observed performance disparities may be due to racial disparities in mental health diagnoses. However, the same disparities may not be present in IHS, which is free at point-of-care and serves primarily AI/AN patients.
Notably, the developed models substantially outperformed the existing screen. This is despite the fact that we augmented screening by including aggregated screening results over a 90-day window, including past 90-day diagnoses of ideation independent of screening results and the patient’s entire history of suicide attempts, which is favorable to the performance of the existing screen. Strikingly, the existing screening flagged none of the suicide deaths in our data. In contrast, the logistic regression model had an AUROC of 0.79—slightly lower than the combined outcome of attempt or death but much better than the existing screening. This finding suggests that our model may add value in an IHS clinical setting.
Examining the features with the largest impact on model predictions revealed that, by and large, the most impactful features were those already associated with suicide risk. We found that age, prior ideation, alcohol abuse, gender, history of depression, and prior attempts were associated with increased risk. This finding coincides with the existing literature and related suicide risk models1,7,17. However, three crucial features stand out. First, we found that the impact of suicidal ideation on the risk score diminished little with time. Ideation codes appearing 0 to 90 days, 90 days to 1 year, and 1 year to five years before the time of visit all had similar coefficients in the logistic regression model. This finding suggests that the risk model may pick up more risk factors that are long-term rather than acute risk factors which has implications for the use of the tool. Since very few of the patient variables decrease a patient’s risk score, once a patient has a suicidal ideation code entered into their record, their risk score may remain high for several years. Providers should be aware of this when considering the risk score.
One notable feature that did lead to decreased risk scores was a mental health-related inpatient admission in the 30 days prior to the visit at which risk is assessed. Interventions delivered in inpatient settings may be effective in this population, though additional study is needed to test a causal link. Additionally, mental health-related inpatient admissions more than 30 days prior increased predicted risk. This finding suggests that any protective effect may be short-lived and underscores the importance of post-visit follow-up. Following up with patients at risk of suicide is a key strategy in reducing the risk of suicide for individual patients and moving the needle on durable population-level suicide rates30.
Finally, we found that Medicaid enrollment increased risk. At a population level, previous research has shown that states that expanded Medicaid enrollment experienced a decrease in suicide rates based on the theoretical assumption that Medicaid coverage increases access to mental health care31. However, other studies have found that having a lower income is associated with an increased risk of suicide32,33. In the context of AI/AN populations, free health care, secured as part of treaties with the U.S. government, is provided to all enrolled members of federally recognized tribes regardless of insurance status. In 2016, IHS started enrollment efforts of Tribal members into Medicaid and Medicare to expand access to healthcare for patients. However, our study occurred in a highly geographically isolated community where the nearest inpatient-specific adult mental health care is over 1 hour away (youth 2.5–3 hours away). Thus, in our sample, since healthcare is accessible without insurance coverage, there is high poverty, and inpatient mental health care is geographically challenging to access, the relationship between Medicaid coverage and increasing access to mental health services may not hold.
While EHRs are an invaluable resource for developing the types of risk models described here, they have several notable drawbacks. Diagnosis codes and prescriptions are subject to diagnostic error, care fragmentation, and medication adherence. They may also be biased by considerations such as billing and reimbursement. Further, we can only observe a patient’s state when they access or contact the health system. While these considerations certainly affect this study, the particular context of IHS partially reduces these concerns. Because IHS services are free to tribal members, substantive care fragmentation is less likely. Additionally, because IHS serves as the primary regional pharmacy, the prescription and fill data in this analysis is more reliable than in many settings. However, we still cannot see what happens to a patient outside the clinic. While the records used to identify suicide deaths are relatively comprehensive, the recorded suicide attempts in our data represent, at best, a noisy proxy for true attempts and may miss any attempt or aborted attempt that does not rise to the level of medical attention. The likely impact this missing information may have on our model is that risk scores underestimate actual patient risk—known as label proxy bias34. However, the degree of underestimation is unknown, and further investigation is needed to understand if this label proxy bias impacts certain patient groups more than others (see e.g., Obermeyer et al.35). Additionally, data extracted from clinical notes may be used in the future to identify cases not documented using diagnosis codes. Finally, these results represent only an internal evaluation in a single specific tribal context, and additional external validation is needed before use in other contexts.
Understanding who is at risk of suicide is an essential component of suicide prevention. Our work suggests that a machine-learning model based using EHR data can add value to existing practices at IHS clinics. While this tool holds promise as a strategy to help address AI/AN suicide-related inequities, carefully considering how its use is critical to its ultimate utility and impact.
Methods
Ethical and tribal approvals
This study was approved, and a waiver of consent was granted by the Phoenix Area Office Institutional Review Board of the IHS and the Johns Hopkins Bloomberg School of Public Health Institutional Review Boards (PXR 22.05; JHSPH 17333). The Tribe approved the study through the Health Advisory Board and Tribal Council. All analyses were conducted in a secure computing environment administered by the Johns Hopkins School of Medicine specifically to analyze protected health information. Reporting followed TRIPOD guidelines.
Community engagement
This analysis builds on a 40+ year relationship between the WMAT and the Johns Hopkins Center for Indigenous Health. This specific project aligns with key community priorities about better identifying those at the highest risk for suicide and providing them with supportive services to save lives. This analysis is one component of a more extensive study supported through a WMAT Resolution.
Population
This was a retrospective cohort study of all adult patients (age 18+) who had clinical encounters with the IHS Whiteriver Service Unit (WRSU). The IHS operates within the Department of Health and Human Services in the United States and provides free service to all members of federally recognized tribes. The WRSU provides outpatient, inpatient, pharmacy, and emergency care to the approximately 17,500 WMAT members. EHR data was extracted from the WRSU EHR for all visits between 01/1/2017 and 12/31/2021. Patients were included if they had at least one visit over the age of 18. Additionally, clinic types were reviewed with a team of local physicians who work at WRSU to identify visits where a clinician might consider and act upon a suicide risk score (e.g., optometry, vaccine, and dental visits were removed). Models were developed to produce risk scores, and performance was evaluated only on these visits, though data from all visits was used to extract patient variables. For example, risk scores were not produced for pharmacy visits, but covariates based on prescription fill data were used as inputs to the models.
Outcome
The primary outcome used to train and evaluate the models was a binary indicator for a suicide attempt or death in the 90 days following a visit. Suicide attempts and deaths were modeled together because the number of deaths observed in our data was too small to model this outcome separately. However, to test whether the joint model identified patients at risk for suicide death, we include a binary indicator for death by suicide in the 90 days following a visit as a secondary outcome used only for model evaluation. Suicidal ideation was identified based on the visit diagnosis ICD-10 code R45.851. Suicide attempts were identified either by (a) an ICD-10 code for a suicide attempt (T14.91), (b) an ICD-10 code for ideation in combination with an ICD-10 code for an initial encounter involving a wound or poisoning (e.g., R45.851 and), or (c) an ICD-10 code for an initial encounter involving injury, poisoning, or wounds due to definite or possible self-harm (e.g., X71.0XXA). The specific ICD-10 codes for injury, poisoning, and wounds were derived from the Mental Health Research Network diagnosis code list version 202036. In cases where the patient had a code for a subsequent encounter or sequela of injury, poisoning, or wounds (e.g., X71.0XXD or X71.0XXS) but did not have a code for an initial encounter in the prior 90 days, the subsequent encounter or sequela code was counted as the time of the attempt. Records of confirmed deaths by suicide were included in the community’s suicide monitoring system25. Finally, mental health-related ED visits were identified as any ED visit with a visit diagnosis of ICD-10 code in the Mental Health Research Network list of mental health-related codes37.
Features
As the starting point for model development, we included all features in the model described in Simon et al.7. This includes patient demographics (age, gender, race), proxies for socioeconomic status, prior mental health-related diagnoses, prior prescriptions for mental health-related medications, indicators for prior mental health-related outpatient, inpatient, and ED visits, indicators for current or recent pregnancy, and prior PHQ-9 scores. Procedures used to extract these variables were designed to be as close as possible to those described in Simon et al.; however, due to data limitations, prescription fills were used along with medication orders for all medication-related features. Also, features explicitly related to item 9 of the PHQ-9 were excluded, as item-level scores were unavailable. In addition to these features, we included several features believed to be relevant, including diagnosis codes for opioids, cannabis, non-cocaine stimulants, or other substances; diagnosis codes for suicidal ideation; results from suicide, depression, and intimate partner violence screens; the number of prior ED visits of all types. Complete definitions for these features, including all relevant ICD-10 codes, are available in Supplementary Table 1. In this data, we had access only to visit dates but not visit times, so all features defined based on the current encounter were instead defined based on the date of the current encounter. For example, if the patient had a primary care visit in the morning and a pharmacy visit in the afternoon, the pharmacy fills were included in the features for the primary care visit. Since one of the primary intended uses of these risk models is to direct follow-up case management resources after an encounter, this aggregation is reasonable. For all features with missing values, the values were set to zero, and an additional binary missingness indicator was included38,39.
Existing screening
To assess whether the models added information beyond what providers already had, we compared all models against current suicide screening, which appears in the health record as a binary flag. We aggregated positive screens on either a suicide risk assessment (recorded in the EHR) that indicated risk and/or the Ask Suicide Questionnaire (ASQ; both acute and non-acute positives)40 over the 90 days preceding the current patient visit. Additionally, to avoid penalizing existing screening in cases where suicide risk was sufficiently plain that screening was unnecessary, we set this binary flag to positive if the patient had an ICD-10 code for ideation in the prior 90 days or had any prior suicide attempts.
Model development and evaluation
We compared the performance of two binary classification models: logistic regression (LR) with L2 regularization and a random forest (RF) with log-loss split criterion. Our goal in selecting these models was to test a small number of representative off-the-shelf models, rather than perform an exhaustive model search, which comes with added risk of multiple comparisons41. The random forest model was chosen over alternative tree-based models due to simplicity of tuning, robustness to overfitting, and precedent use in suicide risk modeling12. Since regularization was applied to both models, no additional feature selection was used. Both models were developed and evaluated at the visit level, meaning that a patient could contribute multiple times to the model loss or evaluation metrics depending on how many visits they had. This design was chosen over a patient-level design because it most closely reflects the tool’s intended use to direct visit-level screening and follow-up rather than a one-time patient evaluation. To avoid overrepresenting patients with multiple encounters on the same day, we include only the last encounter of the day for each patient. We evaluated both models using 10-fold cross-validation. Cross-validation folds were constructed at the patient level to account for between-visit correlation for the same patient. That is, to construct each fold, we selected 10% of patients and placed all of their data in the test fold.
Model development
During model training, we treated each visit at which suicide risk was considered applicable (see above) as an independent sample. We considered the primary outcome censored for a visit if the visit occurred fewer than 90 days from 12/31/2021, and we excluded such visits from model training. Hyperparameters for each model were tuned using grid search and nested 5-fold cross-validation on the training fold. Hyperparameters were selected to maximize average AUROC across the five nested validation folds. After hyperparameter tuning, the model was retrained on the complete training fold. Before training, all non-binary features were scaled to fall between zero and one using the minimum and maximum values calculated on the training set. The coefficients of logistic regression model were estimated using L-BFGS42 with a maximum of 5,000 iterations. L2 regularization was applied to coefficients except the intercept, and the inverse regularization strength was tuned across the following approximately logarithmic grid: 0.0003, 0.001, 0.003, 0.01, 0.03, 0.1, 0.3. The random forest model was fit using the log-loss split criterion with 2,500 trees. The max tree depth was tuned from 8 to 13, while no limit was placed on the minimum samples per split or leaf node. To control training time, each tree was constructed based on 20,000 samples drawn with replacements from the total training set. All models were implemented in Python using the Scikit-learn package version 1.3.0.
Model evaluation
We plotted the Receiver Operating Characteristic (ROC) curve, PPV-sensitivity curve, concentration plot, and calibration curve for each model. To summarize model performance across thresholds, we report the AUROC and PPV at sensitivity 0.5, 0.75, 0.9, and sensitivity matching existing screening. All metrics are reported at the per-visit level and were averaged across cross-validation folds. During the training stage, we exclude censored visits. We estimated standard errors and confidence intervals for each metric based on the cross-validation folds. In addition to the overall performance, we compared model performance based on patient gender and age, the visit year, and whether the visit occurred in the emergency department. The year of visit was included because screening for suicide risk increased dramatically from 2020 onward compared to previous years based on hospital policy.
Model interpretation
To explore feature importance in the learned models, we used shapley additive explanation (SHAP) values43. Unlike most feature importance measures, SHAP values approximate a covariate’s impact on each prediction, giving a more complete picture of covariate importance for non-linear models. The most influential covariates are then identified based on the mean absolute SHAP value across all samples. SHAP values were estimated separately for each test fold and then pooled across folds when interpreting the model. We plotted SHAP values for each model for the top ten most influential features. SHAP values were implemented using the “SHAP” Python package version 0.42.1. Additionally, we report the individual coefficients (averaged across folds) for the logistic regression model. We do not report confidence intervals or p values for these coefficients, as the model was not designed to identify risk factors (e.g., by carefully selecting confounders), and the results should not be interpreted as such.


Responses