Development and implementation of a simulated microgravity setup for edible cyanobacteria

Introduction
Humans have now the opportunity to venture beyond low Earth’s orbit and this has expanded the boundaries of exploration, paving the way to new studies and new techniques, leading to extensive life science investigations in space1. Space exploration is becoming increasingly important, and the growth of the space industry has led to an acceleration of plans for long-duration space exploration missions2. However, the completion of space exploration missions is difficult, due to the many challenges involved, and a range of potential solutions have been developed, such as materials that are resistant to radiation and systems utilizing materials found on other planets3. The safety and well-being of the explorers is of utmost importance4, and the success of these endeavors depends on our ability to support and monitor the health and performance of the crew members5. Proper nutrition is critical to ensure the health and well-being of astronauts on long-duration missions6. Well balanced nutrition plays a key role in meeting the metabolic needs of the body, enhancing emotional well-being7, and offsetting negative effects of the harsh conditions in space such as confinement, radiation exposure, immune deficiency, as well as bone and muscle loss due to reduced gravity.
The supply of crucial resources such as food, water, and oxygen for long-term human missions presents a significant challenge6 and has led to a growing need for innovation in bioregenerative life support systems (BLSS)8. BLSS have emerged as a potential solution to sustain future space crews, as they operate in a closed loop, recycling organic waste to produce fresh food, water, and oxygen9. However, hydroponically grown plants, which are the main source of food in these systems, offer limited variety and do not provide the full range of nutrients found in animals or tree-based products, including full proteins and micronutrients10,11. The study of cyanobacteria in a closed cycle to produce oxygen and possible food sources is of paramount importance for the future of human space flight12. As Verbeelen et al. 8 pointed out in their review, the current environmental control and life support system requires constant supply from Earth, which is not sustainable for long-term missions, due to the inability to produce food. The European Space Agency (ESA) together with national research organizations has launched a project, starting the development of a closed BLSS to produce oxygen, water and food coupled to the recycling of waste, for space crew members: the MELiSSA (Micro-Ecological Life Support System Alternative) project. The MELiSSA system is composed of five compartments that are selected based on the stringent conditions and constraints that must be considered in extreme space environment. The system is inspired by a lake ecosystem, and it includes thermophilic anoxygenic bacteria, photo-heterotrophic bacteria, nitrifying bacteria, cyanobacteria, higher plants, and the crew13,14. Within these 5 compartments mentioned above, the cyanobacterium Limnospira indica PCC8005 is part of compartment IV and acts, along with the higher plants, for air revitalization, food production and wastewater treatment by converting nitrogen from mineral phase back into edible biomass. The natural occurrence of this cyanobacterium Limnospira, formerly known as Arthrospira15,16, is commonly observed in a multicellular form in regions with optimal environmental conditions for this fresh (lake) water organism, including warm-climate zones around the equator, such as India, Peru, Mexico, Lake Chad in Africa and others17.
Conducting scientific research in space entails high costs and technical difficulties18 particularly concerning systems involving living organisms, such as cyanobacteria12. These organisms may experience extended launch vibrations and accelerations and transport times for space missions, during which the samples are subjected to several impacts before experiencing microgravity. As a result, studying the impact of the specific space environment is challenging and various restrictions need to be considered in the cultivation of cyanobacteria and other photosynthetic organisms19. To prepare a suitable space experiment and to approach the effects of microgravity ground analogs are used. Ground analogs and simulated microgravity have been used in the past to study microbes showing varying effects on different microorganisms. These studies have explored potential pathogens, and microorganisms with potential value in supporting human life in space20. For instance, Limosilactobacillus (formerly Lactobacillus) reuteri DSM17938 was cultivated under simulated microgravity, leading to increased reuterin production, improved bile tolerance and growth rates of 0.472 (±0.016) h−1 for the random positioning machine (RPM) cultures and 0.556 (±0.023) h−1 for the Rotating Cells Culture System (RCCS) cultures21. L. reuteri is an oxygen consuming and lactic acid, acetic acid, ethanol, and CO2 producing organism22. Within the MELiSSA project, Mastroleo et al. 23 tested the facultative anaerobic bacterium Rhodospirillum rubrum S1H under aerobic conditions, which demonstrated the ability to sense and respond to microgravity (spaceflight and simulated with RPM), as well as an impact on the signaling molecules used in quorum sensing, when tested under simulated microgravity with the RPM and the RWV24. In addition, Ilgrande et al. 25 demonstrated that a synthetic community of six heterotrophs can produce nitrate from urea even under microgravity conditions simulated with GAP-A540 HD Clinostat. Moreover, microgravity during spaceflight onboard ISS was tested and it was found that it could influence the virulence of Pseudomonas aeruginosa PAO126.
To investigate the possible influence of microgravity and simulated microgravity on L. indica cultures that are not subject to continuous stirring (unmixed), a new approach had to be established. In this work, we report the response of this oxygenic cyanobacterium to simulated microgravity conditions using a custom-built system accommodating continuous light and gas permeable cell culture bags and in house printed holders fitting the Random Positioning Machine (RPM), a 3D clinostat developed by Hoson et al. 27. The cyanobacterium L. indica was tested in simulated microgravity in photoautotrophic conditions including continuous illumination. We monitored growth parameters as well as specific metabolites. In addition, whole proteome differential analysis was performed using a label-free liquid chromatography coupled to ultra-high-resolution mass spectrometry-based approach.
Results
In the following sections, the results of two consecutive experiments are presented. A first experiment was run to obtain a reproducible growth curve of L. indica in this new culturing setup and to select relevant sampling points for further molecular analysis. Based on the outcome of the first experiment, 2 RPMs were run in parallel in a second experiment, and they were stopped either at the same time point or when reaching the same cell density (measured as OD770nm) as the control cultures on the rotating cell culture system (RCCS). Specifically, one RPM was stopped after 72 hours to match the control at the same time point, while the other RPM was stopped after 96 hours to match the cell density of the control stopped at 72 hours (Fig. 1).

RPM1 and control 1 were part of the first experiment that was sampled every day to build a full growth curve and decide when to stop the second experiment, which was only sampled at the end points control 2, RPM 72 h, and RPM 96 h. Each time point corresponds to the average of the data collected from 4 biological replicates, with the error bars representing the standard deviation of these data.
In these experiments, the control setup consisted of 4 biological replicates in 4 cell bags held in custom-built frames rotating in a horizontal plane at 25 rpm (Fig. 2). Unlike the RPM, which rotates the cell bags in a 3D random manner relative to the gravity vector, the RCCS control setup rotates the cell bags in a constant 2D horizontal plane, perpendicular to the gravity vector.
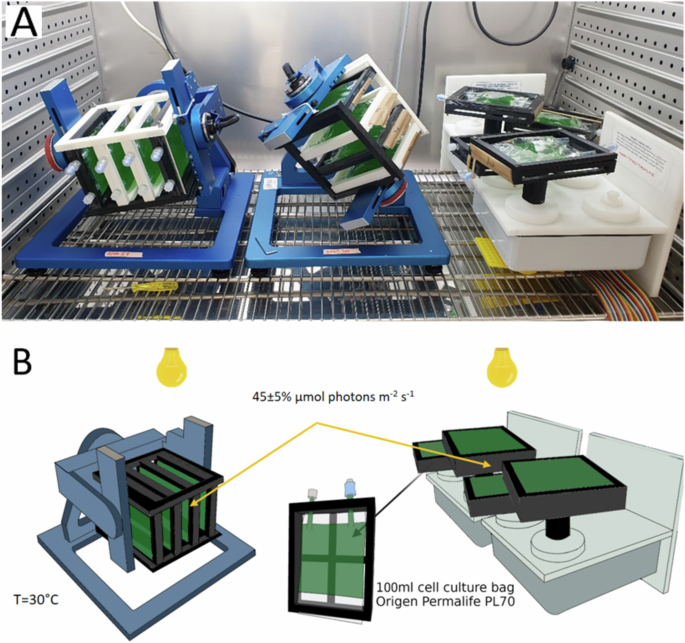
A Picture of the actual setup, B Graphical representation of the setup. Left: RPM, right: RCCS control. Figure created in Biorender.com.
Culture and cell analysis
The simulated microgravity condition negatively affected the growth curve of L. indica compared to the control condition, (Fig. 1). The growth rate (µmax), which was obtained via exponential regression, is 0.40 ± 0.04 d−1 for the control and 0.28 ± 0.04 d−1 for the simulated microgravity culture on the RPM. Based on the obtained µmax values, the doubling time, t(G), is 1.74 d (41.7 h) for the control and 2.45 d (58.9 h) for the RPM.
The biomass concentration at the moment of sampling was found to be 0.93 ± 0.07 g L−1 for the control (72 h), 0.85 ± 0.04 g L−1 for the RPM (96 h) and 1.05 ± 0.08 g L−1 for the RPM (96 h) (Fig. 3). While the optical density (OD770nm) of the simulated microgravity grown culture on RPM 96 h was comparable to that of the control (0.457 ± 0.017 for the RPM 96 h and 0.462 ± 0.014 for the control), the dry weight of the RPM was slightly higher, although not significantly different. At the contrary, flow cytometry analysis showed a lower number of cells in the RPM simulated microgravity culture compared to the control group, both for the total events and the P1 population (Fig. 4).
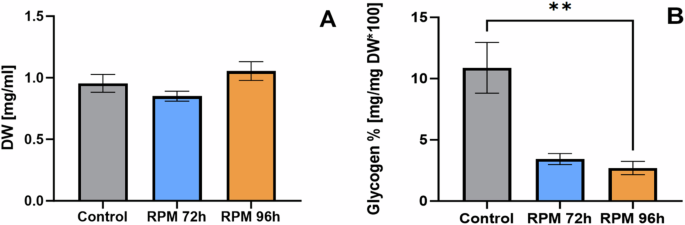
A Dry weight analysis of L. indica under simulated microgravity and normal gravity conditions. B Glycogen concentration of L. Indica under simulated microgravity and normal gravity conditions. Each column corresponds to the average of the data collected from 4 biological replicates, with the error bars representing the standard deviation of these data. Statistical significance was assessed by Kruskal-Wallis tests followed by Dunn’s multiple comparisons. *p < 0.05; **p < 0.01.
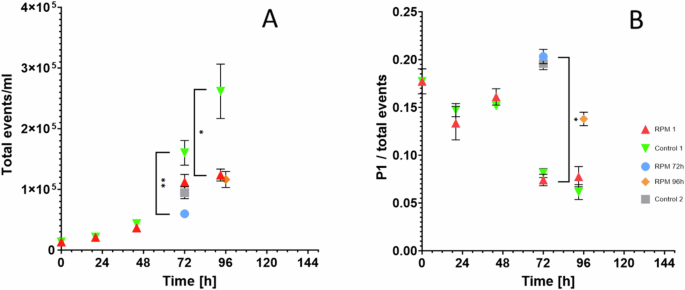
A Total events and B P1/total events ratio. Each time point corresponds to the average of the data collected from 4 biological replicates, with the error bars representing the standard deviation of these data. Statistical significance was assessed by Kruskal-Wallis tests followed by Dunn’s multiple comparisons. *p < 0.05; **p < 0.01.
Via glycogen content analysis it was found that the amount of glycogen in the RPM 96 h is significantly lower than the control (Fig. 3), while the p value for RPM 72 h compared to the control is 0.233. Also, significant differences were observed in the sedimentation index between the control and RPM cultures stopped at the same OD (96 h), with the microgravity grown cells sedimenting more slowly (Fig. 5). The sedimentation could also be related with the trichomes size, longer trichomes sediment faster, however the trichomes of both cultures appeared similar after the experiment on the microscopy image (see Supplementary Fig. 5).
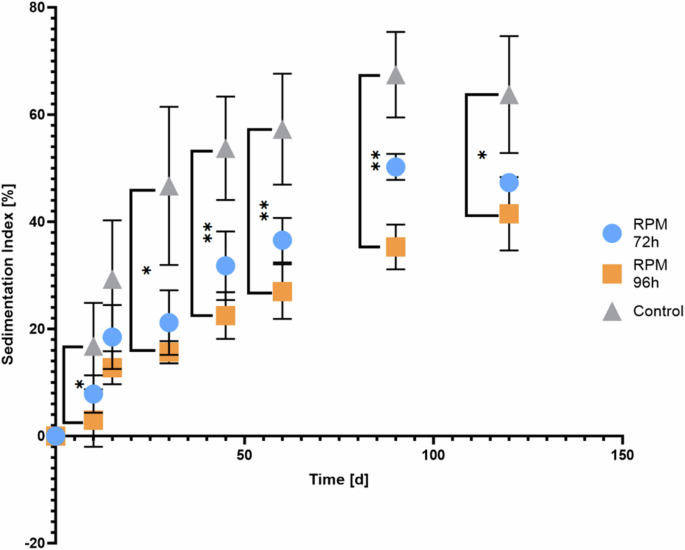
Sedimentation index of L. indica under normal gravity: after cultivation under simulated microgravity condition (RPM 72 h and RPM 96 h) or normal gravity condition (control). The sedimentation index is a measure used to quantify the rate at which particles settle out of a suspension over time. It is calculated using absorbance measurements taken at different time intervals, more precisely by dividing the difference between the initial absorbance (measured at time zero) and the absorbance at a given time point by the initial absorbance. Each time point corresponds to the average of the data collected from 4 biological replicates, with the error bars representing the standard deviation of these data. Statistical significance was assessed by Kruskal-Wallis tests followed by Dunn’s multiple comparisons. *p < 0.05; **p < 0.01.
Pigment analysis
The content of photosynthetic pigments in the cells (determined by extraction and spectrophotometry) appeared to be less affected by the microgravity condition. Nevertheless, the amounts of light harvesting pigments, chlorophyll and carotenoids, normalized to the dry weight, were lower in cultures grown in simulated microgravity conditions. The difference in phycocyanin between the control cultures and the simulated microgravity cultures is 16% at the same point in time, and 13% between the two conditions at the same OD770nm (Fig. 6). The differences in allophycocyanin and chlorophyll are more pronounced. Specifically, for allophycocyanin, the difference between the control cultures and the cultures in the simulated microgravity condition is 23% at the same time point, and 28% at the same OD770nm (Fig. 6). For chlorophyll, these differences are at 20% and 23%, respectively (Fig. 6). Nevertheless, these differences were not found to be significant. The carotenoids analysis (Fig. 6) revealed a significant difference of 26% between the control and simulated microgravity cultures when compared at the same time, and a difference of 24% when comparing them at the same OD (ns). The p-value for the comparison between the control and RPM at 72 hours was 0.024. On the other hand, the comparison between the control and RPM at 96 hours yielded a p-value of 0.118, which is not statistically significant, but still indicating a trend. In contrast, the comparison between RPM at 72 hours and 96 hours resulted in a p-value of >0.999, confirming no significant difference. In addition, the quantum yield analysis (Fig. 7) revealed a significant increase between RPM 72 h and RPM 96 h.
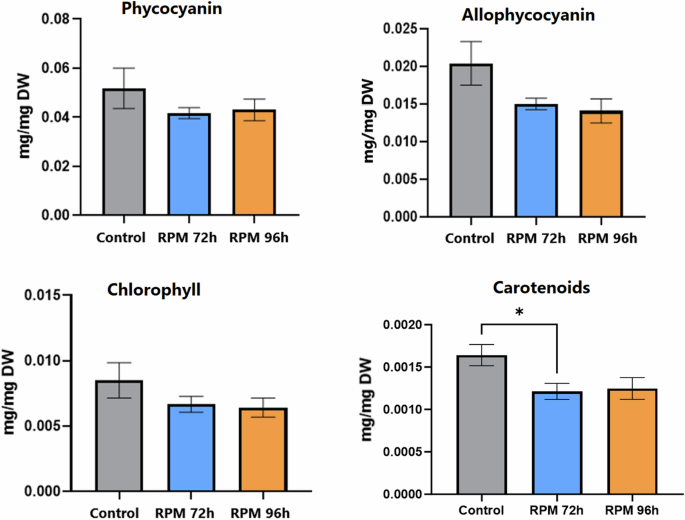
Each time point corresponds to the average of the data collected from 4 biological replicates, with the error bars representing the standard deviation of these data. Statistical significance was assessed by Kruskal-Wallis tests followed by Dunn’s multiple comparisons. *p < 0.05; **p < 0.01.
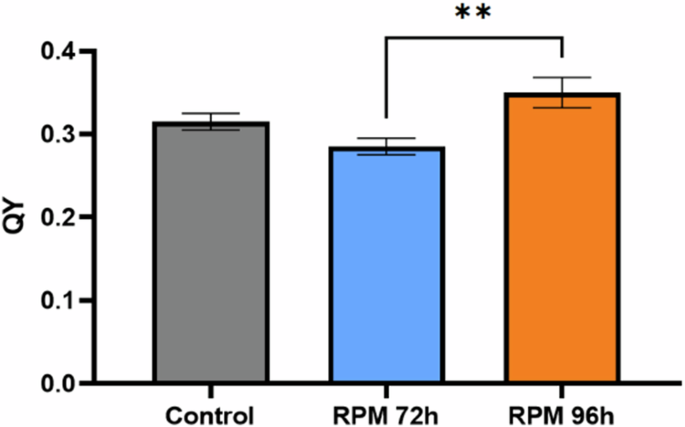
Each time point corresponds to the average of the data collected from 4 biological replicates, with the error bars representing the standard deviation of these data. Statistical significance was assessed by Kruskal-Wallis tests followed by Dunn’s multiple comparisons. *p < 0.05; **p < 0.01.
Proteomics analysis
The simulated microgravity cultures were stopped at two different time points, to compare them at the same culturing time (72 h) and at the same culture density (96 h) that was reached later in the RPM cultures since they were growing slower. The extracted proteins resulted in a concentration of 1.23 ± 0.20 µg/µl for the RPM 72 h, 3.04 ± 0.14 µg/µl for the RPM 96 h and 3.32 ± 0.50 µg/µl for the control. LC-MSMS identified and quantified 1,281 proteins of L. indica PCC8005 which corresponds to ca. 20% of the theoretical proteome. Among these, 255 proteins were differentially expressed in cultures that were stopped at the same optical density as the control (96 h). This group was divided into 120 proteins that were upregulated and 135 proteins that were downregulated. The analysis showed 98 differentially expressed proteins in the ones stopped at 72 hours with 28 upregulated and 70 downregulated proteins (Fig. 8). Among the total upregulated proteins, 20 were found to be consistent between the cultures that were sampled at the same time and those stopped at the same optical density. Meanwhile, among the downregulated proteins, 50 were identified in both conditions.
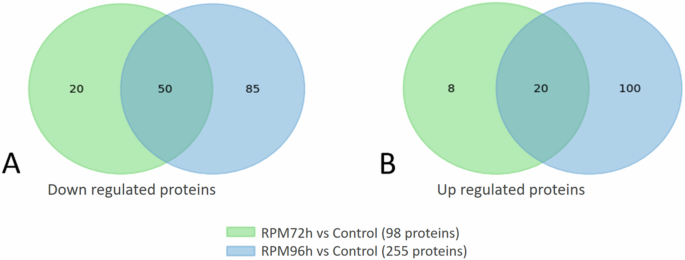
Downregulated (A) and upregulated (B) proteins between same time (RPM 72 h) and same optical density (RPM 96 h).
When examining the differentially expressed proteins, they were categorized into seven groups, based on their function, as presented in Table 1. These groups included 3 proteins connected to the carbon fixation, 6 proteins linked to the glucose metabolism, 14 photosystems proteins, 12 phycobilisome proteins, 11 proteins involved in the electron transport chain and ATP synthesis, 5 proteins which are nitrate related, 4 proteins related to signaling, 1 protein associated with carotenoids, 11 50S ribosomal subunits and 3 proteins related to gas vesicles. Further investigation was conducted on these groups, comparing them with metadata and existing literature to understand the influence of one group on the other (Fig. 9).
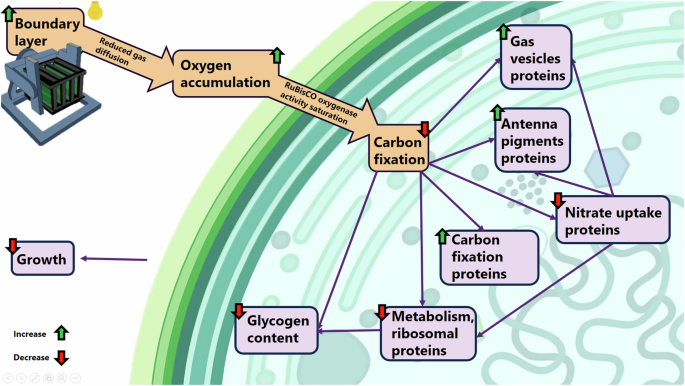
Graphical summary of the main results illustrating the impact of simulated µG on L. indica. Background figure created with BioRender.com.
Discussion
The oxygenic cyanobacterium L. indica was successfully grown under simulated microgravity conditions in an continuously illuminated batch culture using a custom-built system accommodating a light and gas permeable cell culture bag in an in-house printed holder fitting the Random Positioning Machine (RPM). The light and gas permeable cell culture bags were essential in this setup, as preliminary experiments indicated that disposable 50 ml Rotating Wall Vessel (RWV) culture vessels21,24, were not suited for simulating microgravity conditions in cultures of such photosynthetic organism for continuous oxygen production. In the disposable 50 ml HARV vessels, the produced oxygen gas remained trapped, forming large bubbles separating from the liquid medium inside the vessel, creating a biphasic gas/liquid culture (data not shown). When the HARV vessel is then turning vertically in 2D, such large gas bubbles are inducing mixing of the liquid culture28, while the purpose was to keep the low shear rate conditions in the liquid cell suspension typical of the microgravity environment29.
In our experimental setup, both the normal gravity control and simulated microgravity RPM cultures had the same culture medium composition allowing batch growth of this strain well above 1 g DW/L30 (i.e. Zarrouk with a source of bicarbonate and nitrate in excess) and were exposed to the same average light flux (45 μmol photons m−2 s−1), same ambient temperature, air composition, air pressure and ventilation, when run parallel in the same incubator. Still, simulated microgravity impacted significantly the biomass production and biomass composition of the photosynthetic cyanobacterium L. indica. The growth rate was significantly reduced in simulated microgravity conditions, compared to the control 1 G setup. A significant growth rate reduction can usually be explained by a substrate limitation, such as for example less light or less C or N. As sampling was done at similar cell densities (0.933 g/l for the control and 1.054 g/l for the RPM 96 h), there is no limitation in light or carbon or nitrogen nutrient supply and no specific difference between the RPM (96 h) and the control (72 h) setup, to be expected. Carbon is present in excess as bicarbonate (~0.2 g L−1 HCO3−) in the Zarrouk medium. At the sampling points, the pH of the growth medium was also well below pH of 10.35 (Supplementary Fig. 3), indicating no CO2 limitation in the bulk medium. Even at pH of 10.35, at which the carbonates in the liquid Zarrouk medium and atmospheric CO2 are in equilibrium31, there would still be C supply as CO2 would be absorbed from the atmosphere into the medium via the gas permeable culture bag wall. A significant growth rate reduction in RPM cultures could also be due to metabolite accumulation and inhibition. A potential cause of a lower biomass production is growth inhibition due to high oxygen partial pressure in the liquid medium and inside the cells. This would be a direct effect of a less efficient oxygen release under simulated microgravity conditions. At elevated concentrations and partial pressures in the liquid and in the cells, oxygen competes with carbon dioxide for fixation by the ribulose-1,5-bisphosphate carboxylase/oxygenase (RuBisCo) enzyme inside the cells32. A higher oxygen concentration would result in a less efficient CO2 fixation, and therefore a lower biomass production rate33,34. A previous study in our laboratory has shown that oxygen inhibition can occur in closed vials at low light intensity (32 µmol photons m−2 s−1) and high carbon concentration (~0.2 g L−1)35. It was demonstrated that Limnospira indica PCC 8005 (mixture of linear and curly morphotypes) tolerated pure 100% oxygen partial pressures up to 1 bar pO2, but that at 1.5 bar pO2 the growth of Limnospira indica PCC 8005 was significantly inhibited, increasing the lag phase and decreasing the specific growth rate. It was also reported that the L. indica PCC8005 cells exposed to higher oxygen concentrations, excreted more glycolate into the medium, as glycolate is a byproduct of oxygen interaction with RuBisCo36. However, oxygen concentration up to 1.5 bar pO2 did not affect the morphology or the photosynthetic apparatus (as detected by fluorescence assays) of the growing cultures. Thus, an inhibition by elevated O2 in the medium and cells under simulated microgravity could be the cause for the decrease in growth rate. Glycolate measurements could be added as additional analysis in future simulated microgravity experiments. This could give further insights on the inhibition of carbon fixation by O2, in such low shear environment.
The proteomic analysis provided further insight on the reasons for the reduced growth rate. The proteomics analysis permitted the identification of 1281 proteins of L. indica PCC8005, which corresponds to ca. 20% of the total theoretical proteome on the MaGe platform37. Previous proteomics studies on the same strain L. indica PCC 8005 have led to comparable numbers of identified proteins38,39,40,41. The upregulation of the RuBisCO and carboxysome proteins in the RPM grown cultures (Table 1) suggests a cellular response to improve carbon fixation efficiency and rate. Carboxysomes are polyhedral proteinaceous microcompartments that encapsulate the primary CO2-fixing enzyme RuBisCO and create a unique subcellular environment that promotes activity of the Calvin–Benson (CB) cycle in cyanobacteria. These microbodies are part of a CO2-concentrating mechanism (CCM), operating together with active CO2 and HCO3− uptake transporters which accumulate HCO3− in the cytoplasm of the cell. Bicarbonate is actively taken up from the medium and transferred to the cytoplasm inside the cell via Na+/ HCO3− symporters and SbtA transporters in the cell membrane42. These bicarbonate transporters have not been detected in this study. Cyanobacteria actively take up HCO3− from the media or convert CO2 into HCO3− in the cell in order to concentrate the carbon source in the cytoplasm43, since HCO3− is about 1000 times less permeable to lipid membranes than CO244. Some cyanobacteria can use either CO2 or HCO3− and in the carboxysomes, the HCO3− is converted back to CO2. In this process CO2 and Ribulose-1,5-bisphosphate react together, with the help of the RuBisCO enzyme, forming 3-phosphoglycerate (3-PG), which is finally converted into sugar. The carboxysome structure works as a diffusion barrier to CO2 leakage and lets HCO3− and Ribulose-1,5-bisphosphate into the structure45. Due to the lack of local internal mixing in both the RPM and control groups, it is possible that cells experience a local depletion of nutrients or accumulation of waste products around the cell46,47. As mentioned, CO2 is provided in the form of dissolved bicarbonate (Zarrouk medium, pH 9.5), in excess in the bulk liquid. Oxygen gas is much less soluble in liquid than CO2 gas and can fast accumulate to higher local partial pressure around the cells and in the bulk liquid. It is thus possible oxygen partial pressure was high in liquid medium in the test setup. Bubble formation was indeed observed in both the RPM and control cultures, requiring manual intervention and extraction to remove them. As biomass production, and therefore also oxygen production rates were higher in the control cultures, bubble formation appeared faster in the control cultures (data not shown). The RuBisCO enzyme of cyanobacteria fixes efficiently CO2 on C3 carbon backbones, but it has significantly less affinity for CO2 uptake, thus is binding less strongly the CO2, than the RuBisCO of plants43. The affinity of the RuBisCO enzyme for CO2 and the sensitivity for oxygen is very strain dependent. If intracellular CO2 concentrations are low (due to local limitation or inefficient uptake) and/or oxygen concentrations are high, RuBisCO-catalyzed oxygenation is triggered, leading to production of the non-useful carbohydrate 2-phosphoglycolate. Oxygenation results in a loss of energy because energy is needed to degrade the product 2-phosphoglycolate, a process which also produces CO2 and NH3. Oxygenation can consume a large fraction of the net photosynthetic generated energy in cyanobacteria48. It would decrease net carbon assimilation at the level of the RuBisCO enzyme and, therefore, the photosynthetic growth rate49. Based on the GO analysis, the downregulation of the glucose metabolic processes and the ribosomal proteins could indeed suggest a general downregulation of the assimilatory metabolism of the cells (Table 1). A reduced CO2 fixation would also lower the production of carbon stocks such as glycogen, a form of reduced carbon (C) storage45,50, glycogen was indeed measured in lower concentrations in the RPM samples. Overall, such a decrease in carbon absorption would result in slower growth, as observed in the experimental data (Fig. 1).
Proteomic analysis revealed a downregulation of nitrate uptake transport via the NrtABCD proteins (Table 1). NrtABCD proteins are specifically linked to CO2 fixation and nitrate uptake51,52. Downregulation of nitrogen transport in Synechocystis 6803 was shown as result of carbon limitation to maintain the right balance of carbon and nitrogen53. The downregulation in nitrogen uptake is a response of the cells that have an excess of nitrogen compared to the available carbon and seek to reduce uptake. In our case, the internal nitrogen source, could potentially be provided by the NH3 produced from the 2-phosphoglycolate degradation process. An excess of nitrogen can potentially be incorporated into light harvesting pigment proteins, serving as a nitrogen stock54. Despite the signs of reduced carbon fixation and nitrate uptake, and overall reduced metabolic rate, a higher abundance of photosynthesis proteins and light harvesting phycobiliproteins was observed also in the GO analysis of the proteomic data (Table 1).
However, an alternative to phycobiliproteins as nitrogen storage in cyanobacteria is cyanophycin55,56, which increases under phosphorus limitation57. The proteins of cyanophycin metabolism, CphA and CphB, were not significantly expressed in our samples. In addition, Deschoenmaeker et al. 39 discovered that L. indica PCC8055, the strain used in our experiments, produces more cyanophycin when supplied with nitrate compared to when is supplied with ammonium. Our results suggest that the upregulation of the pigments may be a mechanism to counteract the decrease in pigment content due to the increased dissolved O2, as described in Marquez et al. 58, and the decrease in carbon assimilation, as explained in Ma and Gao59. Jahn et al. 60 found that the phycobiliproteins were upregulated at low light conditions. In our setup the samples for proteomic analysis were taken at the beginning of the batch culture (72 h & 96 h), when cell densities were relatively low and cells were exposed to abundant light (light-saturated conditions), and abundant electrons enter the electron transfer chain. In addition, for RPM 96 h the compared RPM and control samples were harvested at similar optical densities, and thus it is not expected that they experienced significant limitations or differences in light flux intensities. However, Jahn et al. 60 also explained how carbon limitation has smaller but similar effects as low light conditions on cyanobacteria. The connection between light limitation and carbon limitation in cells is strong, making it challenging to distinguish their individual effects.
Several gas vesicle proteins showed an upregulated expression in the simulated microgravity cultures at 96 hours compared to the control (Table 1). Gas vesicle proteins are involved in structural and auxiliary functions for the formation of gas vesicles61. The main upregulated gas vesicle protein was GvpC1, a shorter variant of GvpC, which was also upregulated. GvpC attaches from outside the vesicle to stabilize the structure61,62. Another significant protein typically found in gas vesicle structures is GvpA, but it was not identified in our samples. Given its relatively small size, spanning only 71 amino acids, GvpA is challenging to detect63. These protein results suggest a higher amount of gas vesicles in the RPM cells. It was indeed observed that the cultures harvested from RPM had a slower sedimentation under normal gravity (Fig. 5). Gas vesicles increase buoyancy and allow taxis toward air-liquid interfaces. In the test setup used, it is likely that a high oxygen partial pressure and gas-liquid emulsion was created, due to the constant production of small oxygen microbubbles by the cells in the culture medium. This may have increased significantly the gas-liquid interface in the culture, and potentially also the distribution of the surfactants and the liquid medium composition, which may have had an impact on the cells. There is a well-documented ecological connection between cell buoyancy and oxygen concentration and nutrient limitations61,64,65,66. In Serratia sp. strain ATCC 39006, the expression of genes for gas vesicle morphogenesis is stimulated in low oxygen conditions, thereby enabling its migration to the air–liquid interface and flotation67. It has been shown that ntrB/C and cheY-like regulatory genes participate in the morphogenesis of gas vesicles in Serratia67. The NtrBC proteins were also found to be highly expressed in the simulated microgravity grown cultures of L. indica.
All together these results suggested that L. indica cells have experienced a growth inhibition due to high oxygen partial pressure in the liquid medium and inside the cells, with oxygen competing with carbon dioxide for fixation at the RuBisCO enzyme, leading to a lower carbon assimilation and consequently lower biomass production when cultivated in low-shear simulated microgravity conditions (Fig. 9).
In terms of physical interpretation, the high oxygen partial pressure in the liquid medium and inside the cells in the simulated microgravity created by the RPM, is potentially due to a reduced oxygen transfer and release from the liquid in the simulated microgravity setup compared to normal gravity control. The gas transfer resistance is generally represented by a liquid stagnant boundary, of which the thickness characterizes the transfer resistance. Such boundary layer represents a slowdown of particles and the velocities of molecules account for the diffusion coefficient. The movement of the fluid in the vicinity of the walls determines the thickness of the boundary layer. In reduced gravity conditions, the shear rate is decreased due to the absence of natural convection. In addition, the microscale oxygen bubbles produced by the cells in the liquid medium (creating a kind of gas-liquid emulsion), potentially lead to a lower apparent liquid density (<1) of the culture medium so that the transient accelerations side effects of the RPM were mitigated and dampened, which contributed to the decrease of the shear rates and stresses. These effects likely lead to an increased thickness of the boundary layers and consequently to an increase of the transfer resistances and thus to a decrease of the gas transfer capacity. The obtained results suggest that the boundary layer is thicker in the RPM compared to the control affecting oxygen gas exchange. A thicker liquid boundary layer in the vicinity of cell and culture bag walls in the simulated µG, would result in a reduced oxygen gas exchange (1) from the cell interior over the cell membrane to the bulk medium, and (2) from the bulk medium over the culture bag membrane to the incubator atmosphere. Thus, a thicker liquid boundary layer will significantly influence the volumetric mass transfer coefficient (kLa) and the oxygen transfer rate (OTR) and thus how efficient oxygen is transferred from the medium into the gas bubbles and atmosphere, i.e. how much oxygen is released from the cultivated photosynthetic biomass. For successful photosynthetic oxygen production in space, good oxygen transfer is vital. The determination of the kLa and the OTR helps to optimize the bioprocess in bioreactors and ensure a successful scale-up process. The same is also valid for oxygen consuming bioprocesses, such as nitrification. Indeed, a similar effect was recently observed when cultivating nitrifiers using the same simulated microgravity experimental setup47.
It was suggested similar effects may have happened in the Arthrospira-B, an experiment of Limnospira growth in ISS, at the events when the liquid phase was likely not thoroughly mixed12,15,68. During the ARTHROSPIRA-B space flight experiment, Limnospira indica PCC8005 was exposed to microgravity and space irradiation for five weeks onboard the ISS, in an illuminated mixed batch culture at relatively low light intensity (35 µmol photons m−2s−1). It was shown that if the culture inside the photobioreactors was well mixed, the biomass and oxygen production rates and yields were not significantly different from the ones recorded in the parallel experiment in normal gravity on Earth. But the collected data, both from space flight and earth cultures, also suggested that in some cultures mixing was probably not optimal, which may have led to significantly lower biomass and oxygen production in those batch cultures15.
High oxygen concentrations are very common in production systems used for Limnospira, such as tubular systems and open ponds34. For example, in open pond, a maximum of 35 mg O2 L−1 can be reached69. Most of the time these cultures were exposed to high light intensities, in combination with high oxygen partial pressure. But photorespiration can also be induced in conditions of low light intensities, in combination with low carbon concentrations; then photorespiration can happen even with < 1 bar pO2. Experiments with cyanobacteria showed that photorespiration can be a main inhibitory factor for growth of Nannochloropsis sp. in conditions of sub-saturating light intensities (100 µmol*m−2*s−1) and low concentrations of inorganic carbon source (97.7 μM, via 2% CO2 enriched gas)70. But this is not the case in the (simulated) microgravity studies reported here, where cells were exposed to relatively low light intensities, with abundant bicarbonate in the bulk medium. Here, the aspect of closure and microgravity are key factors influencing oxygen inhibition. Investigation with closed photobioreactors for growing Arthrospira in space conditions showed that they can have pressure buildup rates of 0.07592 bar h−1 71. Others obtained 80 mg O2 L−1 in closed reactors72. Thus, when cultivating Limnospira in hermetically closed photobioreactors, operated under microgravity conditions, oxygen induced photorespiration becomes critical, and correct pressure monitoring and gas release systems, will be essential. Countermeasures to prevent oxygen inhibition should include efficient homogenous convective mixing in the culture medium at the surface of the gas exchange membrane, and low external oxygen atmosphere and pressures to increase diffusion gradients over the membrane at the gas exchange units.
In conclusion, the comparison between cultures exposed to simulated microgravity and normal gravity conditions, as revealed through both proteomic analysis and experimental data from the laboratory, highlights distinct physiological states for Limnospira indica. The advanced proteomic approach underscored the fact that more insights are gained when analyzing cultures under the same physiological conditions (i.e. growth state and cell concentration) rather than focusing on temporal aspects. The developed setup and collected data suggested a less efficient diffusive oxygen gas release from the liquid, caused by lower shear rates and a thicker stagnant liquid boundary layer over the cell membrane and culture bag membrane, in the simulated microgravity conditions. Moreover, the growth curves from these simulated microgravity experiments were reproducible in different moments in time. The observed boundary layer effects in the simulated microgravity experimental setup validate this setup using cell bags, mounted on an RPM, for approaching those effects and the consistent observable consequences in terms of growth rates, metabolic regulation and protein expression. This study also highlighted that inhibition due to high dissolved oxygen concentrations needs to be considered in the predictive modelling of biomass production process in the photosynthetic cultures in real microgravity conditions, also at low light intensity. Thus, it is crucial to add effective countermeasures to reduce such stagnant boundary layer to ensure steady growth rates, avoid extended cultivation durations and a divergent biomass composition, including reduced glycogen content. Finally making benefit of new RPM features, the cultivation of L. indica in simulated lunar and mars gravity conditions could be envisaged in the future.
Materials and methods
Test Strain and Inoculum preparation
Limnospira indica PCC8005, strain P3 of the SCK CEN collection, a straight filament morphotype, was axenically cultivated in modified Zarrouk medium73, in at least four biological replicates, at a temperature of 30 °C and under 45 µmol photons m−2s−1 white light (TL-D 18 W/840, Philips) at continuous 24/24 illumination without day/night regime. This light flux of 45 µmol m−2 s−1 is far below the typical saturating point for Arthrospira species in general and this strain (which is between 115-165 µE m−2 s−1)30,74, and thus can be considered as a relatively low light intensity, in combination with a relative high temperature and high carbon concentration. Before the experiment, the inoculum was grown in batch of 150 ml of culture in 250 ml Erlenmeyer flasks and continuously mixed via an orbital shaker at 120 rpm, at the same light intensity of 45 µmol photons m−2s−1 white light (TL-D 18 W/840, Philips) and also at continuous 24/24 illumination without day/night regime.
Statistical analysis
For statistical analysis, non-parametric tests were employed. Specifically, the Kruskal-Wallis followed by Dunn’s multiple comparisons test was utilized for comparisons involving three data sets, whereas the Mann-Whitney test was used for comparisons between two data sets. The significances are depicted on the graphs as follows: **p < 0.01, *p < 0.05, ns: Not significant. All statistical tests were performed using Graphpad Prism 9.
Experimental Culture setup for microgravity simulation
To simulate microgravity conditions with low fluid shear conditions, a random positioning machine (RPM) with a modified experiment platform was used. The latter consisted of a Polylactic Acid (PLA) frame (see Supplementary Fig. 1) designed and 3D printed in-house at SCK CEN, able to accommodate four cell culture bags (PL-70, Origen). The light- and gas-permeable culture bags are made of pure Fluorinated Ethylene Propylene (FEP) film, with a maximum volume of 145 ml, which was chosen to satisfy the volume and number of samples to be collected (see Supplementary Table 3). The culture bags were completely filled with liquid culture, with cell concentration for the first experiment of 0.086 ± 0.005 OD770nm and 0.094 ± 0.007 OD770nm for the second experiment, until full but without pressurization (i.e. at normal static liquid pressure of ca. 1 bar). The RPM was used in random speed mode, with a maximum frame speed of 60 degrees/sec and a minimum of 48 degrees/sec, resulting in an average gravity vector 0.009 ± 0.001 g over the course of the experiments. As control we used a Synthecon rotary cell culture system (RCCS) (Cellon, Luxembourg), also equipped with custom-built frames able to accommodate cell bags and rotating in horizontal plane at 25 rpm, as previously performed47. These frames differ from the RPM’s ones, because it can only support one cell bag each (n = 4 in total). In the reported experiments, the rotation of the cell bags, in both the RPM (in 3D, random to the gravity vector) and the RCCS control (horizontal in 2D, constant and perpendicular to the gravity), ensured that the culture and fluid as a bulk is similarly constantly moving and experiencing acceleration75. The RCCS and the RPM were placed inside a Binder KBWF 720 climate chamber (Analis SA, Belgium), heated by convective air at normal ambient atmospheric pressure (of ca. 1 bar absolute) and normal oxygen concentration (of ca. 0.21 bar pO2) allowing cultivation at 30 °C. The cultures were exposed to a continuous light flux intensity of 45 µmol m-2 s-1 (the distance of light source has been adapted to obtain the same light at sample level, see Supplementary Table 2). To ensure that the four replicates received a similar amount of light, the bags on the RPM were exchanged in position (internal and external) twice a day. The light intensity was measured using a LI-COR LI-193 spherical quantum sensor (CaTeC, The Netherlands) coupled with a LI-COR LI-250A light meter (CaTeC, The Netherlands), with the frame mounted onto the RPM. The mean of the 4 values of the light intensity obtained from measurements in 4 different positions was calculated (see Supplementary Fig. 2).
In experiment 1, for determining the growth curves of L. indica, sampling of the RPM and RCCS cultures was performed every day by sampling 1 ml of culture per bag that was then analyzed using flow cytometry technique (see Flow cytometry section), pH using a KCl pH electrode, InLab® (Mettler Toledo) and 770 nm OD measurement, using a spectrophotometer (NANOCOLOR® UV/VIS II, MACHEREY-NAGEL) to analyze 1 ml samples in semi-micro cuvettes Greiner Bio-One (Vilvoorde, Belgium). Gas bubbles were removed 5 times per 24 h, to ensure a suitable off-gazing of the culture. For that, the cultures were detached from the RPMs and RCCS for less than 5 minutes each time (totally max 25 min/24 h). This procedure was carefully performed to maintain the sedimented status of the RCCS control and the suspended status of the RPM experimental group. The amount of collected gas was recorded (see Supplementary Fig. 6), and it was not analyzed, but can be assumed to be mixture of O2, N2 and CO2, likely with an increased partial pressure of O2 and most probably with lower partial pressure of N2.
After achieving reproducible growth curves, a final experiment including whole proteome analysis was performed. For the latter, 2 RPMs were used with 4 replicate cultures each started at the same time and the one RPM with 4 cultures was stopped after 72 h, and the other with 4 cultures after 96 h. Fresh samples were analyzed for OD770nm, pH, dry weight, sedimentation index, quantum yield measurement and flow cytometry. Samples for pigments, glycogen and whole proteome analysis were centrifuged at 4 °C and the pellet was frozen at −80 °C until further processing.
Growth rate and generation time calculations
Growth rate (µmax) calculations were performed according to Fahrion et al. 30 using OD770nm measurements as approximation of biomass concentration. The growth curves were compared with both exponential and linear regression curves to find the best fit for the calculation of µmax. The RPM curve resulted to have a R2 value of 0.98 for the exponential regression and of 0.99 for the linear regression. While the control curve resulted to have a R2 value of 0.99 for the exponential regression and of 0.95 for the linear regression. Due to the small difference between the R2 values of the RPM curve and to be able to compare the growth rates, the exponential regression was used. For this, the data analysis toolpak in Excel 2016 was used. The biomass concentration was assessed at the sampling time point of the proteomics analysis. For this, the dry weight was determined by adding 2 mL of culture on pre-weighed membrane disc filters (water wettable PTFE, Pall Laboratory, pore size 45μm, ⌀ 25 mm). Afterwards, the filters were dried at 60 °C for 48 h and weighed again. This analysis was performed in triplicates for each culture, resulting in 12 values per condition. The generation time, t(G) also called doubling time, was calculated as ln(2)/µmax.
Pigment and glycogen extraction
Pigments and glycogen analysis were performed according to Fahrion et al. 30 using a frozen pellet collected from 2 ml of culture.
Carotenoids extraction
The extraction procedure involved adding 1 ml of 100% methanol to the frozen samples and subsequently heating them at 55 °C for 15 min using a heating block. The absorbance of the resulting supernatant was measured at 452, 665, and 650 nm using a spectrophotometer. To calculate total carotenoid content (CAR), we used the following equation:
where A452, A665, and A650 are the absorbance values at 452, 665, and 650 nm, respectively.
Flow cytometry
Flow cytometry measurements were performed using a BD ACCURI C6 flow cytometer (Beckton Dickinson, Erembodegem, Belgium) equipped with a blue (488 nm) and a red (640 nm) laser. An aliquot of 100 µl of Limnospira culture was run in fast mode using the following thresholds: 10,000 events in the forward scatter (FSC-H) and 800 in the fluorescent detector 4 (FL4-H), using the modified Zarrouk medium73 as blank background. FL3-H, associated to a 670 nm long pass filter and FL4-H, associated to a 675 ± 12.5 nm filter were used to quantify pigments autofluorescence, respectively chlorophyll a and antenna pigments (phycocyanin and allophycocyanin). Previous work in our laboratory reported the importance of a population (P1) in the total events count cytogram (see Supplementary Fig. 4), for the survival of a culture. More specifically healthy cultures were associated with a FL3-H to FL4-H ratio around 0.3 (indicative for the chlorophyll a /antenna pigments conc. ratio in the cells). If the FL3-H to FL4-H ratio is increasing to over 1, the culture is dying. In other words, cells containing more than approximately thrice the amount of antenna pigments compared to the amount of chlorophyll are more disposed to successful subculturing.
Quantum yield analysis
The effective quantum yield (QY) of PSII was measured to assess the photosynthetic performance and productivity of the cultures as previously described in Fahrion et al. 30
Protein extraction and quantification
The protein extraction was performed by dissolving a 15 ml culture cell pellet, in twice its volume of 2% SDS in 50 mM ammonium bicarbonate (ABC) solution. The mixture was vortexed for 3 × 10 seconds until the pellet was dissolved. The solution was transferred to a 1.5 ml tube and incubated for 5 minutes at 95 °C. After incubation, the tube was cooled on ice for 5 minutes, followed by a brief centrifugation. The sample was lysed using ultrasonication (4 × 10 s, amplitude 40%, 1 cycle, in between 1 min on ice) (Imlab, Boutersem, Belgium). After sonication, the sample was centrifuged for 20 minutes at 20817 g (14,000 rpm) and 4 °C. Finally, the supernatant was transferred to a new tube. The protein quantification was carried out using the BCA assay (Merck Life Science BV, Hoeilaart, Belgium) following the manufacturer’s instructions.
Mass spectrometry analysis of protein samples
Extracted proteins were further processed for LC-MS/MS analysis using the suspension trapping method, S-trap (Bioconnect, Huissen, The Netherlands) following the manufacturer’s instructions. Next, LC-MS/MS analysis was performed using a nanoElute UHPLC (Bruker Daltonics, Bremen, Germany) connected to a QTOF-MS instrument (Impact II, Bruker Daltonics, Germany) via a CaptiveSpray nanoflow electrospray source (Bruker Daltonics, Bremen, Germany). Samples were run in a random order to identify a potential batch effect. In total, 2 µg of tryptic digest (in solvent A) was injected onto a trapping column setup (300 µm x 5 mm, C18 PepMap 300, 5 µm, 100 Å; Bruker Daltonics, Bremen, Germany). Subsequently, peptides were separated using a C18 Reprosil AQ, 1.9 µm, 120 Å, 0.075 × 150 mm column operated at 40 °C (Bruker Daltonics, Bremen, Germany) at a flow rate of 0.2 µl/min. Gradient conditions were: 2–35% solvent B for 100 min; 35–95% solvent B for 10 min; and 95% solvent B held for 10 min (solvent A, 0.1% formic acid in water; solvent B, 0.1% formic acid in acetonitrile). Drying gas flow and temperature of the CaptiveSpray were set to 4 L/min and 180 °C, respectively, and nebulizer gas pressure was set to 0.4 bar. MS acquisition rate was set to 2 Hz and data have been acquired over a 150–2200 m/z mass range. In all the full-scan measurements, a lock-mass (m/z 1221.9906, Hexakis (1H, 1H, 4H-hexafluorobutyloxy)phosphazine) (Bruker Daltonics, Bremen, Germany) was used as internal calibrator.
Instant Expertise method (Compass ot of Series 4.1, Bruker Daltonics, Bremen, Germany) was used to select as many as possible of the most intense ions per cycle of 3 s MS/MS accumulation depended on the MS1 level. Threshold (per 1000 summation) absolute was 2500 cts (spectral rate of 2 Hz). Peptide fragmentation was performed with nitrogen gas on the most abundant and at least doubly charged to five charged ions detected in the initial MS scan. Active exclusion was performed after 1 spectrum for 0.50 min unless the intensity of the precursor ions was more than 3 times higher than in the previous scan. The mass spectrometry proteomics data is submitted to the ProteomeXchange Consortium76 via the PRIDE77 partner repository with the dataset identifier PXD045600 and 10.6019/PXD045600.
Mass spectrometry Raw data processing
All raw mass spectrometry spectra files were processed using MaxQuant software version 2.0.1.0 (Max-Plank Institute of Biochemistry, Department of Proteomics and Signal Transduction, Munich, Germany) and the proteins were identified with the built-in Andromeda search engine78,79. In total 12 raw files, with 4 replicates of each of three conditions (i.e. control normal gravity (NG), RPM 72 h, RPM 96 h), were processed in parallel. The database searches were performed against a database containing all Limnospira indica PCC 8005 protein sequences, downloaded from the MaGe platform37 on 2023-03-23. Default MaxQuant parameter settings were used: cysteine carbamidomethylation as fixed modification, and methionine oxidation and Protein N-terminal acetylation, as variable modification; False-discovery rate (FDR) cutoffs set to 1% on peptide, protein and site decoy level; trypsin as a digestion enzyme; 7 amino acids as minimum peptide length.
Normalization and initial filtering of proteomics data
The resulting proteins from MaxQuant with minimum 2 unique peptides, were retained and were processed to remove reverse hits and contaminants from the data, then intensities were transformed to log2 for further analysis. To remove the technical variation among replicates, median normalization on log2-transformed intensities was performed using an in-house Python script based on Kammers et al. 80 and Tyanova et al. 81. Missing values in the data were replaced by value from a normal distribution with settings width =0.3 and downshift =1.8. Protein differential expression was calculated using LIMMA R package81, based on the empirical Bayes moderated test-statistics. The expression was considered significant at a q-value < 0.05 and a fold-change greater than 1.5.
Protein functional annotation
The functional annotation was performed using topGO R package82 for GO (Gene Ontology) annotation.
Protein Group Annotation
The data were analyzed based on the fold change (FC) values. The comparison has been done with significantly expressed proteins detected in both SameOD and SameTime conditions. Initially, proteins were sorted based on fold change values, which revealed a high number of proteins with unknown functions. Further investigations on the protein annotations were performed using the MaGe platform37. Subsequently, an alphabetical order-sorting strategy was implemented to highlight potential protein operons as starting point for further data mining (Table 1).


Responses