Development and validation of a functional ex vivo paclitaxel and eribulin sensitivity assay for breast cancer, the REMIT assay

Introduction
Breast cancer (BC) is the most prevalent cancer among women worldwide1. Despite extensive research and advancements in diagnostics, selecting the optimal therapy for BC remains a challenge due to the high heterogeneity. BC can be categorized based on the expression of estrogen receptor (ER), progesterone receptor (PR), and human epidermal growth factor receptor 2 (HER2)2. Targeted treatments, including hormonal therapies and anti-HER2 treatment, have proven successful for tumors expressing PR, ER or HER2 receptors3. Triple-negative breast cancers (TNBCs), constituting approximately 10-20% of all BCs, lack expression of these surface receptors, however much improvement has been made to also improve therapy options for these patients4,5. Regardless of the progress made in the development of targeted treatment options, the therapy with cytotoxic drugs still remains the backbone of BC treatment. Unfortunately, not all patients benefit from chemotherapy, with 30% of TBNC patients that achieve full response after the treatment6. Common chemotherapy regimens for BC treatment involve anthracyclines (e.g. doxorubicin), taxanes (e.g. paclitaxel), alkylating agents (e.g. cyclophosphamide), antimetabolites (capecitabine), platinum agents (e.g. carboplatin) and microtubule inhibitors (e.g. eribulin), and combinations of these agents7,8. However, the lack of validated predictive biomarkers hampers the ability to predict the most effective chemotherapy for individual patients. Current research to find predictive biomarkers for BC treatment relies on gene and protein expression in cancer cells9, which aid in categorizing patients into risk groups but fall short in predicting chemotherapy responses.
To address the critical need for developing robust predictive biomarkers for response to chemotherapies, our previous work focused on the development of functional ex vivo assays to predict response to anthracycline10, cisplatin and docetaxel treatments11. Generally, these assays are developed in the pre-clinical setting and further clinically validated. Recognizing the growing demand for alternative assays in a clinical setting, we expand our research to eventually develop functional ex vivo tests for all clinically available chemotherapy regimens. In this study, the functional ex vivo test for two microtubule targeting agents (MTAs) with distinct mechanisms of action was developed and validated pre-clinically.
Taxanes (paclitaxel and docetaxel) are the most widely used taxane-based chemotherapies commonly employed in various cancer treatments, including breast cancer12. These drugs, effectively inhibit cancer cell proliferation by obstructing the process of mitosis13,14. Paclitaxel is able to bind to β-tubulin, thereby blocking the ability of microtubules to either grow or shorten15. Another MTA drug used in a clinical setting is eribulin. This FDA-approved chemotherapeutic, is utilized for patients with metastatic BC who have previously undergone anthracycline and taxane treatments16. Eribulin is a drug affecting cell division by inhibiting microtubule dynamics17. In contrast to other MTAs, eribulin affects only the growth of microtubules, leading to inhibition of mitotic spindle assembly during prometaphase18. However, not all patients respond to these treatments, making the development of sensitivity assays based on specific tumor features of high importance.
Our current study aims to develop the ex vivo functional sensitivity assays for paclitaxel and eribulin and validate these assays in mice in vivo. We first applied the docetaxel sensitivity assay developed by Ladan et al. 11 for paclitaxel and termed it the REMIT (REplication MITosis) assay. Next, the REMIT assay was validated for paclitaxel sensitivity testing by comparing the ex vivo sensitivity and the in vivo response in ten different mouse PDX models. Similarly, the REMIT assay was selected for eribulin-sensitivity assessment and validated by comparing the ex vivo sensitivity with the in vivo response of a representative PDX model.
Results
Paclitaxel treatment does not lead to direct tumor killing ex vivo
We previously observed that docetaxel treatment ex vivo did not lead to tumor death in primary tumors11. To investigate the response to paclitaxel treatment, ten different BC PDX models with known sensitivity to paclitaxel were tested in triplicate (Fig. 1). The relative number of replicating cells and cells in apoptosis, respectively, were determined after treatment with increasing concentrations of paclitaxel (1, 3, 6, 10, 18, 25 and 100 nM) for three days. In all ten tested PDX models, cancer cells continued to replicate after three days of paclitaxel treatment (Fig. 1a–d; Supplementary Fig. 2). No clear decline in cell replication that could be correlated with the known in vivo sensitivity was observed. Similarly, the levels of apoptosis after paclitaxel treatment based on the TUNEL assay did not show a clear induction of apoptosis in any of the models (Fig. 1e–h; supplementary Fig. 3). In some models, a slight induction of apoptosis was observed at higher concentrations of the treatment (e.g. HBCx-204), but this did not correlate with the known paclitaxel sensitivity in vivo nor to the ex vivo tested replication levels. Overall, paclitaxel treatment did not result in a specific decline in replication nor induction of apoptosis in all seven in vivo paclitaxel-sensitive models, confirming that paclitaxel treatment ex vivo for three days does not lead to direct tumor killing.

a Representative images of the EdU (pink) and DAPI (blue) channels for two selected PDX models: HBCx-204 and HBCx-39. b Combined EdU/DAPI results for each model separately relative to the control, with mean and SEM indicated. c EdU/DAPI replication results after paclitaxel treatment of two selected PDX models (HBCx-204 and HBCx-39). Each data point represents the percentage of replicating cells within one microscopic field of view; ten fields of view were analyzed for each of the three biological replicates. d Combined EdU/DAPI results divided in paclitaxel sensitive and resistant models. e Representative images of the TUNEL (green) and DAPI (blue) channels for two selected PDX models: HBCx-4B and HBCx-147. f Combined TUNEL/DAPI results for each model separately relative to the control by subtracting it from the TUNEL levels after treatment. Error bars represent the SEM. g TUNEL/DAPI replication results after treatment with paclitaxel of two selected PDX models (HBCx-4B and HBCx-147). Each data point represents the percentage of replicating cells within one microscopic field of view; ten fields of view were analyzed for each of the three biological replicates.
Paclitaxel sensitivity can be assessed by the REMIT assay
As paclitaxel did not affect the viability of the BC PDX models, we developed an alternative method – the REMIT assay. Paclitaxel affects microtubules and interferes with mitosis19. Therefore, we investigated the relative number of cells in mitosis (pH3) within a tissue slice with and without paclitaxel treatment, as previously described for docetaxel treatment11, by calculating the ratio, defined as the number of replicating (EdU-positive) cells divided by the number of pH3-positive cells. As expected, paclitaxel treatment resulted in an increase of the relative number of cells arrested in mitosis (Fig. 2a). The EdU/pH3 ratio declined when compared to the untreated sample in paclitaxel-sensitive (e.g. HBCx-4B), but not in resistant (e.g. HBCx-39) PDX tumors at a relatively low paclitaxel concentration (Fig. 2b and c), indicating that in sensitive tumor cells the cell cycle is blocked in mitosis. To set appropriate thresholds for sensitivity assessment, the results of the EdU/pH3 ratio for all tested PDX models were combined. The relative EdU/pH3 was calculated by comparing the treated EdU/pH3 levels with the untreated control. Based on the ex vivo data, ten tested PDX models were categorized into ex vivo paclitaxel sensitive and resistant tumors, respectively. The cut-off relative EdU/pH3 value at 10 nM of paclitaxel, chosen to be the most discriminating, was 45%, with values above 45% considered resistant and below sensitive (Fig. 2d). To compare the ex vivo predicted paclitaxel sensitivity with the in vivo sensitivity of these tumors tested in mice, the tumor growth inhibition was determined for each of the models, separately (Supplementary Fig. 4). Based on the TGI values the models were categorized between in vivo sensitive and resistant tumors (Fig. 2e). The ex vivo and in vivo sensitivity to paclitaxel was compared, and the concordance between the predictive paclitaxel ex vivo assay with the known in vivo respond was determined to be 90% (Fig. 2f). One out of the ten tested BC PDX models (HBCx-216) showed sensitivity to paclitaxel in vivo, but resistance ex vivo. This assay has previously been developed using clinical material for docetaxel sensitivity11. Additionally, a group of primary tumors has been tested in this study for paclitaxel sensitivity using the REMIT assay (see supplementary Fig. 5), showing that this assay also works on clinical material.
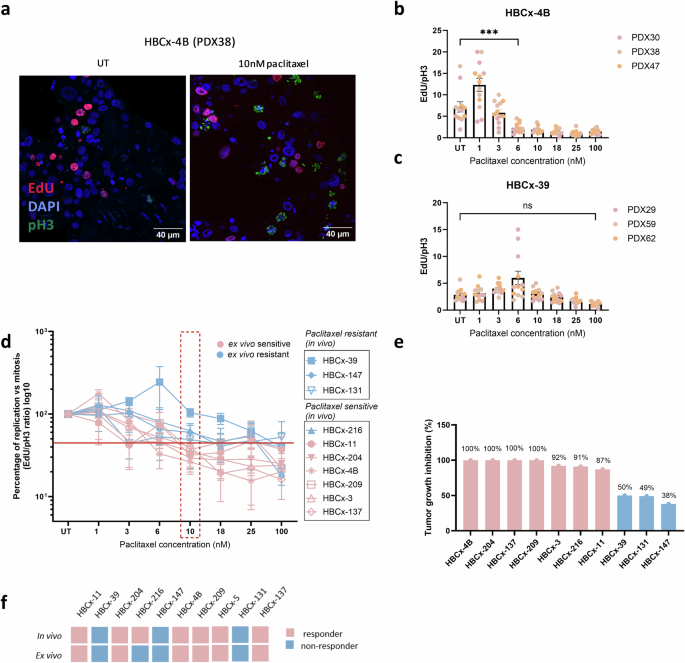
a Confocal image of the DAPI (blue), pH3 (green) and EdU (pink) immunostaining showing an increase in the number of mitotic cells after paclitaxel treatment in HBCx-4B. EdU/pH3 ratios of HBCx-4B (b; paclitaxel-sensitive) and HBCx-39 (c; paclitaxel-resistant), experiments performed in triplicate. Each data point represents a microscopic field of view analyzed, with 3-5 fields of view measured per replicate. Error bars represent the SEM, significance of the differences is indicated with significant results showed with stars and non-significant with ns. d EdU/pH3 ratios normalized to the control sample of all tested PDX models, representing the thresholds applied to distinguish between sensitive and resistant models. All models were tested in ns =3 for all concentrations, except of HBCx-137 were the concentration of 1 and 25 nM of paclitaxel was included in ns=2. Error bars represent the SEM. e Results of the tumor growth inhibition in mice in vivo after treatment with paclitaxel. Models are categorized between sensitive and resistant based on the percentage of TGI. f Schematic overview of the ex vivo paclitaxel sensitivity results and their concordance with the in vivo sensitivity tested in mice.
Eribulin treatment ex vivo lowers replication rate but does not induce apoptosis
To extend the ex vivo assay we aimed to develop an eribulin-sensitivity assay using the BC PDX models. For this purpose, the ten PDX models used for paclitaxel assay development were treated for three days with a range of eribulin concentrations. To find the most optimal read-out for eribulin sensitivity the levels of replication (EdU), apoptosis (TUNEL) and mitosis (pH3) were analyzed after treatment. Again, no clear decline in replication after eribulin treatment was observed in six of the models (Fig. 3; supplementary Fig. 2c). In contrast to paclitaxel, eribulin treatment resulted in a decline in replication in four of the tested models (Fig. 3a–c). A significant decrease in replication was observed for HBCx-204 (37%) and HBCx-4B (75%) at 3 nM, for HBCx-137 (27%) at 1 nM eribulin; and for HBCx-11 (71%) at 25 nM. Two models (HBCx-209 and HBCx-147) showed a significant decline in replication at 10 nM, but the levels increased again at higher concentrations, suggesting the influence of heterogeneity between slices rather than a specific effect on cell viability (Supplementary Fig. 2c). To determine whether the observed decline in replication in HBCx-204, HBCx-4B, HBCx-137 or HBCx-11 was related to direct tumor killing, the TUNEL assay was performed to measure the levels of apoptosis (Fig. 3d–f). Overall, no significant differences in the levels of apoptosis were observed after eribulin treatment in the tested PDX models. In conclusion, no clear effect of eribulin treatment on cell viability was observed that could be applied to use the EdU and TUNEL assays for sensitivity assessment. This shows that, similarly to paclitaxel, three-day eribulin treatment ex vivo does not lead to direct tumor killing.
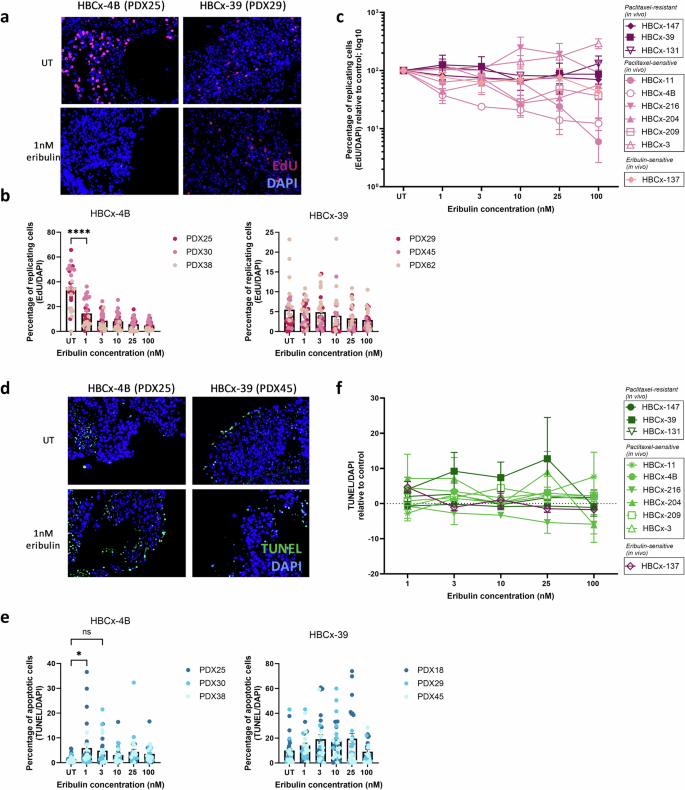
a Microscopic images of EdU (pink) and DAPI (blue) channels for two selected models: HBCx-4B and HBCx-39. b Quantification of HBCx-4B and HBCx-39 proliferation. Each data point represents quantification of the percentage of EdU positive cells within one microscopic field of view; ten fields of view were analyzed per condition in triplicate. Error bars represent SEM. c Combined results of the EdU/DAPI percentage normalized to the untreated sample for each model separately. Error bars represent SEM. d Microscopic images of TUNEL (green) and DAPI (blue) channels for two selected models: HBCx-4B and HBCx-39. e Quantification of HBCx-4B and HBCx-39 TUNEL staining. Each data point represents quantification of the percentage of cells in apoptosis within one microscopic field of view; ten fields of view were analyzed per condition in triplicate. Error bars represent SEM. f Combined results of the TUNEL/DAPI percentage normalized by subtracting the TUNEL levels from the untreated sample for each model separately. Error bars represent SEM.
Eribulin sensitivity can be predicted by the REMIT assay in treated tissue slices
Similarly to paclitaxel treatment, the decline in replication observed after eribulin treatment ex vivo did not show sufficient differences among the tested models to develop a sensitive ex vivo assay. Combined with a lack of apoptosis induction, we conclude that an alternative read-out will be more promising to assess eribulin sensitivity. Therefore, like for paclitaxel treatment, the REMIT assay was selected to assess whether inhibition of mitosis (a decrease in EdU/pH3 ratio) might be a suitable read-out. BC PDX tissue slices were treated with eribulin for three days after which the levels of the EdU/pH3 ratio were investigated in all ten BC PDX models (Fig. 4). The in vivo sensitivity to eribulin was tested only for the HBCx-137 model, showing its sensitivity to the treatment (Fig. 4c). This model was considered representative for eribulin sensitivity. The ratio between the number of EdU- and pH3-positive cells was calculated and normalized by calculating the percentage of the ratio after treatment relative to the control. Each model was plotted separately to apply appropriate thresholds (Fig. 4a, b). Based on the response of the HBCx-137 to eribulin treatment, the concentration of 1 nM of eribulin was selected as the most optimal to distinguish between eribulin sensitive and resistant models (Fig. 4b). Samples that showed the normalized EdU/pH3 value above 45% after treatment with 1 nM eribulin were considered resistant and below 45% sensitive. Considering, that eribulin treatment has been shown effective for treatment of a fraction of the paclitaxel-sensitive patients20, we investigated whether any correlation can be seen between the sensitivity to paclitaxel and eribulin ex vivo. Here we show, that seven of the tested models displayed the same sensitivity to paclitaxel and eribulin treatment based on the REMIT assay (Fig. 4d). Models HBCx-11 and HBCx-3 showed differences between treatments with sensitivity to paclitaxel and resistance to eribulin. Model HBCx-131 reacted resistant to paclitaxel treatment ex vivo and in vivo, however it showed sensitivity to eribulin.
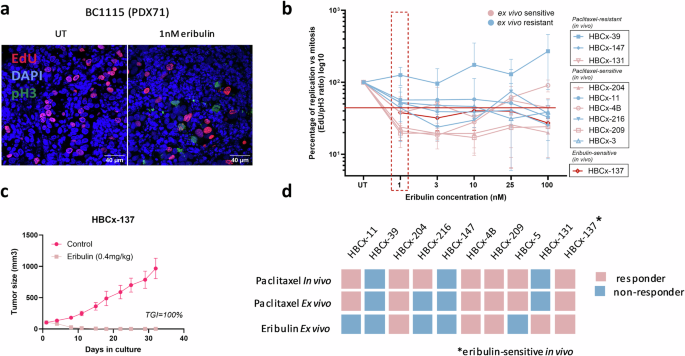
a Representative images of the pH3- (green) and EdU-positive (pink) cells with and without eribulin treatment for the HBCx-137 PDX model (eribulin-sensitive in vivo). b EdU/pH3 results normalized to the untreated samples of all tested PDX models, representing the thresholds applied to distinguish between sensitive and resistant models after treatment with 1 nM of eribulin. Models represented in the graph were treated in triplicate (except for HBCx-216 at 25 nM, and HBCx-209 at 25 and 100 nM, both treated twice). Error bars represent the SEM. c Results of the in vivo eribulin treatment of the HBCx-137 PDX model, representing the measurements of the tumor size in mm3 over the time in culture. Error bars represent the SEM. d Schematic overview of the ex vivo and in vivo paclitaxel sensitivity results and their correlation with the ex vivo sensitivity to eribulin. The average response combined from triplicate results is represented. The in vivo sensitivity to eribulin is known for the HBCx-137 model, as depicted in the figure.
The REMIT assay is a sensitive and reproducible method for the assessment of paclitaxel and eribulin sensitivity
We analyzed the reproducibility of the REMIT assay for paclitaxel and eribulin sensitivity, to determine whether both assays are potentially suitable for clinical application. For that purpose, the individual replicates of the tested PDX models were considered as separate tumors and scored individually for both paclitaxel (Fig. 5a) and eribulin (Fig. 5b) sensitivity. Next, the percentage of correct scoring within each model was assessed and the reproducibility of the test was calculated. The REMIT assay was calculated to have 80% reproducibility for paclitaxel, and 83% for eribulin testing. For paclitaxel, the reproducibility of the assay based on the in vivo and ex vivo correlation was additionally calculated and scored at 70% (Fig. 5c).
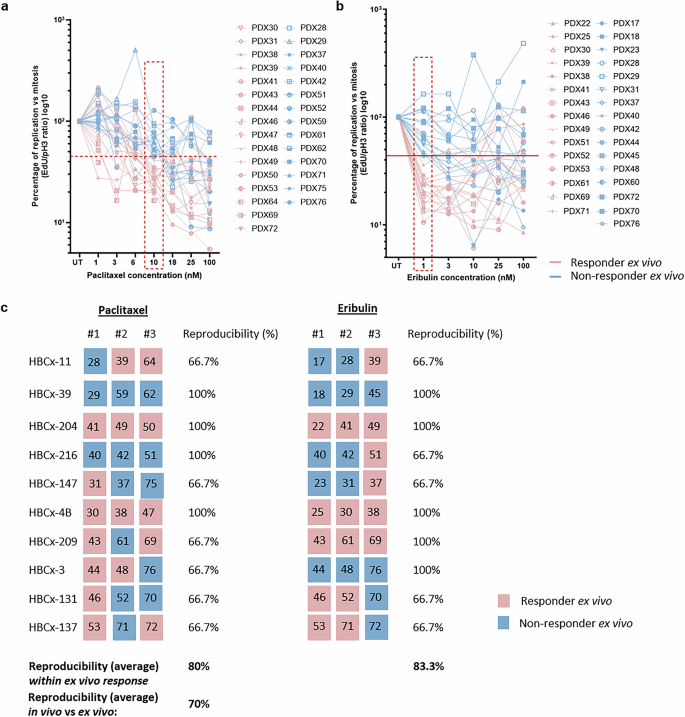
All replicates from the tested PDX models plotted and scored separately for paclitaxel (a) and eribulin (b) sensitivity. Thresholds applied in the graphs are the same as depicted in Figs. 2 and 4, respectively. Blue lines represent replicates scored as resistant to paclitaxel and pink as sensitive to paclitaxel treatment. c Schematic overview of the scoring performed for each of the PDX replicates separately with the division between the models. Calculations represent the reproducibility of the assay for each models separately and an average value for paclitaxel and eribulin assay. For paclitaxel, the reproducibility based on the correlation between in vivo and ex vivo sensitivity was also calculated. Numbers within the colored squares represent the PDX replicate included in the analysis.
Discussion
In this study, the REMIT assay was further developed and validated to assess ex vivo sensitivity to paclitaxel and eribulin in BC. The paclitaxel assay was validated with in vivo response in mice for all ten tested models, showing 90% correlation. The novel eribulin assay was developed using the same PDX models, out of which one model was tested for eribulin sensitivity in vivo, which was used as a representative model for assay development. Out of the ten tested models, seven showed overlap in the sensitivity to both paclitaxel and eribulin.
To meet the pressing clinical need for functional assays for chemotherapy response prediction, we aimed to extend the previously developed sensitivity tests10,11 with a paclitaxel sensitivity assay. As indicated, the concentration range used for paclitaxel sensitivity testing was based on the docetaxel sensitivity assay described in our previous study11 (1–100 nM), with addition of intermediate concentrations (3, 6, 18 and 25 nM). Direct comparison of these concentrations to paclitaxel levels achieved in patients is challenging due to differences between the in vivo drug bioavailability and the ex vivo exposure to the treatment. Different clinical studies report various maximal plasma levels (Cmax) that can be achieved in patients, mostly in the micromolar range21,22. Nevertheless, the levels achieved after the peak concentration return to the range applied in this study within 24 hours23. As the block in mitosis is expected to be reversible when paclitaxel concentrations drop, the levels over a more extended period might be the most relevant parameter for the effect in the patient. Therefore, we believe that the range of 1–100 nM paclitaxel has relevance for the in vivo situation.
We did not find a clear effect of paclitaxel on the survival of tested PDX tumors, confirming that paclitaxel treatment does not lead to cell death induction in the tissue slices cultured ex vivo within the three days of the experiment. This is in line with other findings in which the effect of paclitaxel treatment seems to vary between models, showing cell death induction in cell lines24,25 and no clear effect in ex vivo cultures26. To adapt the sensitivity assay to the ex vivo culture, we developed an alternative method to predict taxane sensitivity by measuring cells inhibited in mitosis11. Here, we validated this sensitivity assay by measuring the ratio between replication and mitosis (EdU/pH3), and comparing it with the in vivo response determined in mice. The concordance between the ex vivo and in vivo paclitaxel sensitivity reached 90%, confirming this to be a suitable functional test for treatment outcome prediction. Out of the ten tested models, only one PDX (HBCx-216) showed a clear difference in response, being sensitive to paclitaxel in vivo, but resistant ex vivo. This difference could be explained by a significant increase in the levels of replication observed after paclitaxel treatment in the HBCx-216 model (Supplementary Fig. 2b). This directly results in a higher EdU/pH3, regardless of changes in the levels of mitosis. For that reason, these two read-outs (EdU/pH3 and EdU/DAPI) should always be performed in parallel to exclude false-negative scoring. When moving forward to a clinical setting, this phenomenon should be further investigated and if increased levels of replication are detected in a significant number of tested samples, the method may have to be adjusted.
To extend our ex vivo chemotherapy response sensitivity assay we included eribulin treatment in the tested group of PDXs. Out of ten models included in the study, only the HBCx-137 model was tested in mice in vivo and scored sensitive for eribulin sensitivity. To select the most optimal read-out for eribulin, the levels of replication (EdU/DAPI), apoptosis (TUNEL) and relative mitosis (EdU/pH3) were assessed after the treatment. Similarly to paclitaxel treatment, no changes in the tumor cells survival that could be used for sensitivity assay were observed. The EdU/pH3 assay showed more pronounced differences among the models. Moreover, the in vivo eribulin-sensitive model HBCx-137 showed sensitivity to the treatment based on the EdU/pH3 read-out, validating the accuracy of the test. The EdU/pH3 test was chosen to categorize the models between ex vivo sensitive and resistant. As eribulin treatment is often used in patients with the initial response to paclitaxel20,27, we were interested to see whether any overlap in the sensitivity to paclitaxel and eribulin can be observed. We showed that seven out of ten tested models showed the same sensitivity to both treatments. Three out of ten tested models showed differences in the response to paclitaxel and eribulin, which is in line with a phase II clinical study where no correlation between the sensitivity to taxanes and response to eribulin was observed28. Considering that only one of the ten models used in this study was tested for the in vivo sensitivity to eribulin, the results presented in this report should be further confirmed in another PDX-based or clinical proof-of-concept study.
Although both paclitaxel and eribulin are chemotherapeutics that affect the function of microtubules, there are differences in their mechanism of action. Paclitaxel promotes the assembly of alpha and beta tubulin by binding to the microtubules, which in turn stabilizes them and disrupts cell division29. Eribulin, on the other hand, can bind to a unique site on the tubulin that results in a suppression of microtubule polymerization and sequestration of the tubulin into non-productive tubulin aggregates30. Due to the differences in the mechanism of action of these chemotherapeutics, eribulin is often used in the clinic for patients with paclitaxel resistance acquired during the treatment regimen. The EdU/pH3 assay could be used to predict the response to eribulin in the group of refractory patients28,31, to determine the potential of the treatment.
To determine the potential of the paclitaxel and eribulin assays the reproducibility was assessed and scored around 80%. The differences between replicates can partially be explained by the inter-tumor heterogeneity, which was also observed in the in vivo response to the treatment (Supplementary Fig. 4a). Models with a homogenous sensitivity to paclitaxel in vivo (HBCx-4B, HBCx-209 and HBCx-204), mostly showed analogous consistent sensitivity ex vivo (HBCx-4B and HBCx-204). The heterogeneity in one of the replicates of the HBCx-209 model (PDX61) may be explained by the EdU/pH3 values after treatment of this tumor that were close to the threshold border (48.9%). This confirms the robustness of the assay in positive scoring of paclitaxel-sensitive samples. Overall, we consider the reproducibility of the assay positive, considering the general heterogeneity present in the tumor models, however it should be re-assessed when moving towards a clinical setting in a proof-of-concept clinical study using fresh biopsy material derived from patients. The thresholds applied in the current study might have to be adjusted for the clinical setting, as the current threshold has been set using the PDX models. Furthermore, additional factors will influence the treatment response in patient material. The main challenge that can be encountered during the validation of the paclitaxel and eribulin assays in patient material is that the sample size is too small to catch heterogeneity between patients. Moreover, human components of the tumor microenvironment, including T- and B-cells missing in the PDX models, are present in patient material samples. Paclitaxel treatment has been shown to enhance anti-tumor response of the immune system in different ex vivo and in vivo models32,33 and was observed to increase the number of tumor-infiltrating lymphocytes in BC patients34. Therefore, the presence of the human tumor microenvironment can aid to better elucidate the systematic response of cancer cells to the treatment. All these factors should be taken into consideration during the initiation and assessment of the clinical validation trial for paclitaxel and eribulin sensitivity assays. Based on the preliminary data using primary breast cancer resection material (supplementary Fig. 5) and our previous work, we believe that these challenges can in principle be met without any changes to the protocols described here10.
In this study, two new ex vivo chemotherapy sensitivity assays were developed and validated in PDX tumors with known in vivo sensitivity to paclitaxel and eribulin. As no direct tumor killing was observed for both treatments ex vivo, the REMIT assay was determined to be the most suitable to accurately predict treatment outcome. The reproducibility of the REMIT assay was scored 80% for paclitaxel and 83% for eribulin, showing great potential for further clinical validation.
Methods
Patient-derived Xenografts and BC resection material
Ten different patient-derived xenografts (PDXs) of BC were established at the Institut Curie in Paris (Table 1), as described previously35,36,37. Paclitaxel and eribulin were administered at 20 or 25 mg/kg weekly by IP, and at 0.4 mg/kg weekly by IV, respectively. Tumor growth was evaluated by measuring two perpendicular tumor diameters with calipers twice weekly. Individual tumor volumes were estimated using two diameters a and b for simplification, as follows: TV= (a × b2)/2, where “a” is the largest diameter, and “b” is the smallest diameter. Tumor growth inhibition (TGI) was assessed by dividing median TV in the treated group by median TV in the control group at the same time (TGI = 100-TVtreated x 100 / TVcontrol))35. Tumors were considered sensitive to treatment when the TGI was above 80%, intermediate between 50% and 80%, and resistant below 50%. PDX models included in this study consisted of seven paclitaxel sensitive and three resistant tumors.
Residual primary breast cancer tissue was prospectively collected from patients undergoing wide local excision or ablation at the Erasmus MC Cancer Institute and Maasstad Hospital in Rotterdam, The Netherlands. Following the macroscopic evaluation of the surgical specimens by pathologists, fresh residual tumor tissue was collected for research purposes in compliance with the Code of Proper Secondary Use of Human Tissue in the Netherlands, established by the Dutch Federation of Medical Scientific Societies. This study was conducted in accordance with the ethical principles outlined in the Declaration of Helsinki. The need for written informed consent has been waived by the ethical committee, and patients who objected to the secondary use of residual tumor material for research were excluded from the study. This protocol was approved by the Erasmus MC Medical Ethics Commission (MEC-11-098).
Tumor Slicing, Handling and Drug Treatment Ex Vivo
BC PDX tissue samples were collected and preserved in customized breast medium, as previously described38. The PDXs tumors measured approximately 15 × 15 mm (+/− 2 mm) upon collection, corresponding to the final tumor volume observed in the in vivo experiments. The samples were then transported overnight on ice, which maintained the viability of the tumors (see Supplementary Fig. 1). Upon arrival, the PDX tumors were sliced using a Leica VT 1200S Vibratome (Leica Microsystems, Wetzlar, Germany). Tumors were embedded in 4% low melting agarose in PBS and 300 μm thick slices were generated. The tissue slices were subsequently cultured in customized breast medium at 37 °C in a 5% CO2 humidified incubator with continuous rotation (60 rpm) provided by a Stuart SSM1 mini orbital shaker (Camlab Ltd, Cambridge, UK).
To develop the drug-sensitivity assay, ten different PDX models were tested in triplicate for each chemotherapy concentration. The PDX tissue slices were treated with a range of concentrations of paclitaxel: 1, 3, 6, 10, 18, 25, and 100 nM (Sigma-Aldrich, St. Louis, MO, USA). These concentrations were selected based on the previously used concentrations of docetaxel in the study performed by Ladan et al. 11. Docetaxel and paclitaxel are chemotherapeutics with a similar mechanism of action39,40, however docetaxel has been shown to be more potent than paclitaxel41, with example concentrations in the clinical setting of 95 mg/m2 for docetaxel and 173 mg/m2 for paclitaxel42. Taking these values into account, we decided to use a comparable concentration range for paclitaxel testing as the one used in the docetaxel study11 (1–100 nM), and include additional intermediate concentrations (3, 6, 18 and 25 nM). As eribulin has previously been used in a similar concentration range to paclitaxel, but showed a higher potency of the treatment43, for better comparison between the treatments in our set up analogous concentrations were used consisting of 1, 3, 10, 25, and 100 nM (MedChemExpress LLC, Monmouth Junction, NJ, USA). The slices were then incubated for three days. To evaluate cell replication, 30 μM 5-Ethynyl deoxyuridine (EdU) (Invitrogen, Carlsbad, CA, USA) was added to the culture medium 2 hours before fixation. Following the incubation period, the tissue slices were fixed in 10% neutral buffered formalin for 24–72 hours at room temperature. Subsequently, the tissue was embedded in paraffin, and 4 μm sections were obtained for further analysis.
Immunostaining, image acquisition, and analysis
Immunostainings were performed for tissue replication, mitosis and apoptosis. For cell replication, a chemical click-it reaction was performed with Atto 594 (Invitrogen, Waltham, MA, USA) to visualize incorporated EdU molecules, as described before38. Cells in mitosis were visualized using the anti-phospho serine10 histone H3 antibody (pH3; 1/100 dilution) (Merck Millipore, Burlington, MA, USA) and the secondary Goat anti-Rabbit Alexa Fluor 488 (1/1000 dilution) (Thermo Fisher Scientific, Waltham, MA, USA) as previously described11. The pH3 and EdU stainings were combined and carried out simultaneously. To observe cells in apoptosis a terminal deoxynucleotidyl transferase dUTP nick end-labeling (TUNEL; In situ Cell Death Detection Kit; Roche Diagnostics, Basel, Switzerland) assay was performed, as described previously38. To visualize cell proliferation the monoclonal mouse anti-human antigen Ki67 antibody (clone MIB-1; M7240) (Agilent DAKO, Santa Clara, CA, USA) was used in combination with the secondary Goat anti-Mouse Alexa Fluor 488 (1/1000 dilution) (Thermo Fisher Scientific, Waltham, MA, USA).
Microscopic images were acquired using the Automated Upright Microscope Leica DM4000 B with a magnification of 200x (Leica Microsystems, Wetzlar, Germany). If possible, ten fields of view were imaged per condition. In the case of a small sample size, a minimum of six fields of view were acquired. Images were subsequently analyzed using the ImageJ software on the basis of a total number of pixels from red channel (EdU), the green channel (TUNEL) and the blue channel (DAPI). Next, the percentage of the EdU or TUNEL signal was calculated out of the total of the DAPI signal. For the analysis of the number of pH3- and EdU-positive cells, a manual quantification was performed. Four fields of view were analyzed per condition by counting the number of pH3-positive (mitotic) and EdU-positive (replicating) nuclei.
Statistics
The acquired data was statistically analyzed using Graph Pad Prism® version 9. A standard two-way ANOVA test was used together with Tukey’s multiple comparison test. P-values below 0.05 were considered significant. Unless stated otherwise, all experiments were performed in triplicate.

 and the impact of repeat biopsies")

Responses