Development of the psychopathological vulnerability index for screening at-risk youths: a Rasch model approach

Results
Item fit statistics
The infit and outfit statistics of all items were assessed. The infit ranged from 0.81 (c1) to 1.29 (i2), and the outfit ranged from 0.55 (b5) to 2.08 (f7). Following the criteria outlined in the Methods section, 35 items beyond the acceptable range of the infit and outfit were deleted57. Finally, a 22-item PVI was developed (see Table 1). As shown in Table 2, the remaining 22 items had acceptable infit and outfit mean square error (MNSQ) statistics that ranged from 0.80 to 1.20 and were close to 1.0, indicating that the observed response pattern fits the model.
Dimensionality and local dependence
Rasch principal component analyses for residuals (PCAR) revealed that the Rasch model estimates on the logit scale accounted for 34.46% of the variance in item responses. Meanwhile, the first contrast exhibited an eigenvalue of 1.92. These results indicated the underlying one-dimensionality construct.
Differential item functioning
The differential item functioning (DIF) results are shown in Table 2. No evidence of substantive DIF for any item by academic year or age group was found because the absolute values of freshman, senior, and age DIF contrasts were less than 0.5 logits between the comparison groups. This difference in t-values was insignificant. However, four items (j1, i3, j2, and f1) showed moderate sex differences because the absolute values of sex DIF contrast were all greater than 0.5 between the comparison groups. This difference in t-values was significant, indicating systematic biases favoring either males or females in responses. Specifically, item i3 was found to be significantly more challenging for males to endorse than for females, whereas items f1, j1, and j2 were significantly more difficult for females to endorse than for males.
Sources of validity and reliability evidence
The mean person location logit value (logit = 0.0036) indicated that the PVI was well targeted, with participants on average at a marginally higher level of psychopathological vulnerability than those tapped by the PVI items (0 logits). The person separation reliability was 0.78. The Cronbach’s alpha was 0.84. The PVI was positively correlated with the global severity index (GSI) T-score (r = 0.60, p < 0.001).
Latent class analysis results
Table 3 presents the fit statistics for the two- to six-class solutions identified using latent class analysis (LCA). The Akaike information criteria (AIC), Bayesian information criteria (BIC), and sample size–adjusted BIC (saBIC) continued to decrease across five classes, and the Lo–Mendell–Rubin (LMR) and bootstrap likelihood ratio test (BLRT) were significant for all comparators. The classification quality evaluated by the entropy and average latent class probabilities for the most likely class showed that among all solutions, the two-class solution was the highest, and the three- and four-class solutions were also adequate (entropy > 0.70; average latent profile probabilities > 0.80).
The three-class solution exhibited clearer boundaries than the two- and four-class solutions within the range of the PVI total scores. This situation allowed for meaningful and quantitative distinctions. Therefore, the three-class solution was adopted. For the three-class solution, the first class included 20.30% youths (n = 2278), the second class encompassed 46.68% youths (n = 5239), and the final class contained 33.03% youths (n = 3707). The three-class solution is presented in Fig. 1.

In the figure, the youth sample of 11,224 participants is divided into three distinct classes following a latent class analysis based on their PVI scores.
Receiver operator characteristic (ROC) results
ROC analysis indicated 4.50 and 10.50 as two cut-off points for distinguishing three classes. A cut-off point was determined to be 10.50, which corresponded to the maximum Youden index (96.15%) and an AUC value of 99.75% (95% CI: 99.71–99.79%; p < 0.001), indicating excellent discriminatory ability. Similarly, the cut-off point of 4.50 corresponded to the maximum Youden index (97.50%) and an AUC value of 99.76% (95% CI: 99.72–99.80%; p < 0.001), indicating excellent discriminative performance. Table 4 presents the diagnostic indices for the two cut-off points. Given that PVI is dichotomous (i.e., “yes” or “no”), its two cut-off points were determined to be 5 and 11.
The Kruskal–Wallis (KW) and post hoc tests, as presented in Table 5, further found significant differences in PVI scores among the three classes differentiated by the two cut-off points (p < 0.001). Consequently, the three classes were defined as the vulnerable class (PVI scores ≥ 11, 22.88%), medium-protection class (5 ≤ PVI scores < 11, 42.55%), and high-protection class (PVI scores < 5, 34.57%). Significant differences in SCL-90 scores were also observed among the three classes.
Further exploration revealed that the PVI outperformed the SCL-90 in terms of concurrent and predictive hit rates in two clinical samples, as reported in Table 6. In the concurrent sample, which consisted of data collected simultaneously with the PVI questionnaire, the PVI, and SCL-90 had concurrent hit rates of 36.00% and 28.00%, respectively, for identifying vulnerable youths with definitive diagnosis (n = 50) and 46.94% and 44.90%, respectively, for youths with provisional diagnosis (n = 49). Regarding predictive hit rates, in another sample diagnosed 1 year after the PVI questionnaire was administered, the PVI and SCL-90 had predictive hit rates of 37.50% and 28.13% for youths with definitive diagnosis (n = 32), respectively, and 53.57% and 46.43% for youths with provisional diagnosis (n = 28), respectively. In the overall diagnosis sample, the PVI and SCL-90 had hit rates of 36.59% and 28.05% for youths with definitive diagnosis (n = 82), respectively, and 49.35% and 45.45% for youths with provisional diagnosis (n = 77), respectively.
Discussion
This study developed a unidimensional 22-item PVI using the Rasch model. The cut-off points of 11 and 5 were identified to distinguish vulnerable and high-protection youths. At the sample level, the concurrent hit rates of the PVI were 36.00% and 46.94% for youths with definitive and provisional diagnoses, respectively. The predictive hit rates of the PVI were 37.50% and 53.7% for youths with definitive and provisional diagnoses, respectively. Psychometric evidence shows that the 22-item PVI has the potential to detect vulnerable youths.
Previously used composite instruments for screening symptoms, such as the Counseling Center Assessment of Psychological Symptoms-62 (CCAPS-62) and SCL-90, have been questioned. The CCAPS-62 was initially developed as a correlated eight-factor model19. A later study then identified two correlated second-order factors (r = 0.11, p < 0.01) in a college sample24. These studies highlighted the importance of thoroughly examining the higher-order structure of the CCAPS-62. Existing research attempted to evaluate psychological vulnerability on the basis of the total score of the individual items in the SCL-9058,59 or SCL-90-R60. However, such evaluation entails challenges. The SCL-90 is based on CTT, which is well suited for identifying structures but it is not a strict test of the summed scale score being a sufficient statistic61. A study based on Rasch analysis testing the dimensionality of the SCL-90-R suggested that the total score of the SCL-90-R is multidimensional and cannot be used as an overall indicator of psychological distress62. The PVI, developed based on the p-factor, provides significant advantages in elucidating psychopathological phenomena, primarily due to its ability to capture the shared variance among symptoms across various disorders and diagnostic domains20. A crucial interpretation that may enhance the understanding of the results of this study is that the p-factor reflects the influence of common etiological factors, including pleiotropic genetic effects, personality traits, and extensive environmental exposures51,52. For instance, a genetic p-factor has been identified that correlates with the risk of developing multiple mental disorders, such as bipolar disorder, post-traumatic stress disorder, and anorexia nervosa, with a single genetic factor potentially explaining 20–60% of the variance63. Building on this, ongoing research aimed at exploring how a general factor may drive the emergence of various symptoms and conditions can further enhance our comprehension of the findings presented in this paper. The mechanism, referred to as pleiotropy, posits that DNA variants may causally relate to multiple traits associated with psychopathology. Additionally, “mediated pleiotropy” describes how genetic factors can heighten the risk for one disorder, which subsequently leads to others. This framework also considers external influences, such as adverse life events, that initiate interaction processes within these networks52, as emphasized by the vulnerability–stress model. Furthermore, it is suggested that DNA variants may contribute to general cognitive impairments, subsequently increasing susceptibility to various conditions64.
Although the PVI was embodied as a unidimensional construct through the approach of IRT, the 22 retained items covered eight aspects of mental health issues, including anxiety (two items), depression (one item), learning burnout (four items), internet addiction (four items), alcohol use (one item), sleep quality (three items), aggressive behavior (two items), and social inhibition (five items). These aspects reflect the prevalent mental health issues among contemporary youths in China65,66,67,68,69. The original reviews revealed ten aspects of mental health. However, the items related to stress and antisocial behavior were removed because they were beyond the acceptable outfit MNSQ values. Specifically, the stress-related items were removed because their outfit MNSQ values were less than 0.80, indicating a nontrivial interdependence with other items. Conversely, the antisocial behavior-related items exceeded 1.20, suggesting a poor fit within the unidimensional model70. The results were not unexpected because stress-related items are widely recognized to overlap with anxiety and depression, and some items measure anxiety and depression, as well as stress71. The removal of antisocial behavior-related items may be due to the broader definition of antisocial behavior, which includes both violent (e.g., aggression and verbal abuse) and non-violent actions (e.g., absenteeism, truancy, and cheating)72. This definition differs from more commonly accepted views and likely introduced elements that extend beyond the scope of the p-factor construct in this study, reducing the overlap between these items and other indicators.
Among the 22 items, few showed sex-based DIF that should be discussed. Items f1 (“I have found that I was not able to stop drinking once I had started”), j1 (“I find it hard to start a conversation”), and j2 (“I do not find the right things to talk about”) showed negative sex DIF contrast values, indicating that at equal levels of psychopathological vulnerability, males were slightly more likely than females to endorse these items. Conversely, item i3 (“Sometimes I fly off the handle for no good reason”) exhibited a positive sex DIF contrast value, indicating that at equivalent levels of psychopathological vulnerability, females were slightly more likely than males to endorse this particular item. These differences may partly stem from the societal expectations and norms related to emotional expression73. Taking item i3 as an example, social role theory and research related to normative expectations consistently identified women as the emotional gender74,75. This phenomenon has been extensively documented in psychological and youth research, indicating that females were significantly more likely to report emotional outbursts than males76. Research suggests that women may internalize societal expectations regarding emotional expressiveness77, leading them to be more attuned to their emotional states and more inclined to report experiences of anger or frustration than men. This heightened emotional responsiveness among women may contribute to the endorsement of item i3. Items with DIF are retained mainly because DIF contrasts of less than 1.00 logits are considered statistically nonsignificant, and the content measured by the items represents important symptoms of the measured concept78. Retaining items with slight DIF has been widely considered reasonable. Previous studies have retained one item each from the PHQ-9 and GAD-7 with DIF contrasts greater than 0.50 logits but less than 1.00 logits79. Hence, items (i.e., f1, i3, j1, and j2) with slight sex DIF were retained in the PVI.
Practically, although the PVI involves eight aspects and differences across classes in various aspects exist, we recommend that future intervention strategies employ universal transdiagnostic treatment protocols. We made this recommendation because universal therapy makes theoretical and pragmatic sense20,80. From a theoretical standpoint, the general p-factor implies that numerous different disorders share common risk factors81. Interventions targeting different disorders comprise the same evidence-based modules (e.g., psychoeducation, setting treatment goals, and cognitive restructuring), suggesting that they treat the constituents of the p-factor and possibly the p-factor itself80. From a practical perspective, transdiagnostic treatment protocols are being tested with several notable successes80,82. Certain therapies originally developed for specific disorders have been applied in transdiagnostic interventions due to their demonstrated effectiveness across various conditions83. Other protocols have been intentionally designed to address multiple related disorders, such as the unified protocol for the transdiagnostic treatment of emotional disorders84. A meta-analysis of transdiagnostic treatments for anxiety and depressive disorders has found that these treatments resulted in significant improvement in mental health82.
The hit rates of the 22-item PVI and SCL-90 for identifying vulnerable youths were compared by using two clinical samples. In the overall diagnosis sample, the PVI and SCL-90 had hit rates of 36.59% and 28.05%, respectively, for youths with definitive diagnosis (n = 82), and 49.35% and 45.45%, respectively, for youths with provisional diagnosis (n = 77). PVI was found to have a better performance than the SCL-90 at the sample level. Only a few early studies have recorded the efficiency of psychological measurements among youth. The hit rate of the Children’s Depression Inventory (CDI) was reported to be 24.00%85. A succeeding study reported hit rates of 24.00% to 28.00% for the CDI and Beck youth inventory—depression, respectively, in screening86. Importantly, PVI identifies the majority of the intermediate olive-shaped population. Such a result may yield new insights into interventions for mental health issues, indicating a need to prioritize a preventive perspective in interventions. This preventive perspective also aligns with the p-factor structure given that primary prevention cannot be solely indicated by diagnosis, emphasizing the necessity of transdiagnostic prevention strategies rather than disorder-specific ones87. Scholars have noted that a uniform etiology does not guarantee a uniform treatment response20. The PVI based on the p-factor structure facilitated the classification of individuals in accordance with their vulnerability levels; customized interventions for each group88; and provided the first-line intervention in a staged, stepped-care system, wherein individuals who do not improve proceed to specialized intervention20. One strategy for achieving a universal psychotherapy protocol aiming to reduce high p-factor levels involves identifying and distilling the therapeutic elements common across disorder-specific protocols. Subsequently, these elements, which have proven efficacy, can be cobbled together into a single universal p-therapeutic protocol89,90. While the PVI has shown evidence in effectively classifying individuals according to their vulnerability levels, incorporating alternative approaches such as network models and bifactor S-1 models could further refine the psychotherapy protocol. Network models conceptualize psychopathology as the result of interactions between specific symptoms, providing a more dynamic understanding of how symptoms influence one another20. These models emphasize the identification of “key symptoms” that may trigger other symptoms, thus allowing for targeted interventions aimed within a staged, stepped-care system. Additionally, the bifactor S-1 model can complement the PVI by defining the general factor through indicators of one facet, chosen as the reference based on strong theoretical reasoning91. This approach offers clearer interpretations of both the general and specific factors, leading to more theoretically grounded interventions.
Some limitations of this work warrant mention. First, there are concerns regarding the representativeness of the sample. Although it was drawn from a nationwide cohort, selection bias may have occurred due to the Chinese college enrollment system, leading to non-representative numbers from various provinces92. Furthermore, the lack of information about non-responses limited the generalizability of the study’s conclusions. Future research should aim to recruit a randomly stratified sample of youth to mitigate the effects of sample selection bias. Second, this study did not include more detailed sociodemographic characteristics of the sample, which limits the understanding of how these factors may influence the results. Nevertheless, the participants were drawn from 34 provincial-level administrative units in China, providing a diverse representation of the youth population and reflecting the broader societal context in which the PVI will be applied, future research should consider collecting additional sociodemographic data to better profile distinct vulnerability groups. Third, the concurrent and predictive validity evidence for the PVI was analyzed by using only samples collected from the student counseling and mental health center. However, it is important to note that without conducting statistical tests, no conclusions can be drawn about whether these differences are statistically significant. Therefore, future studies should incorporate inferential statistical methods to rigorously test the significance of the hit rate differences. Moreover, predictive validity evidence was examined using a 1-year follow-up sample, highlighting the importance of long-term follow-up studies in the future to further assess hit rates. The fourth limitation of this study is that among the three classes delineated by the PVI, the changing trajectory of the intermediate class in the olive‑shaped distribution was not evident. In fact, this class is more deserving of attention than other classes because it has the potential to transition to either being vulnerable or highly protected. Finally, the existing PVI lacks objective indicators, such as frequencies of psychiatric admissions and emergency department visits93, attention level94, brainwaves, remote measurement technologies95, and electroencephalography96,97. The inclusion of these indicators could further enhance the predictive effectiveness of PVI.
Methods
Participants
A priori power analyses were conducted to calculate the minimum sample size needed to address the research questions in this study. Previous research suggested that for stable item calibration within ±0.5 logits, a sample size of 64 participants was adequate if the sample was well-targeted. However, this requirement increased to 144 participants for poorly targeted samples98. Additionally, sample size recommendations for LCA indicated a ratio of 1:3 to 1:4 between items and participants was needed to achieve a minimum power of 0.8. With an expected 30 items, our target minimum sample size was 1100 participants99. Furthermore, G*Power 3.1 was utilized to determine the minimum necessary sample size for correlational analysis, considering an effect size of 0.6, an alpha level of 0.05, and a desired power of 0.95, the required sample size was 26 participants100. Therefore, the final estimated minimum sample size for this study was 1100 participants.
Participants were voluntarily recruited from universities that admitted students through the National College Entrance Exam, which covers 34 provincial-level administrative units in China. The ratios of male students to female students across different grades have ranged from 1.26:1 to 1.63:1. This type of sample has been employed in previous studies to develop psychological instruments101. Students were invited to participate in an online test, which included questions on demographic information (i.e., age, sex, and grade), the self-developed initial items of the PVI, and the SCL-90. This study was approved by the Ethics Committee of the East China University of Science and Technology (20240329010). Respondents were informed about the study’s aim and confidentiality. As recommended, all participants provided informed consent by clicking on an “I agree” button in a separate consent screen that appeared before they could access the survey102. Since participation was voluntary, some potential respondents chose not to participate for various reasons, and information about those who declined is unavailable. Furthermore, although we utilized a reliable online survey platform, the online format limited our control over test administration errors, such as test environment and potential technical issues103. We addressed these challenges by enhancing the standardization of test administration, thereby reducing inconsistencies in administrator procedures and questionnaires.
To ensure standardized administration of the test, we collaborated with academic advisors and counselors from the student counseling and mental health center, who served as test administrators. Each administrator participated in a comprehensive training session, during which they were provided with a standardized poster containing a QR code, a link to the questionnaire, and information on the expected time commitment. Alongside the poster, a scripted invitation was provided, outlining the study’s purpose and giving instructions for inviting students to participate. This uniform communication strategy ensured that all students received consistent information about the study103,104. Following the initial invitation, an operational guide was distributed to potential respondents, and administrators were instructed to frequently remind students to complete the questionnaire within the designated response period from 17 October 2022 to 25 October 2022. Additionally, to enhance data quality, we embedded attention checks throughout the questionnaire to identify careless respondents, allowing researchers to exclude them prior to analysis105,106. Due to the online nature of the questionnaire, the response times varied significantly, with a median response time of 10.78 min. As indicated by a meta-analysis, the threshold of response times exhibited non-negligible differences, and there was substantial inconsistency among studies in determining the boundaries between guessing behavior and normal responses107. Therefore, we primarily relied on quality control methods (i.e., attention checks) to maintain data quality105,106.
The initial sample included 13,582 responses. To select qualified samples, the following exclusion criteria were adopted: (1) repetitive responses; (2) lack of identification information; (3) age outside the range of 15–24 years; (4) failure to complete the SCL-90 questionnaire; (5) failed attention checks; and (6) participants with missing values on items in the PVI item pool. Further details on the sample selection can be found in Fig. 2.
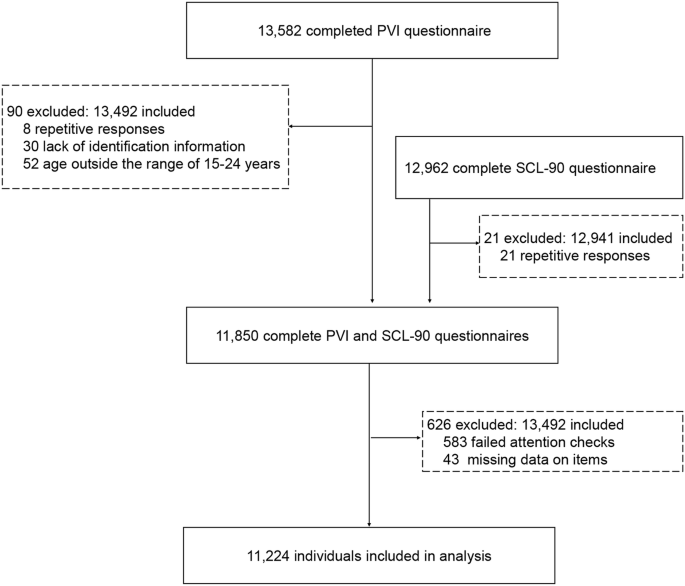
This figure provides a visual representation of the participant selection process for the study. It outlines the initial number of participants, the application of exclusion criteria, and the final number of individuals included in the analysis. PVI: psychopathological vulnerability index.
The final sample of 11,224 youth (overall sample) from all academic units had an average age of 19.60 (SD = 1.34, range = 15–24) and a male-to-female ratio of 1.28:1. Additionally, the student counseling and mental health center of the East China University of Science and Technology provided an anonymous list containing 159 participants with a definitive or provisional diagnosis of psychological disorders. Among these participants, 99 individuals (concurrent sample) underwent diagnoses concurrently with questionnaire collection. They comprised 50 individuals with a definite clinical diagnosis and 49 individuals categorized with a provisional diagnosis of psychological issues by counseling center psychologists. Another 60 individuals (predictive sample) were recruited as the diagnostic sample within 1 year after questionnaire collection. They included 32 and 28 individuals with definite clinical and provisional diagnoses, respectively. The demographic characteristics of the participants are presented in Table 7.
Development steps for PVI
The steps for the construction of the test were developed according to the Standards for Educational and Psychological Testing, which delineates four phases of the test development process: test specifications, item development and review, assembling and evaluating test forms, and developing procedures and materials for administration and scoring21. Additionally, the steps inspired by the test development guidelines proposed by Downing (2006), which encompass an overall plan, content definition, test specifications, item development, test design and assembly, test production, test administration, scoring responses, determining passing scores, reporting results, item banking, and producing a technical report. The test construction process also reflected the author’s experience in instrument development. Integrating these frameworks was essential because the standards for educational and psychological testing provide international benchmarks for test and item construction, while Downing’s guidelines offer best practices grounded in years of experience and research literature from various areas of psychometrics and educational measurement. By combining these sources with the author’s practical experience, this approach has been successfully applied in the development of other scales19,108.
The first step involved clearly defining the purpose and rationale for the development of the PVI, which was designed to capture a broad range of mental health issues among youth. Synthesized findings from the literature helped to establish the empirical framework for PVI. The “umbrella review” has frequently been employed to identify and classify the dimensions of measurements109. This study adopted an umbrella review to identify mental health issues that youths widely encounter, as well as the most appropriate instruments and representative items. A targeted search was conducted on Web of Science by using three sets of keywords: a set of words related to mental health (e.g., psychological health, psychology, psychopathology, and psychiatric); a set of words related to systematic review (e.g., systematic review, meta-analysis, and review); and a set of words related to youth (e.g., youth, student, adolescence, and teenage). The obtained literature was screened based on titles and abstracts. Twenty-four review articles were included (as shown in Table 8). These review articles mainly summarized ten types of mental health issues (see Table 9), including anxiety, depression, stress, learning burnout, sleep disorders, alcohol abuse, Internet addiction, antisocial behavior, aggressive behavior, and social inhibition.
The second step focused on developing the item pool. The initial item pool was constructed by selecting instruments that had accumulated validated evidence in Chinese youth populations, with a focus on mental health issues identified in prior umbrella reviews. Previous research has shown that psychological measurements with multiple published translations have accumulated more evidence of cross-cultural reliability and validity than tools available in only a single language110,111. Ultimately, the selected instruments included: (1) the depression anxiety stress scale for anxiety, depression, and stress12. The Cronbach’s alpha values for the depression, anxiety, and stress subscales were 0.97, 0.92, and 0.95, respectively. Evidence for concurrent validity, indicated by correlations with other measures, ranged from 0.42 to 0.85, which was considered acceptable to excellent112. This scale has shown evidence of good to excellent internal consistency reliability (i.e., Cronbach’s alpha and omega) and evidence of convergent validity across youth samples113; (2) learning burnout scale for learning burnout114, showed a Cronbach’s alpha of 0.77 in youth populations, with a test–retest reliability coefficient of 0.79 after two months. Confirmatory factor analysis revealed a good overall model fit, with inter-dimension correlations ranging from 0.10 to 0.48, and correlations with a total score between 0.68 and 0.82; (3) sleep quality scale for sleep disorders has shown concurrent validity evidence, evidenced by a significant correlation with the Pittsburgh sleep quality index (r = 0.72)108. Recent findings indicated good internal consistency and test–retest reliability across diverse populations115; (4) alcohol use disorders identification test for alcohol use disorders116, has accumulated validated evidence in numerous studies117; (5) compulsive internet use scale for compulsive Internet use118, exhibited a high internal reliability (Cronbach’s alpha = 0.88) and the evidence of concurrent validity was established among adolescents; (6) antisocial behavior scale for antisocial behaviors72, developed for youth populations, reported reliability alphas above 0.70, with sufficient predictive validity evidence established; (7) aggression questionnaire for aggressive behaviors119, provided evidence of construct validity and showed reliability coefficients ranging from 0.72 to 0.85 in adolescent groups120; and (8) social inhibition questionnaire for social inhibition121, generated evidence of internal, construct, convergent, and predictive validity, with a Cronbach’s alpha of 0.91 in youth populations122.
Previous recommendations have suggested that incorporating perspectives from researchers, clinicians, and the target population123 is critical for forming an item pool. In the first stage of forming an item pool, researchers and counseling psychologists established the criteria for item selection on the basis of clinical experience in instrument development124,125,126 and intervention127,128,129. For ensuring sufficient identification and testing for homogeneity within each construct, 5–8 items with the highest factor loadings were retained for each mental health issue130. In the second stage, in-person interviews were conducted among youths, counseling psychologists, and officers from the Office of Student Services to balance the phrasing, pertinence, lucidity, and difficulty of items. Previous research in developing the brief strengths scale for individuals with mental health issues131 and three-dimensional inventory of character strengths for clinical and nonclinical samples132 have laid the foundation for the above processes. Finally, an item pool containing 57 items was developed.
The third step was to select the most appropriate items and evaluate their psychometric properties. Rasch model was used to select and evaluate items. To further provide the validity evidence, LCA was conducted to differentiate statistically distinct subgroups among the participants. Additionally, ROC analysis was used to determine cut-off points, establishing thresholds that categorize youth into different groups. A correlation analysis was performed between PVI scores and the composite scores of SCL-90 to examine the validity evidence of the PVI in relation to other variables. The SCL-90 utilized in this study was derived from the introductory paper by Derogatis, et al.133, and numerous studies have shown its evidence of high reliability and validity among youth populations in China134. All items on the SCL-90 adopted a five-point Likert scale. In accordance with previous research, the composite score used in this study was the GSI T-scores. The GSI T-scores were derived from the GSI, calculated as the mean of all 90 items of the SCL-90, and transformed into GSI T-scores using a standard conversion method with a mean of 50 and a standard deviation of 10135. Participants who obtained GSI T-scores of 63 or above were identified as the high-risk group for psychological symptoms and those with GSI T-scores below 63 were considered as the low-risk group for psychological symptoms59. As a widely recognized instrument, the SCL-90 could serve as a reliable benchmark for establishing the validity evidence of the PVI due to its comprehensive assessment of mental health issues59,72,133.
The fourth step determined the format of the measurement. This study employed a 1-month time frame for measurement to enable a highly accurate and robust capture of vulnerable youths. A monthly interval aligns with the theoretical perspective that regards psychopathological vulnerability as a general p-factor, ensuring comprehensive assessment by encompassing most of the nonspecific mental health consequences associated with the evolution of the p‑factor20,81. Empirically, responses between weekly and monthly time frames at the item and scale levels were found to be no significant difference136. By contrast, adopting long periods tends to increase recall bias137.
In this study, we adopted dichotomous measures (i.e., “yes” or “no”) instead of the original Likert scale not only for ease of use138,139 but also because these selected items are the manifestation of a general p-factor that exhibits an interplay pattern81. The differentiation between adjacent rating points on the Likert scale is complicated depicting distinct boundaries in the presentation of symptoms138. Statistically, the assessment of psychopathology using the two-point scale showed high accuracy without the need to account for chance guessing and disagreements138 and yielded a robust outcome in cases of quantity violation conditions140.
Statistical analysis strategy
The study ultimately analyzed 61 variables, including sex, age, grade, 57 items from the PVI item pool, and the composite score of the SCL-90. No item in the PVI item pool exhibited extreme scores outside the range of 0 to 1, nor did any item display an extreme score of all 0 s or all 1 s. Only the composite score of the SCL-90 had missing data (0.14%), with no outliers present. Rasch analysis was used to derive objective, basic, and additive measures from categorical data and estimate latent traits on the basis of the unidimensional model. The dichotomous Rasch model was designed for use with ordinal data with two categories. All items were initially submitted to the Rasch model to evaluate whether different measures could be integrated into a single composite measure. First, the fit of the items to the model was examined by infit and outfit MNSQ statistics, with values between 0.80 and 1.20 indicating acceptable fit141. Items outside this range were considered for deletion57,142. Second, Rasch PCAR was conducted to examine the assumptions of unidimensionality and local independence. The following criteria were employed to determine whether additional factors were likely to be present in residuals: (a) a cut-off of 20% of the variance explained by the trait that the index intends to measure143 and (b) an eigenvalue of the first residual factor smaller than 2144. Third, DIF was evaluated using the item location parameter, commonly referred to as the difficulty or endorsability of an item, to examine whether measurement invariance was present145. Typically, measurement invariance can be examined through IRT or CTT146. In the context of IRT, a lack of measurement invariance is indicated by DIF145,146,147. DIF analysis was applied to assess whether items functioned equivalently across groups based on sex, academic year, and age. Consistent with prior studies148,149, gender comparisons were made between males and females, while age was categorized into two groups: low (≤mean age of 19.60) and high (>mean age of 19.60). Academic years were divided into two comparison groups: freshman vs non-freshman, and senior vs non-senior. DIF contrasts < 0.50 logits are considered negligible, those 0.50 to 1.00 are considered moderate, and those >1.00 are considered substantial150. Fourth, the mean person score should be close to 0 to indicate the good targeting of the items151. Finally, the person separation index (>0.70) was calculated to estimate how well one can differentiate between different individuals’ performances on the measured variables141. The above analyses were performed in R version 4.1.2 by using the eRm and TAM packages.
The source of validity evidence in relation to other variables was then investigated. The Spearman correlation coefficient was calculated between the PVI and GSI T-score when the normal distribution assumption was violated, with values above 0.60 being preferred. Given the presence of missing values in the GSI T-score and the small proportion of missing data (less than 5%), the listwise deletion approach was employed at this stage152.
LCA was introduced to distinguish classes statistically. The goodness of fit of the model was assessed by using AIC, BIC, and saBIC. The lowest values of these criteria indicate good model fit. Furthermore, the LMR and BLRT were used to determine the appropriate number of classes. A significant LMR or BLRT suggests that a model with k classes fits the data better than a model with one less class. Finally, model classification quality was evaluated by using entropy and the average posterior class probability with values ranging from 0 to 1 and high values indicating good individual classification153. An entropy value of 0.70 or higher represents the adequate quality of classification154. LCA was performed by using Mplus 8.3. Cut-off points were determined through ROC analysis155. The statistical performance of the cut-off points, such as the sensitivity, specificity, accuracy, positive predictive value (PPV), and negative predictive value (NPV), can be calculated and compared to identify the cut-off points with the best indicators156. ROC analysis was conducted by using the pROC package in R version 4.1.2.
The KW non-parametric test was utilized to compare differences between classes determined on the basis of the PVI or SCL-90 scores. The concurrent and predictive hit rates of the PVI and SCL-90 were calculated to assess the screening performance of the two instruments in identifying psychopathological vulnerability among youths. Hit rates were defined as the percentage of correctly detected vulnerable youths relative to the overall number of diagnosed individuals157,158.


Responses