Direct air capture of CO2 for solar fuel production in flow
Main
Direct air capture (DAC) of carbon dioxide (CO2) is a promising technology for actively removing CO2 from the atmosphere and combating the climate crisis1,2. Despite the advancements and pilot-scale implementations, DAC remains an energy-intensive process, leading to high costs for CO2 removal while not producing any products of economic value3,4. This limitation confines the technology to localized environments with inexpensive energy sources. Some state-of-the-art DAC technologies operate by carbon capture and storage, where the captured CO2 is stored under geological formations5. However, the long-term effects of storing vast amounts of CO2 underground over decades remain uncertain6. An alternative is to utilize the captured CO2 to produce renewable fuels and chemicals, thereby creating value while achieving a carbon-neutral cycle7,8. Nevertheless, most prominent CO2 utilization (CO2U) technologies require pure CO2 as the carbon feed while needing high energy input by themselves, making their overall integration in the DAC framework challenging.
Solar-powered technologies offer a sustainable future where we can harness the Sun’s energy directly to fuel our economy9,10,11. Solar-driven CO2-to-fuel synthesis has been explored extensively in recent decades, primarily in solid–liquid interfaces12,13,14. Solution-based systems often face limitations due to the low solubility of CO2 in the aqueous medium. To circumvent this, gas-phase CO2 photoreduction processes are emerging, which offer enhanced local CO2 concentration, better mass transport and reduced light scattering, among other advantages15,16,17,18,19. Despite the benefits, gas-phase reports mostly show limited activities due to the challenging thermodynamics of gas-phase CO2 reduction20,21. The processes are further limited by the requirement of pure CO2 (whose production from emission sources is cost-intensive with US$125–335 per ton of CO2 from the air22) and are often sensitive to oxygen in the feed stream. From a materials perspective, gas-phase CO2 photoreduction catalysts typically use metal/metal oxide composites that require high overpotentials, resulting in low efficiency and selectivity. In this context, the use of molecular–semiconductor hybrid materials represents an underexplored approach for combining a molecular catalyst’s high activity and selectivity with the durability and robustness of heterogeneous solid support23,24.
Here, we report an integrated gas-phase direct air carbon capture and utilization (DACCU) flow reactor that captures CO2 from air, concentrates it and converts it into renewable fuel using simulated sunlight (Fig. 1a,b). The dual-bed reactor can be envisioned to operate in a diurnal cycle, where CO2 is chemically captured from the air during light-off (night-time) operation while letting the other gases (for example, N2 and O2) pass through. The captured CO2 is released in a concentrated stream during the light-on (daytime) operation and further photochemically converted into synthesis gas (in short, syngas, a mixture of CO and H2 that is used as a precursor for fuel and chemical synthesis). DAC is enabled by a state-of-the-art solid-phase silica-polyamine CO2 adsorber that desorbs the captured CO2 at elevated temperatures (80–100 °C) provided by photothermal solar heating (Fig. 1c)25,26. We use a parabolic trough solar collector that concentrates (simulated) sunlight to heat the adsorbent for efficient CO2 release while enhancing photoconversion of released CO2. Light-driven CO2-to-fuel synthesis is enabled by a developed alumina/silica-titania-cobalt bis(terpyridine) (Al2O3/SiO2|TiO2|CotpyP) hybrid material that is efficient in gas-phase CO2U in a moist fixed-bed flow reactor setup (Fig. 1d). Poly(ethylene terephthalate) (PET)-derived ethylene glycol (EG) is used as the reductant. This work demonstrates the ability of a molecular–semiconductor hybrid to catalyse gas-phase CO2 photoreduction while offering a solution to manage atmospheric O2 in aerobic CO2 photoreduction via temporal separation between CO2 capture and conversion.
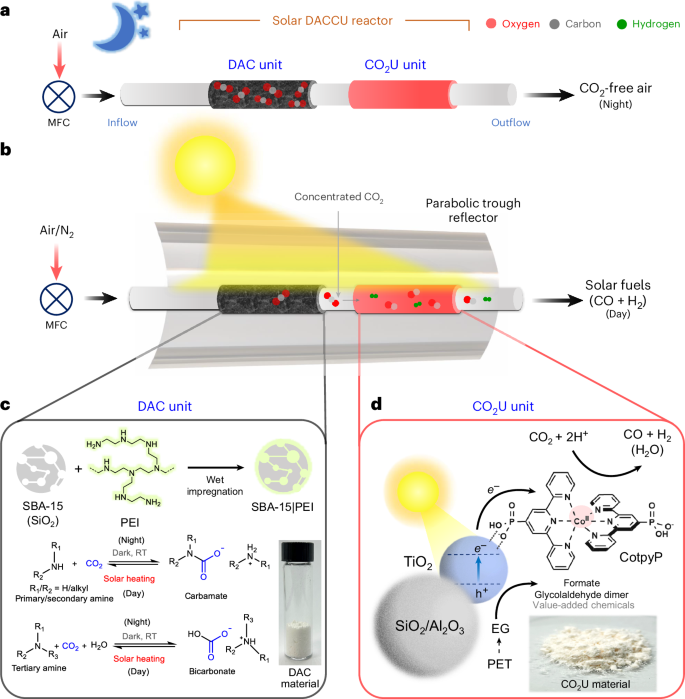
a, Schematics of the system during light-off night operation. b, Schematics of the overall system during light-on day operation. c, The carbon capture unit with chemical CO2 capture and release equations. d, The solar-driven CO2U unit material composition and the relevant reduction and oxidation reactions. RT, room temperature; MFC, mass flow controller; PEI, polyethyleneimine; PET, poly(ethylene terephthalate); EG, ethylene glycol.
DAC and photothermal CO2 release
The first step towards assembling the envisioned integrated solar-powered DACCU flow reactor was developing a solar DAC unit to capture and concentrate aerobic CO2 that would act as the carbon source to a downstream CO2U unit (Fig. 1a,b). For this purpose, branched polyethyleneimine (PEI, weight-average molecular weight 25,000 g per mole) was impregnated as an active CO2-capturing chemical onto a porous solid support of mesoporous silica (SBA-15, particle size <150 μm) in equal weight by wet impregnation to obtain a solid CO2 adsorbent powder (SBA-15|PEI). Thermogravimetric analysis (TGA) of the adsorbent in air showed 50 wt% PEI loading onto the silica support (Supplementary Fig. 1a). Effective deposition of the amine throughout silica pores was verified by Brunauer–Emmett–Teller (BET) isotherm analysis, which showed a reduced surface area upon PEI incorporation onto the support (9.2 m2 g−1 versus 300 m2 g−1 for the parent silica support; Supplementary Fig. 1b). Uniform deposition of PEI on silica was also observed by scanning electron microscopy (SEM)–energy-dispersive X-ray spectroscopy (EDS) mapping of the adsorbent (Supplementary Figs. 2 and 3). Similar CO2 scrubbers with optimal amounts of polyamines deposited over solid supports (Supplementary Note 1) are well established in the literature for DAC and have applications in state-of-the-art CO2 removal technologies owing to their efficient CO2 capture kinetics and fast CO2 release at elevated temperatures27,28.
DAC experiments with the synthesized solid CO2 adsorber (SBA-15|PEI) were carried out with a fixed bed of SBA-15|PEI (600 mg, length 5 cm) inside a glass tube reactor (inner diameter 0.6 cm) by flowing humidified air (400 ppm CO2 in 21% O2 and balance N2) through it at ambient temperature (flow rate 90 ml min−1; Supplementary Fig. 4a). Analysis of the CO2 concentration in the outflow showed complete CO2 removal for around 9 h of operation (Fig. 2a), followed by a slow increase in CO2 level consistent with the onset of saturation of the capture material. Complete CO2 saturation was reached after 18 h, at which time the total CO2 intake of the composite by DAC was estimated around 87 ± 4 mg of CO2 per gram of adsorbent (0.17 ± 0.01 mol of CO2 per mole of amine) as determined from the CO2 concentration–time curve integral (Fig. 2a). The observed timescale for capture (10–16 h) is optimal for night-time operation and complements the average daily sunlight exposure of many tropical and subtropical regions. Furthermore, the complete capture duration (tonset) is proportional to the mass of the adsorbent and inversely proportional to the flow rate and, thus, can be tuned by changing these two parameters accordingly.
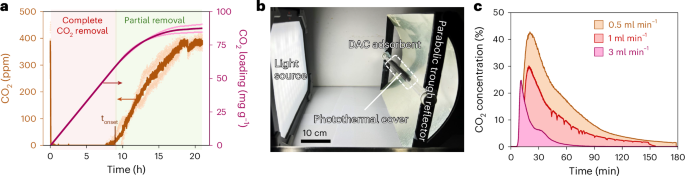
a, CO2 levels in the outflow during DAC and the adsorbed CO2 amount over time. DAC was performed with 600 mg of SBA-15|PEI adsorbent with an airflow rate of 90 ml min–1 at room temperature. b, Photothermal CO2 desorption setup with photothermal coating and parabolic trough reflector (note that the light source is for demonstration purposes only and different from the actual solar simulator used). c, CO2 concentration in outflow gas stream during release with different flow rates under 3 suns of solar irradiation with photothermal cover. In all cases, the adsorbent bed temperatures reached around 85–100 °C across different regions under concentrated light during desorption. For a, data are presented as the average of two independent runs and the individual data points are shown in hollow circles.
Source data
Solar-driven photothermal release of CO2 from the adsorbent was then explored by irradiating the post-capture adsorber bed with simulated sunlight (1 sun, 100 mW cm−2, AM 1.5G) under airflow (1 ml min−1) at ambient pressure. Under these standardized conditions, no CO2 release in the outflow was detected. Thermal image analysis of the system showed a temperature of 35 °C at the adsorber bed upon light irradiation, which is insufficient for the thermal desorption of the captured CO2 (refs. 25,26). However, increasing the reactor bed temperature via a combination of concentrating light using a parabolic trough reflector (to 3 suns) and covering the outside of the adsorber bed with an infrared (IR) absorbing photothermal black tape (Methods) resulted in efficient CO2 release (Fig. 2b,c and Supplementary Figs. 4 and 5). Under these conditions, the temperature of the adsorbent reached around 100 °C at 1 ml min−1 flow rate (Supplementary Fig. 6), while the CO2 concentration in the outflow reached 30% (v/v) within 30 min of solar irradiation (Fig. 2c). The CO2 levels in the outflow from solar-driven photothermal desorption decreased below 2% (v/v) after approximately 2 h. Higher CO2 concentration in the outflow stream (42%) for a longer duration can be obtained by decreasing the flow rate to 0.5 ml min−1, whereas increasing the flow rate of the carrier gas results in a quicker desorption process with lower CO2 concentrations in the outflow (Fig. 2c; note the decreasing area under the curve with higher flow rate, reflecting similar total CO2 desorption, calculated as the area × flow rate). The solar-to-CO2 release energy efficiency of the process is estimated at around 0.6% (Supplementary Note 2). SEM and EDS analysis of the post-capture-release adsorbent showed comparable morphological structures and organic content to the pre-capture material, reflecting minimal changes during the cycle (Supplementary Fig. 7), and the adsorbent can be reused in CO2 capture for multiple cycles without a notable performance decrease (Supplementary Fig. 8).
Gas-phase CO2-to-fuel utilization in flow
The development of an efficient, inexpensive moist-bed gas-phase CO2-to-fuel utilization system was explored next, to be placed downstream to the solar DAC and release unit (Fig. 1b). Most reports on gas-phase CO2 reduction focus on water oxidation as the counter-reaction, which is kinetically and thermodynamically challenging (ΔG ≈ + 237 kJ mol−1). Consequently, we replaced water oxidation with a favourable alcohol oxidation reaction (ΔG ≪ 237 kJ mol−1) to enhance the CO2 reduction rates29,30,31. This imparts additional advantages to the system, including ease of generated syngas post-processing and avoidance of explosive oxygen–fuel gas mixture formation (Supplementary Note 3). The alcohols can be sourced from different waste streams, including depolymerized discarded plastics (EG), biorefineries (glycerol) and biomass (sugars), and can be upgraded in our DACCU process to value-added chemicals32,33,34. For the solar-driven conversion, TiO2 (P25) is used as an inexpensive photocatalyst, along with a chemically immobilized cobalt (II)-based molecular catalyst (CotpyP) as the CO2 reduction co-catalyst to reduce the required overpotential35,36. For gas-phase operation, we further distributed the TiO2|CotpyP over a porous high-surface-area solid support (silica or alumina) to facilitate gas transport that enhances the CO2U rates (Fig. 1d).
The CO2U material was synthesized by stirring a solution of CotpyP (0.5 mg) and TiO2 nanoparticles (50 mg, particle size 21 nm) in MeOH (for immobilization of CotpyP via its phosphonic acid linkers on the TiO2 surface) followed by the addition of SiO2 nanoparticles (nSiO2, 1 g, particle size 5–20 nm) as a high-surface-area support. Solvent removal under vacuum after overnight stirring afforded a beige-coloured solid powder of the hybrid composite (nSiO2|TiO2|CotpyP) for CO2 conversion. Scanning transmission electron microscopy (STEM)–EDS mapping of the composite showed uniform distribution of TiO2 nanoparticles with amorphous phase SiO2 throughout (Fig. 3a and Supplementary Fig. 9). Although the loading of molecular cobalt catalyst in the composite was below the detection limit by elemental mapping, uniformly immobilized CotpyP on TiO2 surfaces was indirectly observed by C,N EDS mapping. Inductively coupled plasma optical emission spectroscopy (ICP-OES) analysis confirmed the presence of Co and showed around 0.6 μmol of Co per gram of catalyst loading. The IR and ultraviolet–visible (UV–vis) diffuse reflectance spectra showed characteristic absorption peaks of both TiO2 and CotpyP molecular complex, using a higher loading to increase signal intensities (Supplementary Fig. 10a,b). BET isotherm revealed a high surface area (494 m2 g−1) and pore volume (0.502 cm3 g−1), suggesting the ease of gas penetration (Supplementary Fig. 11)
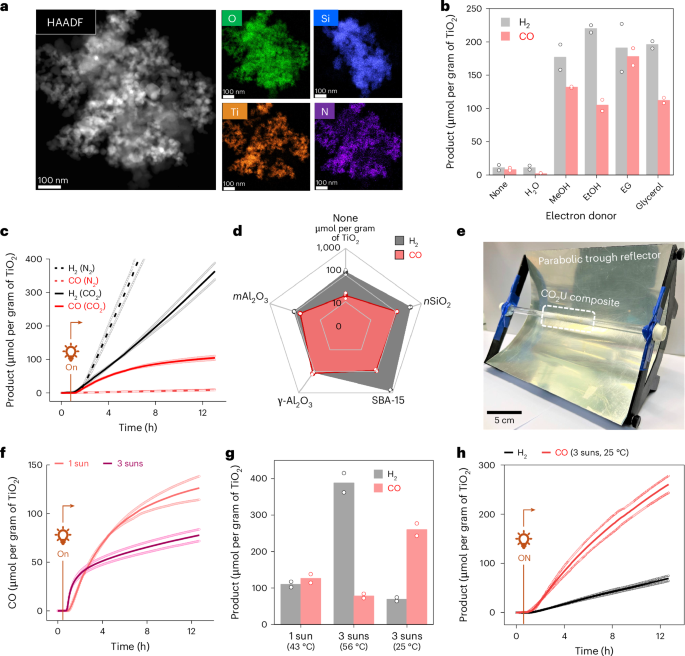
a, HAADF-STEM image and the relevant EDS maps (O, Si, Ti, N) of the composite. b, The effect of different alcohol electron donors on H2 and CO formation. Reactions were carried out in batch with 100 mg of CO2U composite (nSiO2|TiO2|CotpyP) and 0.15 ml of electron donor under 1 sun (100 mW cm–2, AM 1.5G) for 20 h. c, The effect of N2 versus CO2 carrier gas on product formation in fixed-bed flow setup. Reactions were performed with 250 mg of CO2U composite, moistened with 0.50 ml EG, under 1-sun illumination at a carrier gas flow rate of 1 ml min−1. d, The effect of different support materials on performance under similar conditions. e, An image of the parabolic trough reflector used for light concentration with the mounted tubular fixed-bed reactor. f, The effect of increasing solar intensity (around 3 suns) via reflector on CO formation when using γ-Al2O3|TiO2|CotpyP as the CO2U composite. g, The effect of temperature regulation on CO and H2 formation. The 43 oC and 56 oC reactions were performed without temperature regulation (elevated temperatures due to solar thermal heating), whereas in the 25 oC reaction, temperature was kept steady using a water jacket. h, Product evolution with time under 3-sun illumination when temperature was kept steady at 25 °C. For b–d and f–h, data are presented as the average of two independent runs and the individual data points are shown in hollow circles.
Source data
The solid composite was then used in solar CO2 conversion to syngas. Initial batch experiments showed that several alcohols, including methanol, ethanol, EG and glycerol, can act as efficient electron donors in the system for syngas formation by CO2 photoreduction, consistent with the high photoactivity of TiO2 towards alcohol oxidation (Fig. 3b)37,38. The solid composite (250 mg, containing 12.5 mg TiO2) was then loaded inside a glass tube (inner diameter 0.6 cm) to prepare a fixed-bed flow photoreactor (bed length ~2 cm). The bed was manually moistened with EG before experiments, acting as an electron donor. For the experiments, humid CO2 or N2 was passed through the tube reactor as the carrier gas at a flow rate of 1 ml min−1 (gas residence time in the CO2U reactor bed ~35 s) while keeping the catalytic bed irradiated under simulated sunlight (1 sun, 100 mW cm−2, AM 1.5G). The outflow gas was analysed by gas chromatography (GC) (Supplementary Fig. 12). Under these conditions, CO and H2 formation were observed in the outflow when CO2 was used as the carrier gas, with respective yields of 105 ± 8 μmol per gram of TiO2 and 363 ± 35 μmol per gram of TiO2 after 12 h (Fig. 3c). These values are comparable to the reported activities of the catalytic system in solution, without the need for any organic solvent or buffer solution, highlighting the advantages of a fixed-bed gas-phase flow setup35. These results also showcase the excellent promise of molecular catalysts immobilized onto a semiconductor surface in moist-bed gas-phase CO2 photoreduction.
A control experiment with humid N2 as a carrier gas showed only H2 formation (885 ± 41 μmol per gram of TiO2) with minor CO generation, reflecting CO2 reduction to be the source of CO (Fig. 3c). CO2 as the CO source was further verified by isotopic labelling, where using 13CO2 as the reactant selectively produced 13C-labelled CO as the product (Supplementary Fig. 13). Another control experiment with nSiO2|TiO2 composite without CotpyP yielded only H2 and minor CO, confirming the role of the molecular catalyst in CO2 reduction (Supplementary Fig. 14). The major proton source in the system is probably the dissolved moisture in the humid carrier gas, although EG might also act as a minor proton source as suggested by an isotopic labelling study with EG-D6 (Supplementary Fig. 15). STEM–EDS and powder X-ray diffraction analysis of the post-catalysis composite did not show any trace of Co aggregates, suggesting the immobilized CotpyP as the active CO2U catalyst (Supplementary Figs. 16 and 17).
The support is an important component in the catalytic system that provides a matrix to the cobalt catalytic centres and allows efficient gas transport through the material (Fig. 3d and Supplementary Fig. 18). Reflecting this, a notable decrease in CO formation was observed (~6 times) when TiO2|CotpyP was used in the catalytic bed without a support matrix (Fig. 3d). The support also influences the composition of the produced syngas by altering the local catalytic environment39. Thus, H2 formation increased (by two to three times) when mesoporous silica (SBA-15) was used as support instead of silica nanoparticles (Fig. 3d and Supplementary Fig. 18). By contrast, the use of alumina support suppressed the H2 formation while enhancing the CO production, probably due to the altered surface chemistry involving aluminium hydroxyl groups of the alumina40. From screening several supports, activated γ-alumina nanoparticles (γ-Al2O3, particle size <50 nm) were found to be the most suitable support material for our system owing to the observed high CO2 reduction rates (126 ± 17 μmol of CO per gram of TiO2 after 12 h). The resultant syngas was rich in CO (CO:H2 5:4), ideal for downstream applications ranging from liquid fuel production to chemical syntheses41.
The effect of concentrated sunlight on the system was explored with the γ-Al2O3|TiO2|CotpyP composite by placing the tube reactor at the focal axis of a parabolic trough reflector where the light intensity reached up to 300 mW cm−2 (Fig. 3e). Under concentrated light, high H2 and CO formation were observed for 0.5 h, followed by a decrease in CO production (Fig. 3f). The decrease is probably due to the increased temperature of the reactor bed under light concentration, reaching 56 °C during the reaction (Supplementary Fig. 19) and causing partial deactivation of the molecular catalyst (Supplementary Fig. 20). To circumvent this, a water jacket was introduced around the CO2U chamber, and the temperature was kept constant at 25 °C. This resulted in a high and steady CO formation with yields reaching 260 ± 24 μmol per gram of TiO2 after 12 h (Fig. 3g,h). The produced syngas was CO rich because of the suppressed H2 formation at this temperature (CO:H2 4:1; Supplementary Fig. 21). The turnover number (TON) of the molecular catalyst CotpyP after this time is calculated as 21 ± 2 with a turnover frequency (TOF) of 1.8 ± 0.1 h−1 (Supplementary Fig. 22). The TON can be increased further to 96 ± 7 (TOF 8.0 ± 0.6 h−1) by decreasing the CotpyP loading onto the composite from 0.05 wt% to 0.005 wt%, but this also decreases overall CO formation (116 ± 9 μmol per gram of TiO2 after 12 h; Supplementary Fig. 22).
High-performance liquid chromatography (HPLC) analysis of an aqueous extract from the post-catalysis reactor bed showed formate and glycolaldehyde (GAD) dimer (molar ratio ~5:2) as the major EG oxidation products (Fig. 4a and Supplementary Figs. 23 and 24). These products combined accounted for more than 80% of electrons supplied to syngas production (Fig. 4b) and could be utilized as platform chemicals following separation from the CO2U chamber. Isotopic labelling experiments with 13CO2 and 13EG revealed EG oxidation as the pathway leading to formate and GAD formation without any contribution from the CO2 reduction pathway (Supplementary Fig. 25). A control experiment with the γ-Al2O3|TiO2 (without CotpyP) showed no CO, and a decreased H2 production (~30% of the γ-Al2O3|TiO2|CotpyP), confirming the catalytic role of CotpyP in CO2 and proton reduction reactions (Supplementary Fig. 26). The effect of possible PEI leaching from DAC to the CO2U chamber during integrated operation (vide infra) was also investigated using 5 wt% PEI in EG as an electron donor. This did not decrease the overall syngas formation rates, but a drop in the CO:H2 ratio was noted (from 4:1 to 1:3; Supplementary Fig. 27).
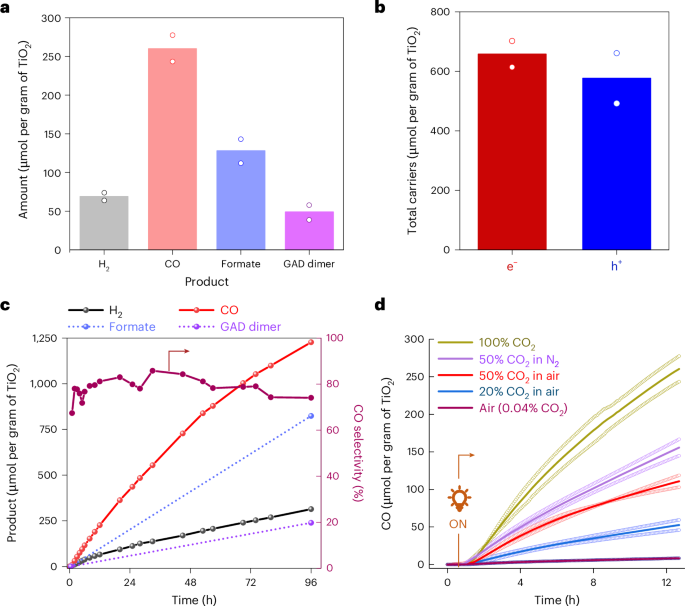
a, The overall reduction and oxidation products observed (γ-Al2O3|TiO2|CotpyP as CO2U composite and EG as electron donor, reaction time 12 h). b, Total charge carriers involved in product formation. c, Long-term product formation activities and CO selectivity when PET-derived EG was used as reductant (for the EG derivation protocol from PET, see Methods). Reaction was performed at a CO2 flow rate of 3 ml min−1. d, The effect of CO2 dilution on CO generation in different carrier gases (CO2 in nitrogen, air). All reactions were performed under 3-sun illumination at 25 oC temperature. For a, b and d, data are presented as the average of two independent runs and the individual data points are shown in hollow circles.
Source data
Real-world PET waste can also be used as a reductant following KOH-mediated lysis pretreatment (to produce EG) without sacrificing the syngas production activity of the system and is transformed into formate and GAD dimer in the process over a long time (96 h) with syngas formation reaching over 1,500 μmol per gram of TiO2 at 80% CO selectivity (Fig. 4c, Supplementary Note 4 and Supplementary Fig. 28)42.
Investigations towards the response of the fixed-bed flow photoreactor in dilute CO2 streams revealed a CO production rate roughly proportionate to the CO2 concentration, whereas the H2 production remained similar (Fig. 4d and Supplementary Fig. 29). Thus, moving from 100% CO2 to 50% CO2 in N2 (v/v) as the carrier gas, the CO production nearly halved (260 ± 24 μmol per gram of TiO2 versus 156 ± 16 μmol per gram of TiO2 after 12 h). Reasonable activity was observed when air was used as the carrier gas (50% or 20% CO2), albeit with a notable drop, possibly due to the competing oxygen reduction reaction43,44. A control experiment with air as both the carrier gas and CO2 source (400 ppm) produced negligible CO as a CO2 reduction product, reflecting the need for an upstream CO2 concentrating unit for effective photoconversion of the atmospheric CO2. Notably, all experiments with air carrier gas produced a minor background CO (~2 μmol per gram of TiO2 per hour) due to photoinduced surface impurity oxidation (Supplementary Fig. 30), which was subtracted in all calculations.
DAC and utilization to produce solar fuel
Integrated capture and utilization of CO2 from air was explored next by combining the capture and utilization bed into a custom-designed tube reactor (Fig. 5a). The DACCU reactor contained an upstream DAC chamber and a downstream CO2U chamber with an alternate outlet in between to divert the flow around the utilization unit during DAC. Downstream of utilization, an additional chamber was installed for different downstream processing, including the capture of unreacted CO2 or the further conversion of the generated syngas.
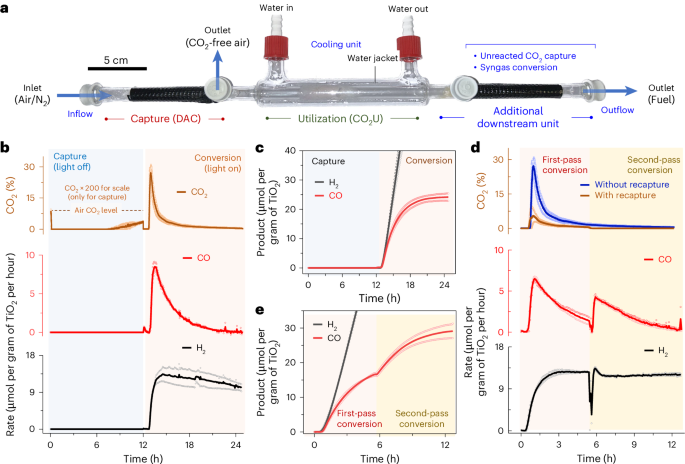
a, The designed reactor for in-flow DAC and CO2U. b, CO2 levels and photocatalytic CO and H2 formation rates in the outflow during DACCU. The CO2 values during capture (0–12 h) are multiplied by a factor of 200 for ease of visualization. DAC was performed during light-off operation at room temperature under airflow (90 ml min−1) and the CO2U is carried out during light-on operation under 3-sun illumination at 25 oC under N2 flow (1 ml min−1). c, Cumulative H2 and CO yield over time during DACCU. d, Recapture and rerouting of unreacted CO2 for increased conversion and low carbon emission. The additional downstream unit was loaded with fresh adsorbents for unreacted CO2 capture and rerouting during conversion. e, Cumulative H2 and CO formation over time during first- and second-pass conversion during operation under simulated solar irradiation. Data are presented as the average of two independent runs, and the individual data points are shown in hollow circles.
Source data
In a standard experiment, the DACCU reactor was loaded with both the SBA-15|PEI (for DAC) and γ-Al2O3|TiO2|CotpyP composite (for CO2U) in their respective compartments and mounted on the axis of a parabolic trough reflector (Supplementary Fig. 31). Humid air (CO2 level 400 ppm) was passed through the capture bed for 12 h (flow rate 90 ml min−1) at ambient temperature for DAC in the dark, mimicking night-time operation. During this time, the CO2 level in the outflow mostly remained zero, reflecting effective CO2 removal by the adsorber (Fig. 5b). Following capture, the utilization bed of the CO2U unit was moistened with EG, the flow was changed to N2 (1 ml min−1) and the solar simulator with concentrator was turned on to mimic daytime operation while holding the moist CO2U bed temperature steady at 25 °C. Elevated CO2 levels in the outflow were detected within 10 min owing to effective desorption via photothermal heating (~100 °C; Fig. 5b). GC analysis of the stream showed the initiation of CO and H2 formation by conversion of the released CO2 and locally available protons, respectively (Fig. 5b). The CO formation rate followed a similar pattern as the released CO2 concentration, peaking near 1 h of light-on operation at 8.5 ± 0.8 μmol per gram of TiO2 per hour with high CO2 levels, and decreasing afterwards with diminished CO2 availability (Fig. 5b). This result is consistent with the proportional CO production rate dependency on CO2 concentration observed above (Fig. 4d). Introducing a pure CO2 feed after 4 h restored the CO2U catalytic activity of the conversion bed, confirming that the gradual decrease in CO formation is due to limited CO2 availability with time and not catalyst deactivation (Supplementary Fig. 32). During this time, the H2 production remained independent of CO2 levels. These results demonstrate the ability of our developed system to capture, concentrate and convert CO2 from air into synthesis gas, driven by simulated sunlight and utilizing EG as the electron donor in a moist-bed gas-phase flow reactor setup.
The total CO formation of the system reached around 24 ± 2 μmol per gram of TiO2 after 12 h (Fig. 5c). Following conversion, air was reflown through the reactor (90 ml min–1) for a second cycle of capture, and the syngas formation activity of the γ-Al2O3|TiO2|CotpyP composite was partially retained (~50%) during subsequent second cycle conversion (Supplementary Fig. 33). Notably, using air as the carrier gas during utilization decreased CO formation (~80% reduction; Supplementary Fig. 34) while bringing potential complexities to the system involving adsorbent degradation and poisoning of downstream syngas conversion, among others (Supplementary Note 5). As such, N2 is a preferable carrier gas for the DACCU reactor light-on operation, which also ensures a longer CO2 adsorbent lifetime and avoids explosive air–fuel gas mixture formation.
The flow system displays high modularity and system flexibility. For example, we could recapture the unreacted CO2 from the outflow by using a second bed of CO2 adsorber downstream of the CO2U unit. The CO2 emission during light-on operation from such a modified reactor decreases prominently while keeping the solar syngas production rate unaffected (Fig. 5d). We could also reroute the recaptured CO2 to the utilization unit by switching the flow direction and irradiation spot, increasing the light-driven CO2 conversion (Fig. 5e and Supplementary Fig. 35). Single-pass CO2 conversion can also be improved in theory by using a larger utilization unit, improved light management45 and optimized reactor design46,47. The produced syngas can also be theoretically converted into liquid fuels in additional downstream syngas conversion units or used in carbonylative hydrogenation reactions (Supplementary Fig. 36), utilizing the benefits of a flow system for easy process integration48.
Discussion
We demonstrate an integrated DACCU flow reactor that captures, concentrates and converts CO2 from air into renewable synthesis gas using simulated sunlight. We envision running the process diurnally where CO2 can be captured upstream during night-time operation (light off) and subsequently released and converted downstream during daytime operation (light on) using incident sunlight. Our approach offers a promising way for direct on-site utilization of CO2 at DAC plants using sunlight without requiring high temperature or pressure, rather than transporting and storing the CO2.
At the same time, the strategy of DAC and the release of CO2 in concentrated form before conversion provide a promising solution to the challenges of low CO2 concentration (0.04%) and high O2 presence (21%) in solar CO2 reduction chemistry from air. O2 reduction is a favourable reaction that often dominates CO2 reduction when present in the stream49,50,51. By introducing a temporal separation between CO2 capture and reduction and providing means to concentrate CO2 and remove O2 upstream, our approach provides a solution to both CO2-scarcity and O2-poisoning challenges.
The CO2 adsorbent we use in this study has high DAC efficiency and capacity and releases CO2 under solar photothermal heating. Our process is not limited to the SiO2|PEI composite for DAC and is compatible with other CO2 adsorbents that release CO2 upon heating around 80–100 °C, including zeolites52,53, metal–organic frameworks54,55 and covalent–organic frameworks56,57, and can be tuned to accommodate contemporary progresses in CO2 sorbent developments. The CO2U unit is based on a molecular–semiconductor hybrid material, which is a promising approach in gas-phase CO2 conversion. The moist-bed gas-phase flow CO2U unit enables easy process integration with the upstream gas-phase DAC unit while overcoming the solution-phase limitations of low gaseous CO2 availability26.
Future focus will be on devising methods for supplying long-term continuous reactant feed to the reactor and product separation off the reactor (Supplementary Note 6). The development of IR photothermal heat-resistant CO2 conversion catalysts that can utilize the full UV–vis solar spectrum would unlock the complete benefits of the solar reflector by utilizing the UV–vis light for photoconversion and the IR photothermal heat to expedite the conversion process (Supplementary Note 7). These future developments would be needed to enable the practical implementation of this DACCU process, powered directly by the energy from the Sun.
Methods
Materials
Silica nanopowder (nSiO2, 5–20 nm, ≥99%, Sigma), mesoporous silica SBA-15 (<150 μm particle size, pore size 8 nm, Sigma), gamma alumina nanoparticles (γ-Al2O3, <50 nm, ≥99%, Sigma), mesoporous alumina (mAl2O3, pore type MSU-X, average pore size 3.8 nm, Sigma), cerium (IV) oxide nanopowder (nCeO2, <25 nm, Sigma), titania nanopowder (TiO2, particle size <21 nm, Sigma), branched PEI (weight-average molecular weight 25,000 g per mole, Sigma), methanol (≥99%, Sigma), ethanol (≥99%, Sigma), EG (≥99%, Sigma), glycerol (≥99%, Sigma), tetrahydrofuran (THF, Fisher Scientific, HPLC grade, 98%) and potassium hydroxide (Fischer Scientific, Analytical reagent grade) were used as received. CO2 (CP grade, British Oxygen Company (BOC)), N2 (99.99%, BOC), artificial air (400 ppm CO2 in 21% O2 and balance N2, BOC), carbon-13C dioxide (13CO2, 99.0 atom% 13C, Sigma-Aldrich), EG-d6 (98% D, Sigma) and 13C-EG (95.0 atom% 13C, Sigma-Aldrich) were used without further purification unless otherwise stated. Molecular complex [Co(2,2′:6′,2″-terpyridine-4′-phosphonic acid)2](BF4)2 (denoted as CotpyP) was prepared following a reported procedure36. For PET waste, plastic bottles from Sainsbury’s Cola (internal volume 2 l, unrecycled PET) were used after removing the label sticker, rinsing with deionized water and drying at 110 °C for 1 h.
Material and product characterization
The gas products were analysed with a Shimadzu GC-2010 Plus gas chromatogram with ultrapure Helium (CP Grade) as the carrier gas. The chromatographic separations for the oxidation products were conducted using a Waters HPLC system equipped with a Phenomenex Rezex 8% H+ column at a column temperature of 60 °C. The samples were analysed in the isocratic flow mode (flow rate: 0.5 ml min−1, 0.0025 M aqueous H2SO4) using a Waters breeze HPLC system equipped with refractive index (RIS-2414) and diode array UV–vis (λ = 254 nm) detectors. For the 13C-isotope labelling experiments, 13CO was detected using IR spectroscopy (Thermo Scientific Nicolet iS50 IR spectrometer) in the gas-phase transmission mode. The headspace from the cell was transferred to an air-tight evacuated IR cell (path length 10 cm, equipped with KBr windows) after the experiment for the detection of 13CO (data resolution 0.125, data spacing 0.060 cm−1). Attenuated total reflectance Fourier transform IR spectra were recorded in a Thermo Scientific Nicolet iS50 IR spectrometer in reflectance mode. UV–vis diffused reflectance spectra were recorded using a Bruker Cary 60 UV–vis spectrophotometer. The powder X-ray diffraction measurements of the samples were performed using a Panalytical X’Pert Pro (Cu Kα radiation) diffractometer with a 2θ (θ = angle of incidence) range from 10° to 80° at a scan rate of 1° min−1.
The SEM images and EDS maps were acquired using a TESCAN MIRA3 FEG-SEM instrument (operated at 5 kV) equipped with an Oxford Instruments Aztec Energy X-maxN 80 EDS system. The transmission electron microscopy (TEM), bright-field STEM, high-angle annular dark-field (HAADF) STEM images and EDS maps were acquired using a Thermo Scientific Talos F200X G2 transmission electron microscope (operating voltage 200 kV). Transmission electron microscopy images were acquired using a Thermo Scientific Ceta complementary metal oxide semiconductor camera. STEM images were collected using a Thermo Scientific bright-field detector and Fischione HAADF detector at a camera length of 98 mm and EDS maps using a Super-X detector system. Samples were prepared by drop-casting a dilute composite solution on holey-carbon-coated Cu grids or lacey-carbon-coated Ni grids followed by evaporation of the solvent.
The ICP-OES measurements were performed on a Thermo Scientific iCAP 7400 ICP-OES DUO spectrometer at the Microanalysis Service, Yusuf Hamied Department of Chemistry, University of Cambridge. CO2 was detected using a Gas Sensing Solutions CozIR-LP (0–2,000 ppm) sensor during air capture and using a SprintIR-6S CO2 sensor (0–100%) during desorption. Nitrogen physisorption isotherms were measured using Micromeritics 3Flex Adsorption Analyzer. All the materials were degassed for a few hours under vacuum before measurement. Nitrogen adsorption and desorption isotherms were measured at 77 K. The specific surface area was calculated by the multipoint BET method using the adsorption branch of the physisorption isotherm. The total pore volume was determined at relative pressure (P/Po) close to 1. TGA measurements were taken in a Mettler Toledo Thermogravimetric Analyser under an airflow of 100 ml min−1 in a temperature range from 25 °C to 800 °C with a heating rate of 5 °C min−1 (temperature holding time at 800 °C = 10 min). The initial weight loss observed below 150 °C was attributed to the loss of adsorbed moisture and CO2. The weight loss from 150 °C to 800 °C was counted towards the organic content. The thermal images were taken using a FLIR ONE Gen 3 thermal camera. Mass spectrometry was recorded using a Hiden Analytical HPR-20 benchtop gas analysis system to a HAL 101 RC electron impact quadrupole mass spectrometer with a Faraday detector. The nuclear magnetic resonance measurements were performed in a Brooker Biospin instrument at room temperature (298 K). The XPS measurements were performed at the Maxwell Centre, University of Cambridge, with a near-ambient-pressure XPS system using a SPECS XR 50 MF X-ray source, μ-FOCUS 600 X-ray monochromator and a differentially pumped PHOIBOS 150 1D-DLD near-ambient-pressure analyser. The peak positions were calibrated with respect to the C 1s binding energy at 286 eV, and Casa-XPS software was used for the curve fitting and deconvolution.
Preparation of CO2 capture composite
Three grams of PEI was dissolved in 20 ml methanol and was subsequently added dropwise to a suspension of 3 g SBA-15 silica on 200 ml methanol under vigorous stirring. The resulting solution was stirred overnight. The solvent was subsequently removed under reduced pressure (85 mbar) at 40 °C and dried overnight under high vacuum to afford a solid powder composite (SBA-15|PEI), which was analysed by SEM, EDS, BET and TGA and used for DAC58.
Preparation of CO2 conversion hybrid composite
Here, 0.5 mg of CotpyP was dissolved in 5 ml methanol and was subsequently added dropwise to a suspension of 50 mg TiO2 (P25) on 10 ml methanol under stirring. The resulting TiO2|CotpyP hybrid suspension was stirred for 2 h (ref. 35). Subsequently, the suspension was added dropwise to a suspension of 1 g of support (nSiO2/SBA-15/γ-Al2O3/mAl2O3/nCeO2) in 100 ml methanol. The resulting solution was stirred overnight. The solvent was subsequently removed under reduced pressure (85 mbar) at 40 °C and dried overnight under high vacuum to afford a solid powder composite that was examined by SEM, TEM, EDS, BET, XRD, IR and UV–vis analyses and was directly used for CO2 conversion studies.
Design and construction of the parabolic trough reflector
The parabolic trough reflector was constructed from two three-dimensional (3D)-printed parabolic endpieces combined with highly reflective (90%+ solar reflectance) Alanod MIRO-SUN 20901L aluminium sheeting to create a parabolic trough solar concentrator. The parabolic endpieces were designed using Autodesk Inventor, with the curve of the parabola being defined in Cartesian coordinates by the equation y = (x2)/32 with the focus and point of light concentration at (x, y) = (0, 8) (Supplementary Fig. 5b). The reactor was built to be 32 cm wide (owing to the size of available simulated solar light sources), making the focus of the parabolic trough concentrator at a height equal to the height of the parabolic endpieces, with the focus line running down the centre of the symmetrical parabolic trough. Three 1.0-cm-diameter holes were designed in each endpiece, so the two sides of the reactor could be connected using 1.0-cm-diameter Delrin rods, which were press-fit to connect the two reactor endpieces. A piece of Alanod sheeting was then attached using high-strength double-sided fastening tape. Two sample holder crossbeams (Supplementary Fig. 5) were also 3D printed to hold a borosilicate glass reaction tube with an 11 mm outer diameter at the focus of the parabolic trough concentrator. When constructed, the reactor had a length of 25 cm, including the two endpieces. All 3D-printed reactor parts were printed using Ultimaker Tough polylactic acid material using an Ultimaker S5 printer.
Direct air CO2 capture and solar photothermal desorption
The adsorbent was treated under reduced pressure (<1 mbar) at 50 °C for an hour before DAC. Subsequently, in a tubular glass reactor, 600 mg of solid CO2 adsorbent was loaded and fixed inside the reactor using glass wool plugins. The tube was then closed, and humid air (relative humidity ~60%) was passed through the adsorber bed at 90 ml min−1 flow rate using a mass flow controller (MFC; Brooks GF040) under ambient temperature. The CO2 levels in the outlet stream were recorded using a CoZIR CO2 sensor from Gas Sensing Solutions (0–2,000 ppm). The sensor was calibrated before each experiment using nitrogen (0 ppm) and air (400 ppm). The time profile of CO2 loadings onto the adsorbent was calculated by integrating the removed CO2 concentration with time multiplied by flow rate.
For the desorption studies, a direct air CO2 capture experiment was first performed for around 20 h. The adsorber bed was then wrapped with an IR-absorbing photothermal material on top of the glass reactor. For this purpose, a black-coloured Gaffa tape (Faithfull Quality Tools) was used. The tube was then placed at the focal axis of the parabolic trough solar reflector and placed inside the solar simulator. Air was subsequently flown through the adsorber bed as carrier gas (0.5–3 ml min−1), and the solar simulator light (Newport Oriel, AM 1.5G, 100 mW cm−2) was turned on (t = 0, wherein t stands for time). The CO2 levels of the output stream were detected using a Gas Sensing Solutions Sprint-IR CO2 sensor (0–100%), which was calibrated before each experiment using N2 (0%) and pure CO2 (100%).
CO2 photoreduction procedure in batch
A glass photo vial was loaded with 100 mg of solid CO2 reduction material (nSiO2|TiO2|CotpyP) which was subsequently moistened with 0.15 ml of electron donors (water, methanol, ethanol, EG or glycerol). The headspace of the vial was then purged with humid CO2 (containing 2% CH4 as internal standard), and the vial was irradiated with simulated solar light (Newport Oriel, 100 mW cm−2, AM 1.5G) for 20 h, keeping the temperature at 25 °C. Afterwards, an aliquot of the headspace gas was analysed by GC via manual injection to determine the H2 and CO yield. The residual solid was then suspended in 1 ml water, and the resulting mixture was filtered. The filtrate was analysed by HPLC for oxidation product determination.
Moist-bed gas-phase CO2 photoreduction procedure in flow
In a tubular glass reactor (length 28 cm, inner diameter 0.6 cm), 250 mg of CO2 conversion composite (support|TiO2|CotpyP) was loaded. Subsequently, the composite was manually moistened with EG by adding 0.50 ml EG dropwise using a pipette. The tube was subsequently sealed with septa at both ends and placed into the focal axis of the parabolic trough reflector. Humidified carrier gas (nitrogen, CO2 and air) was subsequently flown through the tube at a constant flow rate (1–5 ml min−1) using an MFC (Brooks GF040) while keeping the reactor inside a simulated solar simulator (lamp off). The outlet of the reactor was connected to an online GC through a 1 ml loop that injected approximately every 4.25 min into the GC. The flow rate at the GC outlet was verified before the experiment with an Alicat gas flow meter to ensure no gas leakage. The initial 45 min of the experiments were run in the dark to obtain a stable GC baseline, after which the solar simulator lamp (Newport Oriel, AM 1.5G, 100 mW cm−2) was turned on for 12 h. The momentary rates of CO and H2 evolution (ṅgas) from individual injections were determined from the GC responses by subtracting the baseline under dark conditions and using a previously described procedure with the same setup59 using
where p is the pressure in the flow reactor (ambient pressure, 101,325 bar), (dot{V}) is the flow rate, R is the universal gas constant, T is the temperature before injection (298 K) and fi is the response factor of each gas determined by a calibration procedure. The GC calibration was performed with a known standard for H2, CO and CH4 (4,000 ppm H2/4,000 ppm CO/1,000 ppm CH4 in balance gas CO2, BOC) by diluting the mixture with pure CO2. The CO selectivity values were obtained by dividing momentary CO evolution rates by total combined momentary rates of CO and H2 evolution. The amount of evolved product with time was calculated by integrating the product evolution rates with time. The TON and the TOF with respect to the molecular catalyst were calculated using
For the reactions under 1 sun, the reflector surface of the trough reflector was covered with a non-reflective material (white paper). For reactions under 3 suns, the paper cover was removed to ensure solar concentration. For the reactions at 25 °C, water was circulated through a water jacket on the reactor using a chiller to ensure a steady temperature. For HPLC analysis of the oxidation products, the glass wool plugs were carefully removed from the reactor after the reaction. The composite was then recovered in a vial and sonicated after adding 2 ml of deionized water. The resulting mixture was then filtered using a syringe filter, and the liquid was analysed by HPLC.
For the isotope labelling study with 13CO2, the experiment was carried out in batch. The tube was filled with 13CO2 and sealed instead of continually passing 13CO2. The sealed tube was then irradiated under 1 sun for 20 h, after which the gas inside was analysed with IR spectroscopy in transmission mode, which showed the formation of 13C-labelled CO. For dilute concentration CO2 reactions (20–50% v/v), CO2 was mixed upstream with N2 or air using MFCs to the desired concentrations with a total flow rate of either 2 ml min−1 (50% CO2) or 5 ml min−1 (20% CO2).
For the reactions with real-world PET waste as a reductant, PET plastic from a plastic bottle was shredded. Following that, 100 g of shredded PET was suspended in a solvent mixture of methanol and THF (400 ml and 100 ml, respectively). Subsequently, 56 g of KOH was added, and the resultant mixture was stirred at 60 °C for 24 h (Supplementary Note 4). Afterwards, the solution was filtered to remove the precipitated dipotassium terephthalate, and the THF and MeOH were removed from the filtrate under reduced pressure. EG was extracted from the remaining mixture through vacuum distillation (yield 19.4 g, 60%), which was then directly used in the DACCU reactor. For the PET breakdown in EG solvent, 5 g of PET was suspended in 25 ml of EG, followed by the addition of 2.8 g KOH. The resultant mixture was stirred at 150 °C for 4 h. Subsequently, the solution was left undisturbed for 24 h (to precipitate the dipotassium terephthalate). The EG was then decanted from the mixture, containing both solvent EG and PET-derived EG, and was used in the reaction. The breakdown of PET plastic was verified in this case by characterizing and quantifying the dipotassium terephthalate product by 1H and 13C nuclear magnetic resonance spectroscopy (5.1 g, 81%).
DAC of CO2 and solar-driven conversion
The modified tubular reactor, as shown in Fig. 5a, was used for integrated capture and conversion. First, the DACCU tube was loaded with 600 mg of CO2 adsorbent in the capture compartment and 250 mg of CO2 conversion composite in the downstream conversion chamber. Air was then flown through the capture bed for 12 h (flow rate 90 ml min−1), and an alternate outlet was used to bypass the flow around the conversion chamber. The CO2 concentration in the outflow during capture was monitored using a CO2 sensor, and the H2 and CO levels were not monitored (assumed zero). Following the capture, the CO2 conversion bed was moistened with 0.50 ml EG, and the reactor was then sealed and placed inside a solar simulator (lamp off). Humid nitrogen or air was then passed through the capture and conversion unit as carrier gas (1 ml min−1), and the CO2, CO and H2 levels of the outlet stream were measured using a CO2 sensor (CO2) or GC (CO and H2). The first 45 min of conversion was done without light to obtain a stable baseline, after which the solar simulator lamp was turned on for 12 h. The temperature of the conversion unit was kept at 25 °C throughout the experiment using a chiller. The CO responses were corrected by subtracting a background response from a blank reaction in pure N2 or air (Supplementary Fig. 30).
For the reaction with multiple capture and conversion cycles, the first cycle of capture and conversion was carried out as described. Subsequently, air was flown again through the CO2 adsorbent, and the outlet gas stream was bypassed around the conversion unit using an alternate outlet and a placed septum before the conversion unit. After 12 h of capture, the septum was removed, and the reloaded CO2 adsorbent was used for subsequent conversion, following similar procedures as in the first cycle.
For the recapture of unreacted CO2 followed by double-pass conversion, CO2 capture was first carried out using the procedure previously stated in the capture chamber. Subsequently, the conversion chamber was loaded with the CO2 conversion composite, moistened with EG, and another layer of fresh CO2 adsorbent (700 mg) was loaded in the downstream additional chamber. The resulting reactor was then placed in the focal axis of the parabolic trough reflector. The reactor was then placed inside the solar simulator, humid N2 was flown through it as carrier gas, and the output CO2, CO and H2 levels were detected using the CO2 sensor and GC, respectively. The solar light was then turned on, irradiating only the capture and conversion unit while keeping the downstream unreacted CO2 capture unit in the dark. After about 6 h, as the CO2 and CO levels in the outlet almost subsided, the inlet and outlet of the reactor were switched, and concentrated light was selectively shone in the conversion unit and the captured unreacted CO2 unit (Supplementary Fig. 35). The experiment was continued for another 6 h after which the light was turned off.
For the reaction introducing pure CO2 after 4 h to check for any possible catalyst deactivation (Supplementary Fig. 32), a standard direct air carbon capture and solar-driven conversion reaction was set up as described above. After 4.25 h of solar irradiation during conversion, the carrier gas was switched from humid nitrogen (1 ml min−1) to humid CO2 (5 ml min−1). The conversion was continued for an additional 3 h as the generated CO and H2 rates were measured using GC.
Reporting summary
Further information on research design is available in the Nature Portfolio Reporting Summary linked to this article.
Responses