Disparities in low-carbon concrete GWP at the metropolitan level in the United States

Introduction
The Architecture-Engineering-Construction (AEC) sector is responsible for at least 37% of global greenhouse gas (including CO2) emissions annually, making it a critical industry to decarbonize in global efforts to abate climate change1. While significant progress has been made in reducing the “operational carbon” of buildings through optimized heating and cooling systems and renewable energy integration2,3, efforts to minimize “embodied carbon” emissions from the manufacturing of construction materials, such as steel, glass, and concrete, lag behind4,5. With 14 billion cubic meters of concrete produced in 20206, concrete is the most utilized construction material and one of the key contributors to CO2 emissions, with nearly 8% of the global share7. Urbanized metropolitan areas are responsible for a large portion of these CO2 emissions8,9, as concrete infrastructure is commonplace10. Yet as urbanizing countries develop (especially in the global south)11, the CO2 emissions from cement clinker production, the principal CO2-intensive component in concrete, are predicted to double or quintuple12. Therefore, low-carbon concrete specifications are essential to curb these projected emissions and meet decarbonization goals13.
While international standards permit the specification of low-carbon concrete materials13,14,15,16, such specifications in the United States (U.S.) remain in their infancy17,18,19. A common strategy for specifying low-carbon concrete is the utilization of cement replacements to minimize the amount of cement clinker in concrete mixtures20. These replacements can be industrial byproducts, such as fly ash from coal combustion, or natural resources, such as kaolinite clays21,22. While British standards may specify up to 35–55 wt.% of cement replacements for low-carbon concrete23, the global replacement levels have stagnated at 25 wt.% since 201224. Some argue that these global trends are due to limited supply and knowledge of current cement replacements22, while others cite material property issues at various replacement levels that limit their widespread adoption25. Furthermore, existing low-carbon policies are predominantly at the national level26, despite known local differences in resource availability and low-carbon energy grids in urban areas27,28,29,30,31. This variability leads to challenges in specifying requirements and definitions of low-carbon concrete mixtures, including their impact on climate change, represented by the environmental midpoint indicator global warming potential (GWP).
In the U.S., quantifying the GWP through life cycle assessments (LCAs) of concrete production operations has begun a formulation-agnostic discussion on low-carbon concrete specification. The Carbon Leadership Forum’s (CLF) 2017 and 2021 baseline reports32,33, as well as the National Ready Mixed Concrete Association’s (NRMCA) regional 2022 benchmark report34, highlight the regional variability of GWPs of ready mixed concrete mixtures but do not define GWP targets for low-carbon concrete mixtures. This lack of definition has limited design specifications, engineering codes, and policies (i.e., Buy Clean17), hindering efforts for building designers and clients to implement more sustainable concrete mixtures. In 2023, the American Concrete Institute (ACI) formed the “Low-Carbon Concrete” 323 Committee to streamline a definition of low-carbon concrete mixtures, which could be adapted into building codes35. The ACI 323 Committee released the low-carbon concrete code in 2024, which heavily relies on aggregated NRMCA regional GWP values to establish the low-carbon baseline36.
Over recent decades, NRMCA, ACI, and others have leveraged improvements to the quality of LCAs through the use of Product Category Rules (PCRs)37 to define Environmental Product Declarations (EPDs) for ready-mix concrete mixtures. The currently available EPDs in the U.S. report the cradle-to-gate (LCA modules A1-A3) GWPs for ready-mix concrete mixtures with compressive strengths of 17.2 MPa to 55.2 MPa (2500 psi to 8000 psi), spanning the structural applications of concrete constituting the urban fabric of cities. While the reported NRMCA low-carbon regional averages consider the averaged CO2 emissions (by volume) from the material extraction (A1), transportation (A2), and manufacturing (A3) of concrete mixtures, the calculated averages differ from the A1-A3 GWPs provided in publicly available EPDs of concrete mixtures. The significant progress in generating these EPD databases now requires a detailed study of their regional granularity and usefulness for directing feasible low-carbon concrete specifications38,39,40,41. This gap in the research critically limits the current discourse of low-carbon concrete specifications as it prevents attaining emission reductions across the U.S.
Addressing these limitations, we leverage repositories of data-mined EPDs across two agencies (ASTM, NRMCA) paired with U.S. metropolitan population data to understand the national spatial heterogeneity of low-carbon ready-mix concrete. More specifically, this study aimed to: 1) assess if ready-mixed concrete EPDs are uniformly available across highly populated metropolitan areas, 2) compare the A1-A3 GWP distributions for concrete strength classes to each other, to the NRMCA regional A1-A3 GWP averages, and to the ACI 323 low-carbon GWP baselines, and 3) reveal U.S. metropolitan areas and regions with high and low amounts of EPDs. This study analyzed 39,536 ready-mix concrete mixtures EPDs in the U.S., to demonstrate the local variability across different regions, highlight the A1-A3 GWP distributions for five concrete compressive strength classes, and identify blind spots to better inform national low-carbon concrete mixture targets. Our findings reveal the metropolitan areas with high and low amounts of published concrete EPDs across multiple regions of the U.S., dictating the current specification of low-carbon concrete mixtures.
Results
A tale of two types of cities: Unpacking the relationship between population size and the number of concrete EPDs available across U.S. metropolitans
In 2022, the NRMCA published the first U.S. regional GWP benchmarks for ready-mix concrete mixtures34. The continental U.S. was divided into eight regions with comparable area footprints and markets, but this approach has limitations when considering urban areas. To provide a fair comparison, this study also investigated the continental U.S. into the same eight regions. When mapping the locations of the 50 most populous metropolitan areas according to the 2023 U.S. Census Bureau42, we found that the eight regions contain a disproportionate number of metropolitans, as shown in Fig. 1a. Three regions (the Southeastern, Eastern, and Pacific Southwest regions) account for 60% of the 50 most populous metropolitan areas, with 11, 10, and 9 metropolitans, respectively. Yet, other regions, such as the North Central, Pacific Northwest, and Rocky Mountains, have only one or two of the top 50 most populous metropolitan areas. We found a similar trend when comparing the metropolitan population for the eight regions, as the Eastern, Pacific Southwest, and Southeastern regions account for 26.2%, 20.8%, and 16.7% of the U.S. metropolitan population, respectively, whereas the North Central, Pacific Northwest, and Rocky Mountain regions have no more than 3.56%.

a Geospatial visualization of the 50 most populous U.S. metropolitan areas to the eight NRMCA-defined regions, denoting the 38 metropolitans that had EPDs represented in the concrete database. b The metropolitan population size (gray circles) is overlaid with the number of concrete EPDs (blue circles) for the 38 metropolitans with EPDs to show the geographical areas with high EPD representation (i.e., the Eastern and Pacific Southwest regions) and low EPD representation (i.e., the South Central and Great Lakes regions). Supplementary Fig. 1 shows a cartographic illustration of the EPDs per state, revealing similar spatial heterogeneities in the Eastern and Pacific Southwest regions.
We found that 85.3% of concrete production associated with an EPD occurs within a 60-mile driving distance from a U.S. metropolitan, with significant EPD disproportions across regions. The New York City metro (New York City-Newark-Jersey City, NY-NJ-PA) and the Los Angeles metro (Los Angeles-Long Beach-Anaheim, CA), the two most populous U.S. metropolitan areas with populations of 19.5 million and 12.8 million, account for 19.8% and 15.5% of the EPDs in the entire database, respectively. However, the Chicago metro (Chicago-Naperville-Elgin, IL) and the Dallas metro (Dallas-Fort Worth-Arlington, TX), the third (9.4 million) and fourth (7.9 million) most populous metros, have a significantly lower representation within the EPD database, with 0.17% and 0.19% respectively. This indicates that concrete manufacturing companies operating in these metropolitan areas have not been required, or desired to obtain, an EPD. Similar disparities are observed in the Great Lakes and South Central regions, which have fewer EPDs, as illustrated in Fig. 1b; especially when comparing their metropolitan population size against the Pacific Northwest and Southwest regions (refer to Supplementary Table 1). For instance, the San Jose (San Jose-Sunnyvale-Santa Clara, CA), San Francisco (San Francisco-Oakland-Berkeley, CA), and Portland (Portland-Vancouver-Hillsboro, OR-WA) metropolitan areas have the 3rd (12.9%), 4th (8.2%), and 5th (4.8%) highest percentages of EPDs, despite being 36th (1.9 million), 13th (4.6 million), and 25th (2.5 million) in population.
Figure 2 further shows the relationship between population size and the number of concrete EPDs in metropolitan areas. A slight logarithmic relationship (R2 = 0.68) exists between metro population size and the number of EPDs, which is intuitive as population-dense metropolitan regions typically require more ready-mix concrete plants to support various infrastructure types in cities. This relationship is important as urbanization in the U.S. and globally will require the production of low-carbon concrete mixtures. Figure 2 also reveals how many U.S. regions have metropolitans with highly saturated data (i.e., at least 1000 EPDs) in comparison to those with insufficient (unsaturated) data. Seven metropolitans in the Eastern, Pacific Southwest, and Pacific Northwest regions have highly saturated data, these are: the New York, Los Angeles, San Jose, San Francisco, Portland, Washington DC (Washington-Arlington-Alexandria, DC-VA-MD-WV), and Seattle (Seattle-Tacoma-Bellevue, WA) metros. Yet, 26 of the 38 metropolitans have fewer than 500 concrete EPDs. Metropolitans in the Great Lake, South Central, and Southeastern regions especially underperform when considering their corresponding population sizes, implying that concrete companies in these cities have not been required to obtain or need (for marketing purposes) EPDs. Identifying where metropolitans have highly saturated data and which need more data is critical for establishing metro-level and achievable, concrete GWP benchmarks.
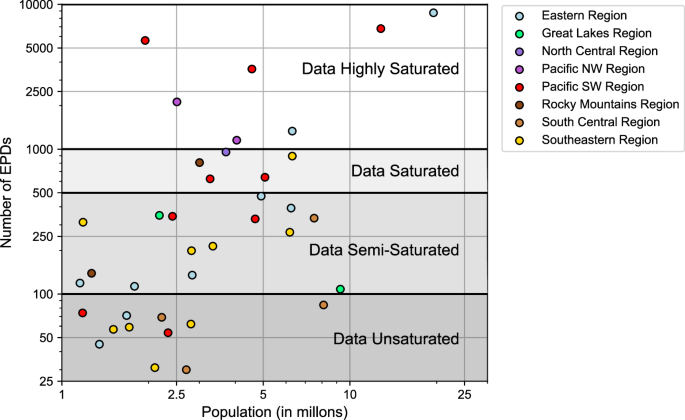
Relationship between population size and number of available ready-mixed concrete EPDs for the 38 U.S. metropolitan areas represented in the concrete EPD dataset.
Metropolitans with highly saturated data: What is driving the A1-A3 GWP of concrete mixtures across the Eastern, Pacific Southwest, and Pacific Northwest regions of the United States?
After determining that 7 of the metropolitan areas had highly saturated data, we evaluated their median A1-A3 GWPs to the overall A1-A3 GWP distributions for five different concrete strength classes in the Eastern, Pacific Southwest, and Pacific Northwest regions. The relationship between GWP for five concrete strength classes, presented in Fig. 3, shows that higher concrete compressive strength typically corresponds with higher GWP values. The exception is that in the Eastern region (Fig. 3a), the highest strength class (41.5 MPa to 55.2 MPa) shows a decrease in GWP due to the significant increase in the use of supplementary cementitious materials. Additionally, the A1-A3 GWP distributions were compared to the NRMCA region-specific averaged A1-A3 GWPs and ACI 323 low-carbon baselines. Notably, for the highest strength class, 55.7% of the EPDs across the three regions are below the “low-carbon” threshold proposed by ACI 32336, with fewer EPDs below the thresholds at lower strength classes (4.14% to 23.7%). The amount of EPDs does meaningfully fluctuate for each region (refer to Supplementary Table 2 for more details). In the Eastern region, the median A1-A3 GWPs for the Washington DC metro are near the low-carbon baseline, while for the New York City metro they are significantly higher (38.1% to 62.4% higher), except at the highest strength class due to the abundance of concrete mixtures that consist of supplementary cementitious materials. Similarly, median A1-A3 GWPs for the San Jose and San Francisco metros are near the low-carbon baseline (with average percent differences of 6.5% and 5.8%, respectively), but the Los Angeles metro shows consistently higher A1-A3 GWPs (15.1% to 36.1% higher). This translates to fewer EPDs (2.82% to 16.1%) that meet the ACI low-carbon threshold across the five concrete strength classes (see Supplementary Table 2). In the Pacific Northwest region, Portland and Seattle metros have median A1-A3 GWPs at or below the low-carbon baselines. More specifically, 81.0% of the EPDs associated with Seattle already meet the ACI low-carbon baseline, suggesting that lower thresholds may be more appropriate.
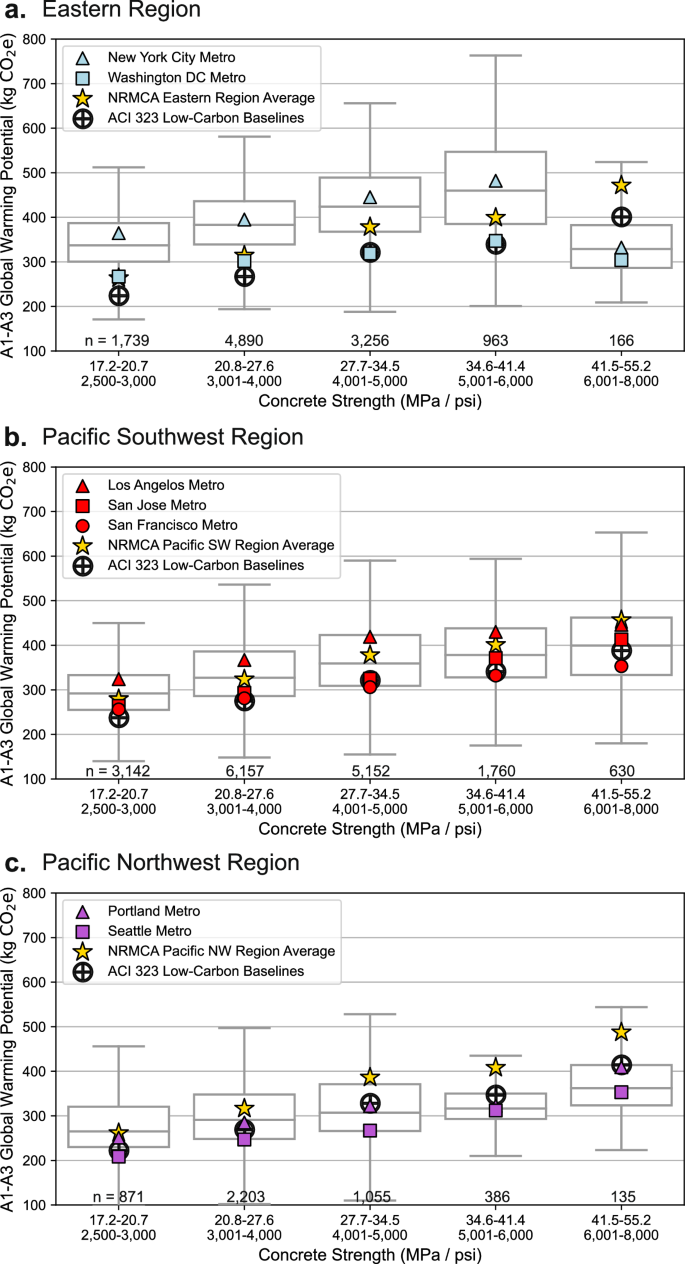
The relationship between GWP and five different concrete strength classes for the seven highly saturated metropolitans in the (a) Eastern, (b) Pacific Southwest, and (c) Pacific Northwest regions. We found that the five concrete compressive strength classes (p-values of 0.0294 and less) and three regions (p-values < 0.001) were statistically different from each other.
To better understand these differences, the A1-A3 GWPs were further analyzed by their individual life-cycle module (i.e., A1, A2, and A3) in the Production Stage. Figure 4 shows that raw material extraction (module A1) is the primary GWP contributor across regions. Transportation emissions (module A2) are the second-highest contributor, with the Eastern region having the highest GWPs (~ 80 kg CO2e) across almost all strengths, driven by the New York City metro. The Pacific Southwest and Pacific Northwest regions have much smaller A2 GWPs (60% to 70% lower) except at the highest concrete strength class. Ready-mix manufacturing emissions (module A3) have the lowest GWPs yet are generally highest for the Eastern region and lowest for the Pacific Southwest region.
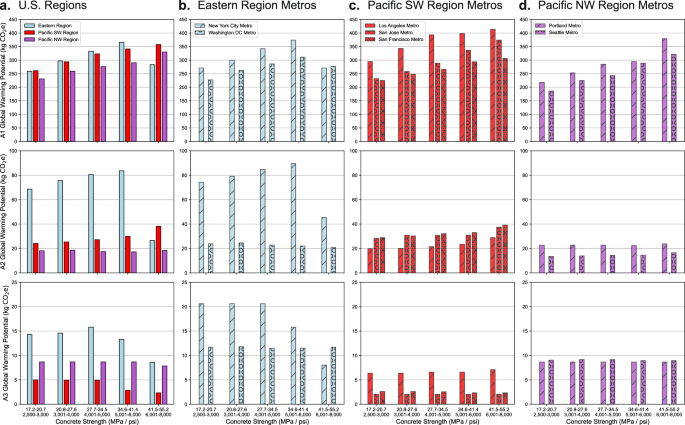
Breakdown of A1 (raw material extraction), A2 (material transport to plant), and A3 (manufacturing) GWPs for (a) all EPDs in the Eastern, Pacific Southwest, and Pacific Northwest regions, (b) the EPDs in the Eastern region metropolitans, the New York City and Washington DC metros, (c) the EPDs in the Pacific Southwest region metropolitans, the Los Angeles, San Jose, and San Francisco metros, and (d) the EPDs in the Pacific Northwest region metropolitans, the Portland and Seattle metros. We found the A1, A2, and A3 modules to be statistically significant from each other (p-values < 0.001).
Further analysis of EPDs in the seven metropolitan areas shows that concrete mixtures with supplementary cementitious materials (SCMs) have lower A1-A3 GWPs. Figure 5 presents the A1-A3 GWP distributions for EPDs with and without SCMs for the (a) Eastern, (b) Pacific Southwest, and (c) Pacific Northwest regions. Higher concrete strength classes (>34.5 MPa) have higher A1-A3 GWPs without SCMs than when SCMs are included, but regionality influences this difference. In the Eastern region, the A1-A3 GWP reduces by an average of 42% for high-strength classes, but in the Pacific Southwest and Northwest regions, the A1-A3 GWPs drop by an average of 17% and 21%, respectively. A regional effect is also noticeable for lower concrete strength classes (≤34.5 MPa). Although the A1-A3 GWP reduction is lower (an average of 26% less when using SCMs) for the Eastern region, the Pacific Southwest region has the same reduction at lower strength classes (17%), while the Pacific Northwest has a higher reduction with an average of 33%. This emphasizes that SCMs are a leading strategy across all metropolitans for lowering the GWP of high-strength concrete mixtures, but how well the SCMs are being utilized is dependent on concrete strength class and regionality.
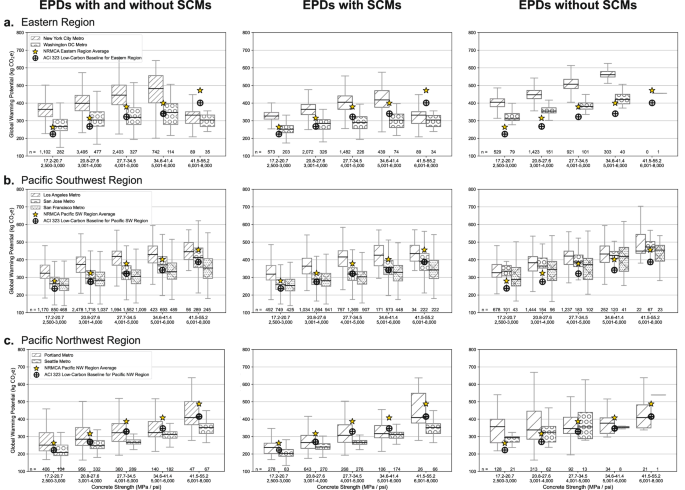
The GWP distributions are shown for the (a) Eastern, (b) Pacific Southwest, and (c) Pacific Northwest regions with the number of EPDs per box plot provided above the x-axis.
We also observed variations in the A1-A3 GWP between the metropolitan areas, as shown in Fig. 5. For example, in the Pacific Southwest region, concrete mixtures with SCMs in the San Jose and San Francisco metros have lower median A1-A3 GWPs than those specified for the region. Contrastingly, the Los Angeles metro consistently higher A1-A3 GWPs across concrete specifications, even with SCMs. Similar trends can be seen in the Eastern and Pacific Northwest regions, reinforcing that granular low-carbon benchmarks should replace regional benchmarks.
Metropolitans and regions with insufficient data: areas for improvement
While highly data-saturated metropolitans can set local-level targets, many metropolitans and regions require more EPDs to set low-carbon concrete benchmarks. The concrete EPD dataset used here represents a snapshot in time; however, 12 metropolitans (24% of the 50 most populous U.S. metros) do not have any concrete companies with publicly available EPDs, and another 26 metropolitans (52%) have fewer than 500 EPDs. It should be noted that while certain metropolitan areas do not have any EPDs represented in the dataset used in the analysis of this paper, other databases (i.e., EC343) may have EPDs affiliated with the metropolitan. Supplementary Fig. 2 reveals that 60.3% of the metropolitan population considered is within data unsaturated or semi-saturated metropolitans, underscoring the need for more data to understand A1-A3 GWP performance. Many underperforming metropolitans are in the Great Lakes, South Central, and Southeastern regions (see Supplementary Figs. 3 and 4), preventing GWP benchmarks from accurately representing these regions.
Figure 6 shows the A1-A3 GWP distributions for the five regions (Great Lakes, North Central, Rocky Mountains, South Central, and Southeastern) with metros that did not have highly saturated EPD data, alongside NRMCA regional averages and ACI low-carbon baselines. This comparison shows discrepancies between the target values and the median A1-A3 GWPs across these five regions, confirming the need to set local A1-A3 GWP targets based on the data available. The median A1-A3 GWPs are generally higher than the ACI baselines, implying that low-carbon concrete specification would be challenging in these regions. The exception is the North Central region, where 50.8% of the EPDs are below the ACI low-carbon baselines when evaluating across all concrete compressive strength classes (see Supplementary Table 2 for more information). This is partially due to how the North Central region has only one metropolitan (Minneapolis-St. Paul-Bloomington, MN-WI) that accounts for 64.6% of the EPDs in the region. Within the Minneapolis metro area, 78.6% of the concrete mixtures with an EPD specify Type 1 L cement as a constituent, with another 13.2% of the mixtures having an SCM. This suggests that the Minneapolis metro may be able to specify more stringent local-level A1-A3 GWP targets than the regionally averaged A1-A3 GWP baselines.
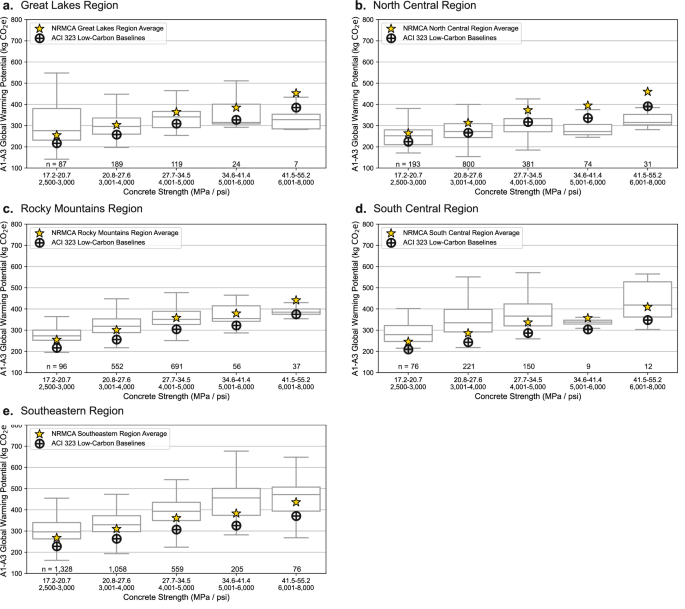
The relationship between GWP and five different concrete strength classes for the (a) Great Lakes, (b) North Central, (c) Rocky Mountains, (d) South Central, and (e) Southeastern regions which have metropolitans with insufficient data.
To better identify U.S. metropolitan hot spots that need more EPD data, we compared the U.S. Census Bureau data from 2020 to 202342. Using the average population percent difference (refer to Supplementary Table 3), we show that 18 metropolitan areas are growing, with population increases greater than 0.5%, the national growth rate from 2022 to 202344. Yet, of these metropolitan areas, 3 have no published EPDs, another 8 have less than 100 EPDs, and 5 metros have less than 500 EPDs. Only two metropolitans (the Atlanta, GA and Phoenix, AZ metros) are classified as data saturated, with 890 EPDs and 640 EPDs, respectively. While these two metropolitans may be able to define GWP benchmarks and targets, 16 other urbanizing metropolitan areas (representing 26.8% of the metropolitan population) are limited until more concrete EPDs are published. Furthermore, the Southeastern and South Central regions combine to have 12 of the 13 largest growing metropolitans, underscoring that EPD data availability is not uniform across the U.S. (refer to Supplementary Figs. 3 and 4) Focused efforts on publishing concrete EPDs must happen in these regions as they are forecasted to further urbanize45,46.
Discussion
The specification of low-carbon concrete regional benchmarks is a promising starting point; however, our results demonstrate that the current regional approaches are hampered by a lack of data quantity and granularity. The most critical finding in our study is that the current availability of accessible ready-mix concrete mixture EPDs is highly correlated with urban areas, with 85.3% of EPDs originating within 60-miles of a U.S. metropolitan. The New York City and Los Angeles metropolitans account for 41% of these EPDs, skewing the A1-A3 GWP values for the Eastern and Pacific Southwest regions. However, metropolitans with highly saturated data should establish their own GWP benchmarks tailored to the ready-mix concrete plants that serve their cities, which is similar to the proposal by Terán-Cuadrado et al. for locally defining concrete functional units47. Highly populated metropolitans that are data insufficient (i.e., the Chicago and Dallas metros) prevent a strong correlation between population size and the number of EPDs available. Furthermore, our geospatial analysis of concrete EPDs uncovered national data gaps in the Great Lakes, South Central, and Southeastern regions, highlighting the need for updated regional low-carbon concrete benchmarks, with local benchmarks defined as more EPDs are published for metros with insufficient data.
We demonstrate that granularized metro-level GWP specification is essential for specifying low-carbon concrete, including in the A1-A3 modules. Our analysis of A2-A3 GWPs indicates opportunities to reduce CO2 emissions in transportation and production, though the A1 module emissions remain the largest GWP contributor across all metros. For example, reducing A2-A3 emissions from the Eastern Region to Pacific Southwestern region levels can reduce around the A1-A3 GWP by 15%. We also note that the median A1-A3 GWP values differ significantly across metropolitans within the same NRMCA-specified region or state. When comparing the median GWPs to the proposed ACI low-carbon threshold, metros in the Eastern, Pacific Southwest, and Pacific Northwest regions typically have 25% or fewer concrete mixtures meeting this threshold at the lowest compressive strength classes. However, we found that the percentage of mixtures below this threshold increases for higher strength classes (>34.5 MPa) because the use of SCMs increases. Our analysis reinforces the pivotal role of cement replacements in meeting the proposed low-carbon threshold. However, metropolitans may need to rely on other technologies (e.g., carbon capture storage) to meet net-zero emission goals48.
Metropolitan differences in concrete mixture A1-A3 GWP also arise from exogenous factors and local conditions49, impacting the fair implementation of low-carbon benchmarks for concrete. Although not confirmed by EPD assessments, it is plausible that factors, such as aggregate quality, vary across the U.S., leading to higher cement contents in ready-mix concrete formulations and increasing the A1 GWP observed in our findings. In other metros, while high-quality concrete products may be available, we notice increased A2 GWP emissions due to farther trucking or shipping distances, or greater use of SCMs50. Hence, differences in manufacturing (A3) can further contribute to GWP discrepancies. We find these findings to be encouraging for concrete producers in metropolitans (e.g., the New York City metro) that have above average GWP emissions in the A2-A3 modules, as there are multiple pathways for reducing the GWP of concrete mixtures. Furthermore, our results show a regional effect on how well concrete mixtures with SCMs reduce the A1-A3 GWP51. While the Eastern region greatly reduces (by 42%) the A1-A3 GWP for higher-strength concrete mixtures, the Pacific Northwest has more success at reducing the GWP for lower-strength classes. These results motivate the standardization and commercialization of local alternative cementitious materials with ultra-low GWPs25.
We also found that many urbanizing metropolitans in the U.S. have insufficient EPD data, preventing the establishment of metro-level GWP benchmarks. More established metropolitan areas such as the Austin (Austin-Round Rock-Georgetown, TX) and Nashville (Nashville-Davidson–Murfreesboro-Franklin, TN) metros are experiencing population growth ( + 1.3%) yet have zero published concrete EPDs. Less populated cities, including the Raleigh (Raleigh-Cary, NC) and Jacksonville (Jacksonville, FL) metros, are experiencing significant population growth (from +2.0%) yet combined have 116 EPDs. More EPDs are needed in these hot spots to better define concrete GWP benchmarks and support designers towards low-carbon cities. Although more published EPDs can help San Francisco, Los Angeles, San Jose, and New York City better define GWP benchmarks and targets, we found that these are the four metropolitan areas with the largest decrease in population size (from −0.8% to −1.2%) from 2020 to 2023 (refer to Supplementary Table 3)46. To this end, our findings demonstrate a national imperative for EPDs in urbanizing cities that currently have insufficient data and are excluded from national discourse on low-carbon benchmarking.
This study underscores the need for metropolitan-level GWP targets due to the large discrepancies among geographically similar metros. Professional organizations, such as ACI, and local policymakers of large metropolitans with many public EPDs (e.g., the New York City and Los Angeles metros) should provide additional GWP targets for the A1, A2, and A3 modules to promote low-carbon material extraction, transportation, and manufacturing. Defining these metro-level A1-A3 GWP targets for concrete mixtures, including their use of SCMs, can incentivize the use of burgeoning carbon-negative feedstock materials (e.g., CO2-sequestering cement replacements and new alternative cements) and optimized particle-packing models (i.e., advanced methods for optimizing the spatial arrangement of aggregates) for concrete proportioning. Furthermore, the definition of low-carbon concrete A1-A3 GWP targets should also be set at the metropolitan level. While the ACI 323 Committee is currently proposing that a low-carbon concrete mixture has a GWP lower than 85% of the NRMCA-specified regional benchmark for a given strength36, local differences in the GWP distribution suggest that alternative values would be more appropriate.
Lastly, our results motivate the need for additional EPDs in data-unsaturated regions and metropolitan areas with data transparency to encourage the establishment of metro-level A1-A3 GWP targets, as has also been previously motivated both nationally52 and globally38,53. Established (i.e., the Chicago and Dallas metros) and growing metropolitan areas (e.g., the Austin and Nashville metros) would benefit from more public concrete EPDs becoming available as national benchmarks to define low-carbon concrete are established. Related, it is critical that the ready-mix concrete PCR37 improves, as it currently does not differentiate how the concrete mixtures are utilized. This trickles down to the EPD, as it is often unclear what the application for different concrete mixtures is54. We strongly recommend modifying the existing ready-mixed concrete PCR, which could then inform GWP targets for different concrete mixture functions at the metropolitan level.
Our findings motivate several important opportunities for future research. Most importantly, as more EPD data is obtained, studies must be conducted to determine a statistical method for specifying local-level concrete A1-A3 GWP benchmarks, reference values, and targets in accordance with ISO 2167855, which defines the guidelines to establish environmental performance benchmarks for buildings and civil infrastructure. These studies should engage various stakeholders, as low-carbon GWP targets will impact concrete manufacturers, building designers, and policymakers. Determining the GWP distributions of concrete mixtures for different uses can enable future studies to determine the GWP ranges associated with concrete applications in various building types on a per capita and per conditioned floor area basis (i.e., coupling the analysis done in this study with a building stock analysis56). Related, future analyses should evaluate the relationship between building characteristics, use types, and building codes to the A1-A3 GWP of concrete mixtures to better determine what design characteristics cause the largest increases in carbon emissions attributed to concrete structures. While our study primarily focused on GWP as an important midpoint indicator of environmental impact, future studies should evaluate the national variability of other LCA midpoint indicators as their regional effects, such as in the case of acidification potential (e.g., acid rain), have direct impacts at the metropolitan level. This type of metro-level analysis can be extended to urbanization trends and social health indicators to inform nationwide health-environmental regulations further and serve policymakers to inform the definition, production, and impact of low-carbon concrete.
Methods
Ready-mix concrete mixture EPD database collection, filtering, and feature selection
Ready-mixed concrete mixture EPDs were obtained from public repositories of EPDs provided by ASTM and NRMCA. As detailed in Broyles et al.57, a custom Python script was developed to mine the concrete plant street addresses, concrete mixture details (i.e., compressive strength, product composition), and LCA data from each ready-mix concrete EPD. The data obtained was then compiled into a single database published on a public repository, Mendeley Data43. This paper used version 3 of the dataset, which includes 44,154 EPDs published before May 1st, 2023. Version 3 includes EPDs from 71 concrete manufacturers and 501 ready-mix concrete plants in 33 of the 48 states in the continental U.S. However, more ready-mix concrete EPDs are published every week58. Therefore, the results presented should be considered only as a snapshot valid to inform current low-carbon concrete specification discussions. Yet, the methods outlined here can be replicated regularly to inform the progress of granular low-carbon concrete specifications toward meeting decarbonization goals.
Our study aimed to maximize the utilization of all EPDs available to understand the real data that design practitioners and policymakers have access to; however, several filter layers were needed to ensure the fair comparison of concrete A1-A3 GWPs. The concrete EPD database was filtered by removing all concrete mixtures that did not have a curation time of 28 days, did not have a compressive strength between 17.2 MPa to 55.2 MPa (2500 psi to 8000 psi), and were outside of the continental U.S. (i.e., EPDs based in Alaska or Hawaii were filtered out). Another filter checked that all EPDs in the database were valid and found that the first EPD is invalid starting after January 5th, 2025. Although additional layers (e.g., removing lightweight concrete mixtures) could be applied, these were not considered in our study because an assumption would have had to be made based on the concrete mixtures’ labeling, description, and product components provided on its EPD. Although some EPDs have clear labels and descriptions, many EPDs are unclear59. Because of this inconsistency, a filter based on concrete mixture type or application was not included. In all, the number of removed EPDs totaled 4618 concrete mixtures, leaving 39,536 ready-mixed concrete mixture EPDs for analysis.
In this study, not all database features provided in the dataset were analyzed43. Specifically, the full address of the ready-mixed concrete plant, the EPD validity dates, the concrete compressive strength, the curation time, the declared unit of the EPD, the product components used in the concrete mixture, and the GWP for LCA modules A1, A2, and A3 were evaluated. The address of the concrete plant was used to determine the NRMCA-defined U.S. region and was geospatially mapped to determine if the plant services a metropolitan area. The concrete mixtures within the concrete compressive strengths of 17.2 MPa to 55.2 MPa were binned into five compressive strength classes: 17.2 MPa to 20.7 MPa, 20.8 MPa to 27.6 MPa, 27.7 MPa to 34.5 MPa, 34.6 MPa to 41.4 MPa, 41.5 MPa to 55.2 MPa, which are commonly specified in various concrete infrastructure in urban areas60,61. The product components considered as SCMs were fly ash, silica fume, slag cement, fiber, Pozzolan, and pigment. While other cements (i.e., Type 1 L cements) and technologies (i.e., carbon cure) were specified in some concrete EPDs, we did not extensively investigate them in our study.
While there are other LCA midpoint indicators included in the database (e.g., acidification potential, freshwater consumption), this study concentrates on the GWP values (in kgCO2e with a declared unit of 1 m3) of the concrete mixtures. Additional dataset features, such as the life cycle inventory (LCI) sources and percentage of environmental impact that cement accounts for are not considered. However, future studies could consider the LCI variability to better determine the concrete GWP variability reported in EPDs62,63.
Spatial heterogeneity and statistical analyses
The 39,536 EPDs considered in this study were categorized based on the geographical location of the ready-mixed concrete plant. Using the state location of the concrete plant reported on the EPD for each concrete mixture, all concrete mixtures were grouped into the eight NRMCA-defined U.S. regions34: the Eastern Region, the Great Lakes region, the North Central region, the Northwest Pacific region, the Southwest Pacific region, the Rocky Mountain region, the South Central region, and the Southeastern region.
Second, the concrete mixtures were grouped by metropolitan area using the U.S. 2023 census data42, which defined the 50 most populous U.S. metropolitan areas. The full address provided on the EPD of each concrete mixture was mapped to the closest metropolitan area. A concrete mixture was considered within a given metropolitan area if the ready-mixed concrete plant was within a 60-mile drive from the center of a city specified in the metropolitan area. The driving distance was checked for metropolitan areas labeled with two or more cities. The 60-mile threshold is considered a conservative upper limit driving distance, as many concrete manufacturing plants are located on the outskirts of urban areas. Driving distances were obtained using the Google Maps API64. Concrete plants that were beyond the 60-mile threshold were categorized by the U.S. state where the plant is located.
The U.S. 2023 census data42 was also used to determine the population size of each metropolitan area. Only the 50 most populated metropolitans, according to the population size reported in 2023, were considered. The census dataset also provided the population sizes of the metropolitans for 2020, 2021, 2022, and 2023. The population sizes across this time span was used to determine the average population percentage differences (see Supplementary Table 3), which were used to identify urbanizing (hot spot) metropolitan areas.
Statistical ANOVA tests
To statistically validate the GWP differences between concrete mixtures, Analysis of Variance (ANOVA) tests were conducted. First, the filtered concrete mixture EPD database was truncated to three different groups: A1-A3 GWP, concrete strength class, and NRMCA-specified region. A homoscedasticity test was then performed to assess if the groups had normal and equal variances. However, the groups were not normal and had unequal variances, so Welch ANOVA tests were used with Games-Howell post-hoc tests to apply a p-value correction65.
Defining EPD data highly saturated, saturated, semi-saturated, and unsaturated limits
Each metropolitan area was categorized into four categories based on the number of EPDs in the filtered dataset: data highly saturated, data saturated, data semi-saturated, and data unsaturated. Any metropolitan under 100 EPDs was in the data unsaturated bin. Between 100 EPDs and 499 EPDs, metropolitans were categorized as having semi-saturated concrete EPD data. From 500 to 999 EPDs, metropolitans were categorized as having saturated data, and any metropolitan with 1000 or more EPDs was deemed as having highly saturated data. These numbers were selected because they represent a clear hierarchy regarding the total EPD count in a metropolitan area. The number of EPDs required to define benchmarks would be based on the amount (and quality) of the EPDs available, in addition to the metro-level GWP distribution and features considered (e.g., concrete compressive strength, application). To this end, metropolitans would have varying thresholds to define concrete GWP benchmarks, yet it is reasonable to believe that metropolitans above 1000 EPDs have enough data to do so. As mentioned for the case of the Minneapolis metro, certain metropolitans that have above 500 EPDs may have enough data to also establish GWP benchmarks, but further analyses should be conducted to confirm this.
A shortcoming with this assumption is that the number of EPDs may not be an accurate representation of the amount of concrete produced in a metropolitan area. Because EPDs do not currently report the annual and forecasted production of a given concrete mixture, it is not known if certain EPDs should be given more weight in determining if a metropolitan is data saturated and what the concrete GWP benchmark should be. Although the 2022 NRMCA regional benchmark report based their GWP averages based on the concrete produced at ready-mix concrete plants34, this data is not included in the report, preventing a more granular analysis. Revising the requirements of ready-mix concrete EPDs to report the annual or forecasted concrete production would address these issues.
Methodological assumptions
While this study is the first of its kind to comprehensively evaluate ready-mix concrete mixtures at the metropolitan level, there are important limitations and assumptions in this work that must be considered. First, this study is not intended to explicitly define the concrete GWP benchmarks, or targets, for any metropolitan area but to emphasize why further granularity is needed. This is in part because the addition of more ready-mixed concrete EPDs could change the A1-A3 GWP targets; therefore, the median A1-A3 GWPs presented should only be considered a snapshot. It will be necessary for local policymakers and engineering organizations to annually update the A1-A3 GWP benchmarks and targets as more data becomes available66, while also accounting for local improvements in concrete mixture design, transportation, and manufacturing. Additionally, we do not forecast how policymakers will apply the ACI 323 code, and similar low-carbon concrete codes. Yet because U.S. building code legislation is typically governed by the most stringent building code, city-level governments can define specific low-carbon concrete mixture GWP requirements tailored to their metropolitan area that can be stricter than low-carbon building code requirements provided at the state- and national-levels. Therefore, U.S. metropolitan areas with highly saturated EPD data could define local-level GWP requirements that are stricter than the GWP requirements defined by the ACI 323 code when applied at the national-level.
Another important limitation is data availability beyond what is reported in ready-mix concrete EPDs. Only the A1-A3 GWP of concrete mixtures can be assessed because these are the only LCA modules reported in concrete mixture EPDs. Also, this analysis does not consider the amount of concrete produced per EPD included in the filtered dataset. Therefore, further data transparency is needed to account for (and weigh) concrete mixtures more fairly and establish local GWP benchmarks. A similar limitation is that ready-mix concrete EPDs do not currently report the use for each concrete mixture, preventing more specified analyses on the GWP of concrete in different infrastructure applications (e.g., pavement, foundation, structural slab).
A 60-mile driving distance was also selected to determine if a concrete plant is within a metropolitan area. This assumption was chosen because many ready-mix concrete plants are located on the outskirts of cities and urban areas, and the 60-mile radius is a conservative limit for grouping metropolitan areas67,68,69,70. Shorter distances could be considered when local policymakers specify GWP targets or employ circular economy practices71, with the distance tailored to the population size and footprint of the metropolitan area69,70.
Related, only the top 50 most populous U.S. metros, as defined in the 2023 census42, were considered. The 2022 U.S. census72 had two other metropolitans (Hartford, CT and New Orleans, LA) that did not appear in the 2023 census and were thus not included in our study, despite that the Hartford metro had EPDs represented in the EPD dataset. Smaller urban areas (e.g., Colorado Springs, CO and Reno, NV) are also represented in the concrete EPD dataset but are not considered in this analysis, yet it suggests that a concrete GWP analysis of all metropolitans may be possible as more data becomes available. Less populated cities and rural areas are known to have more floor space per person than highly populated metropolitan areas, thereby requiring the use of more concrete on a per-capita basis. Therefore, smaller cities and rural areas must also define local concrete GWP targets as more EPD data becomes available.


Responses