Dissecting biological heterogeneity in major depressive disorder based on neuroimaging subtypes with multi-omics data

Introduction
Over the last few decades, the recognition of Major Depressive Disorder (MDD) as a condition of inherent heterogeneity has posed significant challenges to the conventional diagnostic framework that relies on symptom clusters [1]. This heterogeneity is characterized by a significant mismatch between symptom dimensions and their biological underpinnings, where identical symptoms may arise from different biological causes, and disparate symptoms may reflect similar biological changes [2, 3]. Such discrepancies make it necessary to develop precise diagnostic and therapeutic strategies based on the disease’s underlying mechanisms. Despite extensive efforts, the identification of reliable biomarkers for MDD diagnosis remains elusive. Furthermore, the prevalent trial-and-error approach in the current diagnostic system yields disappointing outcomes, with less than one-third of MDD patients experiencing remission after initial treatments [4,5,6]. About one-third of patients do not achieve clinical recovery even after undergoing 12-week courses of four distinct antidepressants over a year [7]. The intricate heterogeneity of MDD plays a significant role in these diagnostic and treatment dilemmas. Strategically redefining MDD into biologically homogeneous subtypes, guided by objective biomarkers, could pave the way for more accurate and effective precision diagnostics and treatments.
With the rapid advancement in biotechnologies, researches into MDD adopt multiple biological characteristics, including neuroimaging [8,9,10], electroencephalography (EEG) [11, 12], and multi-omics molecular profiles [13,14,15], to delineate biological subtypes. Neuroimaging stands out as a pivotal intermediate phenotype bridging the gap between etiology and behavioral manifestations [16, 17]. Studies have employed functional, structural, and diffusion tensor imaging to categorize MDD patients into subgroups with homogenous neuroimaging patterns [18, 19], providing significant insights into the categorization and therapeutic management of MDD. The Amplitude of Low-Frequency Fluctuations (ALFF) is a neuroimaging metric for measuring local spontaneous neuronal activity during rest. It has been validated for high test-retest reliability, establishing its utility as a regional functional measure to discern individual differences [20, 21]. In prior research, we observed alterations in the ALFF metric within specific brain areas, including the prefrontal cortex, occipital lobe, hippocampus, and amygdala of MDD patients, facilitating the delineation of subtypes in MDD [22, 23].
Despite prior studies having classified MDD into relatively homogeneous subtypes using neuroimaging features, limited researches have verified their underlying biological mechanisms at the multi-omics level. Most studies focused solely on comparing their symptomatology, or indirect verification through publicly available databases. It is noteworthy that existing etiological hypotheses, such as the monoamine hypothesis [24], polygenic hypothesis, immuno-inflammatory hypothesis [25], mitochondrial dysfunction [26], and metabolic dysregulation [27], offer diverse insights into the biological underpinnings of MDD. However, none of these hypotheses can fully explain the pathological mechanism of MDD [3], supporting the biological heterogeneity of MDD. Different subtypes may have stronger associations with particular etiological theories. Defining biologically homogeneous subtypes through neuroimaging characteristics and corroborating their biological relevance with omics data from the same neuroimaging cohort will help elucidate the leading etiological mechanisms of each subtype, offering vital directions for precision medicine of MDD.
This study aims to identify subtypes of MDD based on ALFF and investigate the biological underpinnings using multi-omics data. In the present study, we recruited 327 MDD patients and 480 healthy controls (HC) and clustered MDD patients into three subtypes based on ALFF patterns. Subsequently, we conducted comparative analyses across various molecular levels, including pro-inflammatory cytokine, epigenetics, metabolomics, and genetics profiles, to delineate the predominant molecular alterations of each subtype.
Materials and methods
Participants
A total of 807 participants were included in this study, including 327 MDD patients and 480 HC. Patients with MDD were recruited from both inpatient and outpatient services at the Department of Psychiatry within the First Affiliated Hospital of China Medical University and Shenyang Mental Health Center. HC were recruited through local community advertisements and had no personal or family history of psychiatric disorders. All participants were independently evaluated by two trained psychiatrists. For participants aged 18 years and older, the Structured Clinical Interview for Diagnostic and Statistical Manual of Mental Disorders, Fourth Edition (DSM-IV) Axis I Disorders was employed. Participants under 18 years old were diagnosed using the Schedule for Affective Disorders and Schizophrenia for School-Age Children-Present and Lifetime version (K-SADS-PL). Exclusion criteria for participation included: (1) general contraindications for MRI, (2) a history of substance or alcohol abuse/dependence (3) head trauma with loss of consciousness lasting at least 5 min or any neurological disorder, and (4) any major concurrent medical disorder, such as preexisting cardiac, inflammatory, and/or autoimmune illness. The study was approved by the Medical Research Ethics Committee of China Medical University in accordance with the Declaration of Helsinki. Written informed consent was received from each subject or their legal guardian for young participants under 18 years old.
Clinical assessment
The Hamilton Depression Scale (HAMD) and the Hamilton Anxiety Scale (HAMA) were used to evaluate the severity of depressive and anxiety symptoms in all participants. Cognitive function was assessed by a computerized version of the Wisconsin Card Sorting Test (WCST), which provides five indices as follows: correct responses (CR), completed categories (CC), total errors (TE), perseverative errors (PE), and non-perseverative errors (NPE).
Neuroimaging data acquisition and preprocessing
MRI scans were acquired with a 3.0 T GE Sigma system (Sigma EXCITE HDx, GE Healthcare, USA) with a standard 8-channel head coil at the First Affiliated Hospital of the China Medical University, Shenyang, China. A restraining foam pad was utilized to minimize head movement. Participants received explicit instructions to remain in a relaxed state, keep their eyes closed, and refrain from any movement or falling asleep throughout the scanning. The functional images were performed using a gradient echo planar imaging (EPI) sequence, which was as following parameters: repetition time = 2000 ms, echo time = 30 ms, flip angle = 90°, field of view = 240 × 240 mm2, and matrix = 64 × 64. A total of 35 slices were acquired, each with a thickness/gap of 3 mm/0 mm. The scanning session lasted for 6 min and 40 s. The images underwent processing and analysis employing two toolkits: Statistical Parametric Mapping 8 (SPM8, http://www.fil.ion.ucl.ac.uk/spm) and Data Processing Assistant for R-functional MRI-fMRI (DPARSF, http://www.restfmri.net/forum/DPARSF). The specific parameters and processing of MRI data (Supplementary Methods S1) were consistent with our prior publications [28,29,30].
Identification of neuroimaging subtypes
The AAL90 atlas, a standard brain mask, was used to extract voxel-level ALFF values from the neuroimaging data, ensuring accurate mapping of these values to standardized brain regions for subsequent analysis. We utilized the singular value decomposition (SVD) algorithm to handle the high-dimensional ALFF data [31], resulting in 30 dimensions. Subsequently, we employed the K-means algorithm [32] to cluster MDD patients into distinct subtypes based on the 30-dimensional data. We tested cluster numbers ranging from K = 2 to K = 10, using the Dunn Index to evaluate the optimal K, where higher values indicate better clustering with more compact and well-separated clusters. These machine-learning algorithms were implemented using the scikit-learn library (version 0.22.2.post1) [33].
Measure of pro-inflammatory cytokines
Blood samples were collected from each participant via antecubital venipuncture between 8:00 AM and 12:00 PM on the day of the MRI scan. Immediately after collection, the samples were centrifuged at 3000 g for 5 min and stored at −80 °C until analysis.
Pro-inflammatory cytokine levels were measured from blood samples collected from participants. Levels of three common pro-inflammatory cytokines (TNF-αlpha, IL-6, and IL-1 beta) were measured using the Human Premixed Multi-Analyte Kit (R&D Systems, Inc., Minneapolis, MN, United States) with the Human Magnetic Luminex Assay. Samples were magnetically labeled using a human, magnetic, premixed, microparticle cocktail of antibodies (Kit Lot Number L120614).
Multi-omics data acquisition
Peripheral blood samples were collected from participants for multi-omics profiling. Genomic, epigenomic, and metabolomic profiles were measured in this study. To obtain genomic data, we genotyped DNA samples following standard procedures, employing the Illumina Global Screening Chip-24 v1.0 BeadChip for Han Chinese populations. This BeadChip comprises 642,824 predetermined genetic variants and 53,411 custom-designed mutation sites. Epigenomic profiles were derived using the Illumina Infinium Methylation EPIC BeadChip [34], facilitating the quantitative analysis of over 850,000 methylation sites across the genome with single-nucleotide precision. For the metabolomic profile, untargeted metabolomics and lipid-omics analyses were conducted on the Ultimate 3000 Ultra Performance Liquid Chromatography coupled with the Q Interactive Quadrupole-Orbitrap High Resolution Mass Spectrometer (UPLC-HRMS) [35]. Detailed information could be checked in our prior publications [28, 36].
Calculation of epigenetic inflammation scores (EIS)
We utilized the ChAMP R package [37] to load the raw DNA methylation data, and filter probes and samples by default parameters (Supplementary Methods S2). Then the probes were normalized and corrected for technical batch effects and cell heterogeneity. All DNA methylation levels were expressed as β values, ranging from 0 to 1, calculated as M/(M+U), where M is the signal from methylated beads, and U is the signal from unmethylated beads at the targeted CpG site.
The calculation of EIS is informed by methodologies established in prior research [38]. Specifically, we utilized findings from both the discovery and validation phases of a large-scale meta-analysis, involving 9 cohorts (n = 8863) and 4 cohorts (n = 4111) respectively, to select seven methylation sites significantly associated with plasma C-reactive protein (CRP) levels [38]. Due to the exclusion of one CpG site (cg06126421) from our dataset during quality control, our analysis proceeded with the six remaining CpG sites. The calculation involved multiplying the beta values of the six CpG sites by their respective regression weights and summing them to generate a composite score for each participant [39]. Given that all regression weights from the EWAS were negative, a lower EIS score is indicative of a higher state of inflammation, thus establishing a direct correlation between epigenetic markers and inflammation levels.
Estimation of epigenetic immune cell proportions
We utilized the reference-based GLINT method to assess the proportions of various immune cell types within each sample, relying on their methylation profiles [40]. This method estimates the proportion of monocytes, CD8+ cells, CD4+ cells, NK cells, B cells, neutrophils, and eosinophils according to the Houseman model, using a panel of 300 highly informative methylation sites in blood [41] and reference data collected from sorted blood cells [42]. It provides relative data of cell counts rather than absolute counts.
Identification of differential metabolites (DMs)
Following standard quality control procedures, a total of 669 metabolites were quantified. We applied linear regression modeling to identify the DMs associated with each subtype, incorporating ‘group’ as the independent variable and the relative abundance of each metabolite as the dependent variable, while adjusting for age, gender, BMI, and medication status as covariates. To account for multiple testing, we applied the Benjamini-Hochberg False Discovery Rate (FDR) correction, considering adjusted p values below 0.05 as statistically significant [43].
Calculation of polygenic risk scores (PRS)
Quality control of genomic data and imputation were performed before the calculation of PRS. The process included the exclusion of single nucleotide polymorphisms (SNPs) with a minor allele frequency (MAF) below 1%, a call rate less than 95%, or deviation from Hardy-Weinberg equilibrium (p value < 10−5), and the exclusion of participants with more than 5% missing data, gender mismatches, or an identity-by-descent (IBD) score greater than 0.9. The refined genotype data were imputed using the GenoImpute engine [44]. The international MDD GWAS results published by the Psychiatric Genomics Consortium were used as discovery samples (https://pgc.unc.edu/), and our imputed genotyping data were used as a target sample. In the paper by the Major depressive disorder Working Group of the Psychiatric Genomics Consortium (PGC), the specific genetic factors contributing to MDD were analysed in 135,458 people with MDD and 344,901 controls [45]. PRSs were generated using PRSice software (www.PRSice.info). P-value-informed clumping was performed with a cut-off of r2 = 0.1 in a 250 kb window. Seven PRSs at different p value thresholds (PT at 10−8, 10−7, 10−6, 10−5, 10−4, 0.001, 0.01) were derived for each study participant.
Statistical analysis
We performed a descriptive analysis to evaluate the demographic and clinical characteristics of the participants. The normality of continuous variables was determined using the Shapiro-Wilk test. These variables are presented as means ± standard deviations (SD), while categorical data are expressed as frequencies and percentages. To investigate differences among subtypes, ANOVA analyses were conducted for continuous variables, and chi-square tests were utilized for categorical variables. In the evaluation of clinical measures, encompassing both clinical symptoms and cognitive performance, we employed ANOVA to assess statistical differences among the identified subtypes and HC. This was followed by post-hoc comparisons using Tukey’s Honestly Significant Difference test to discern specific pairwise differences between the groups. A threshold of p < 0.05 was set to determine statistical significance.
To delineate the neuroimaging distinctions between subtypes and HC, we conducted a voxel-based two-sample t-test using the DPABI tool. Age and sex were included as covariates to mitigate potential biases, with statistical significance thresholds set at voxel p value of <0.001 and cluster p value of <0.05, corrected using the Gaussian random field (GRF) method.
Differences in pro-inflammatory cytokines, EIS, and proportions of seven immune cell types among the subtypes and HC were evaluated using ANOVA analysis respectively. To identify specific pairwise group differences, a post-hoc analysis was performed using Tukey’s Honestly Significant Difference test. A p value of less than 0.05 was considered to denote a statistically significant difference.
Pearson correlation analysis was used to investigate associations between DMs and significantly differed pro-inflammatory cytokines.
The association of PRS-MDD with each subtype was investigated using logistic regression embedded in the software PRSice, adjusted for the first 20 principal components, age, and gender. Nagelkerke’s pseudo-R2 was calculated to measure the proportion of variance explained. To explore the biological pathways associated with these genetic variants, we conducted gene ontology (GO) enrichment analysis on the genes mapped to the significant PRS. This analysis, performed using the “clusterProfiler” package in R [46], covered three categories: cellular components (CC), molecular functions (MF), and biological processes (BP). To account for multiple testing, we applied the Benjamini-Hochberg FDR correction, considering p adjusted values below 0.05 as statistically significant [43]. We visually presented the top 10 significant pathways within each category to clearly represent the results.
Exploratory Pearson correlation analyses were conducted to examine the relationships among multi-omics measures, ALFF values, and clinical symptoms within each subtype. In Subtype 3, no significant alterations in multi-omics data were detected; therefore, we only performed correlations between ALFF values and clinical symptoms.
Results
Characteristics of participants
Demographic and clinical characteristics of 327 MDD patients and 480 HC are presented in Table 1. There were significant differences between MDD patients and HC in age, gender, BMI, and education level. In clinical assessment, WCST scores (CC, CR, TE, PE, NPE), HAMD, and HAMA scores were significantly higher in MDD patients than in HC.
Identification of neuroimaging-based subtypes and their ALFF patterns
A total of 327 MDD patients were clustered into three subtypes based on ALFF data using the K-means algorithm, as determined by the Dunn Index (Fig. S1): Subtype 1 (28%), Subtype 2 (28%), and Subtype 3 (44%). Each subtype exhibited unique functional imbalance patterns in ALFF. In Subtype 1, ALFF was significantly elevated in limbic areas including the hippocampus, cingulate, amygdala, and thalamus, but notably decreased in the primary cortices such as the precentral cortex, occipital and postcentral cortex, in comparison to HC as depicted in (Fig. 1A). Subtype 2 showed a marked increase in ALFF within the prefrontal cortex and a decrease in the primary sensory cortices relative to HC (Fig. 1B). Conversely, Subtype 3 demonstrated a significant reduction in ALFF in the prefrontal cortex and an increase in the primary sensory cortices compared to HC (Fig. 1C). Detailed information about these region-specific alterations, aligned with the Automated Anatomical Labeling (AAL) atlas, is available in the Supplementary Table S1, S2, S3.

Brain charts display significantly differed brain regions in amplitude of low-frequency fluctuations (ALFF) in Subtype 1 A, Subtype 2 B, and Subtype 2 C compared to HC. The significance level was set to p < 0.05 (with Gaussian random field correction). L, left. R, right. The color bar represents the t-value. The elevated bar indicates a significant increase in ALFF of brain regions, and the lower bar indicates a significant decrease in ALFF in this subtype compared to HC. Red represents increased and blue decreased ALFF.
Demographic and clinical characteristics of the subtypes
In the comparison of demographic characteristics across the three identified subtypes and HC, significant differences were observed in gender, age, education and BMI level among the four groups (Table 1). The results of subsequent post-hoc analyses are presented in Table 1. Regarding clinical symptoms, post-hoc comparisons revealed that Subtype 1 had significantly higher HAMD scores than both Subtype 2 and Subtype 3. Subtype 1 also demonstrated more pronounced cognitive impairments in WCST than both Subtype 2 and Subtype 3. Specifically, Subtype 1 exhibited significantly lower CR scores and higher TE scores compared to Subtype 2. Subtype 1 had higher PE scores than Subtype 3. Detailed demographic and clinical statistical results are presented in Table 1.
Differences of Subtypes in molecular levels
Significant alteration of pro-inflammatory cytokine in Subtype 2
We compared the differences in pro-inflammatory cytokines among three subtypes and HC using ANOVA and post-hoc analysis. We found that IL-1 beta in Subtype 2 was more significantly elevated than HC (Fig. 2). TNF-alpha and IL-6 presented a trend of increased levels in Subtype 2, but did not reach statistical significance. This result indicated that Subtype 2 was in a higher inflammatory state than Subtype 1 and Subtype 3. Next, we further illuminate the inflammatory characteristics of Subtype 2 with multiple omics data.
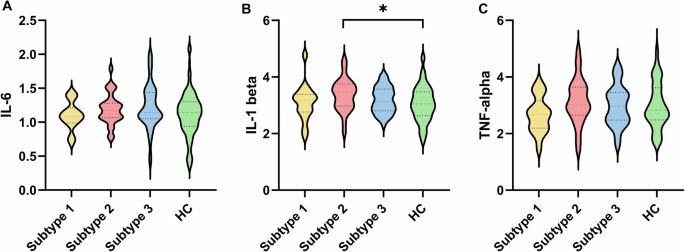
Violin plots of the changes of IL-6 A, IL-1 beta B, and TNF-alpha C between each subtype and HC. *p < 0.05.
Significant changes of inflammation indicators in methylation level underlying Subtype 2
EIS are refined indicators of chronic low-grade inflammation [47]. Distinct from traditional markers like plasma CRP levels, which are prone to significant variations in response to acute inflammatory stimuli, EIS provides a steadier reflection of chronic inflammation [48, 49]. The EIS, in particular, showcases enhanced test-retest reliability when compared to serum CRP levels, underscoring its value in offering a more reliable measure of inflammation’s temporal stability [39]. Subtype 2 exhibited a significantly lower EIS compared to HC, indicating a higher state of inflammation (Fig. 3A). Subtype 1 and Subtype 3 did not show significant differences in EIS, as illustrated in Fig. 3A.
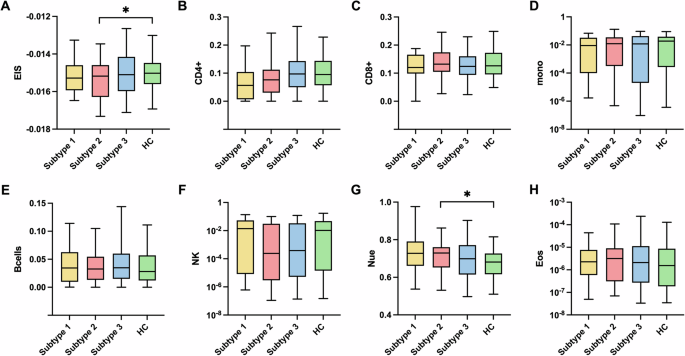
A The differences in EIS across three MDD subtypes and HC. B–H The differences in CD4+ B, CD8+ C, monocytes D, B cells E, NK cells F, neutrophils G, and eosinophils H cell proportions across three MDD subtypes and HC. A statistically significant distinction in EIS and neutrophil cell proportions was discerned between Subtype 2 and the HC. EIS, epigenetic inflammation score. *p < 0.05.
In the analysis of proportions of seven immune cell types derived from methylation data, Subtype 2 demonstrated a significantly higher proportion of neutrophils relative to HC, while the other six immune cell types showed no statistical significance (Fig. 3B–H). Subtype 1 and Subtype 3 did not show significant differences in the proportions of the seven immune cell types. Neutrophils are responsible for the first line of the host immune response against invading pathogens. They employ various mechanisms, including chemotaxis, phagocytosis, the release of reactive oxygen species (ROS) and granular proteins, and the production and release of cytokines, all of which contribute to inflammation [50, 51]. These findings suggest that Subtype 2 is primarily associated with increased inflammation.
Significant metabolomic alterations and the correlation with IL-1 beta level underlying Subtype 2
In the analysis of DMs, we observed significant metabolic disturbances in Subtype 2. Compared to HC, Subtype 2 exhibited 36 DMs, while Subtype 1 and Subtype 3 did not show any DMs (Fig. 4A–C). In 36 DMs, 9 fatty acids, 8 triglycerides, 1 peptide, and 1 microbiome metabolite showed higher abundance, while 7 organic acids, 6 amino acids, 1 carbohydrate, and 3 unclassified metabolites showed decreased abundance in Subtype 2 compared to HC (Fig. 4D, E).
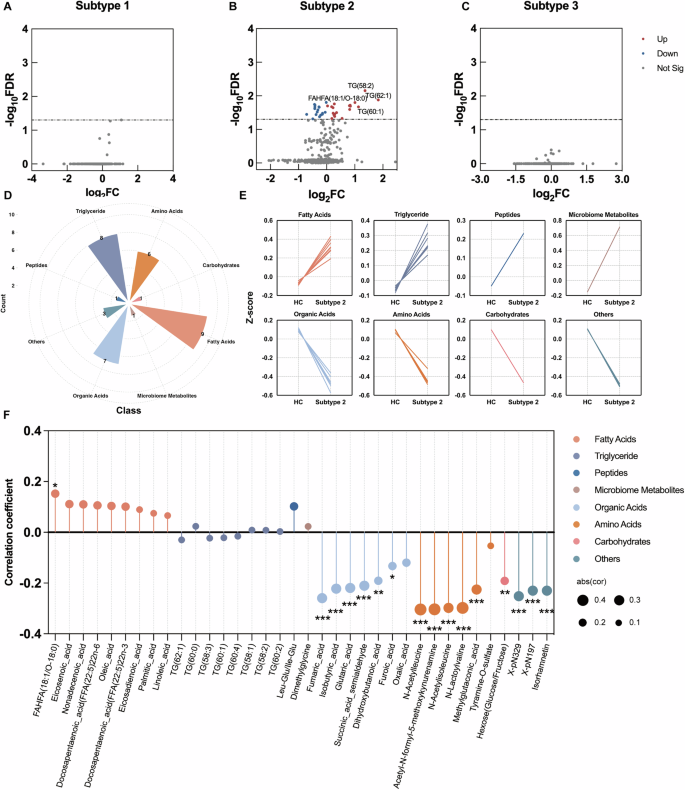
A–C Volcano plots of DMs related to MDD subtypes. D Nightingale Rose Chart of 8 DMs classes in Subtype 2, the different colors indicate different metabolite classes. E Line chart of DMs within 8 classes in Subtype 2 and HC groups. F Lollipop chart of the correlation coefficient between IL-1 beta and 36 DMs in Subtype 2. The x-axis denotes the 36 DMs in Subtype 2, and the y-axis represents the correlation coefficient. Calculated using Pearson correlation analysis. *p < 0.05 **p < 0.01 ***p < 0.001.
Pearson correlation analysis was used to further test the associations of DMs with IL-1 beta level, which was significantly higher in Subtype 2. 44% (16/36) of DMs significantly correlated with IL-1 beta levels in Subtype 2. Specifically, five of six amino acids: N-Acetylleucine, Acetyl-N-formyl-5-methoxykynurenamine, N-Acetylisoleucine, N-Lactoylvaline, and Methylglutaconic acid – were negatively correlated with plasma IL-1 beta. Similarly, six of the seven organic acids, including Fumaric acid, Isobutyric acid, Glutaric acid, Succinic acid semialdehyde, Dihydroxybutanoic acid, and Furoic acid, demonstrated significant negative associations with IL-1 beta (Fig. 4F).
Significant genetic predispositions underlying Subtype 1
PRS analysis revealed variation in genetic predispositions across the three MDD subtypes. Only Subtype 1 demonstrated significant genetic predisposition associated with MDD at PTs of 0.01 and 0.001 after adjusting for multiple comparisons (Fig. 5A). Subtype 2 and Subtype 3 did not exhibit a genetic liability related to MDD (Fig. 5B, C). Specifically, PRS-MDD at PT of 0.001 (P = 0.011, NSNPs = 1325) and 0.01 (P = 0.002, NSNPs = 4769) accounted for 5.9% and 8.1% of the phenotypic variance in Subtype 1, respectively. 4769 SNPs of PRS-MDD at the most significance threshold of PT = 0.01 were mapped to 2169 genes and found to be significantly enriched in pathways related to neuronal development and synaptic regulation. The top ten GO terms within each category were presented in Fig. 5D, mainly involved in ‘synapse organization’, ‘regulation of neuron projection development’, ‘axonogenesis’, ‘postsynaptic membrane’, ‘neuron to neuron synapse’, and ‘monoatomic ion gated channel activity’. A complete list of all significant GO terms can be found in Supplementary Table S4, S5, and S6.
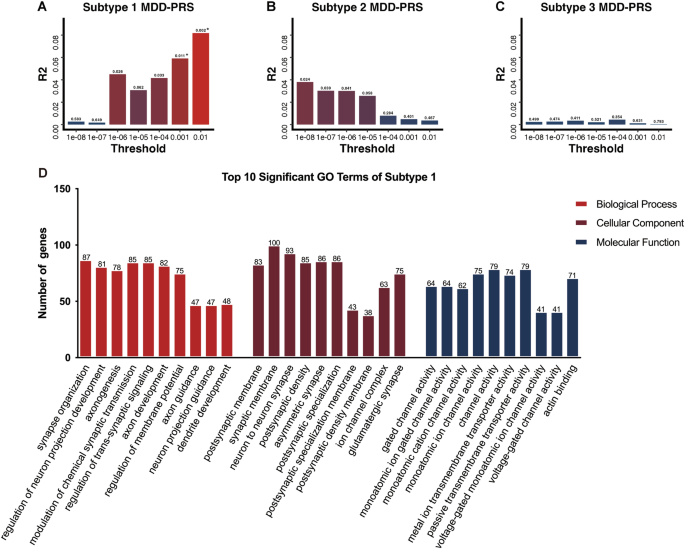
A–C Differential genetic predispositions of three MDD subtypes. The x-axis denotes the p value threshold, y-axis represents polygenic risk scores (PRS) model fit: R2 (Nagelkerke’s). The bars represent PRS calculated for MDD at seven different p value thresholds. * Indicates statistical significance with p adj < 0.05, corrected for FDR multiple comparisons. D Top 10 enriched GO categories for genes involved in the significant p value threshold (PT = 0.01).
Association among multi-omics measures, ALFF values and clinical symptoms within each subtype
For Subtype 1, we performed Pearson correlation analyses among the PRS for MDD at four significance thresholds (PT = 0.01, 0.001, 10−5, and 10−6), ALFF values from nine significantly different clusters, and clinical symptoms. PRS-MDD at PT = 0.001 showed significant correlations with ALFF values in Cluster 4 (middle temporal gyrus) and Cluster 7 (supramarginal gyrus), as well as with HAMD factor scores. Additionally, ALFF values in Cluster 4 were significantly associated with both HAMD total and factor scores (Fig. 6A). For Subtype 2, correlation analyses were conducted between the significantly elevated pro-inflammatory cytokine IL-1 beta, ALFF values from the nine significant clusters, and clinical symptoms. IL-1 beta was significantly correlated with ALFF values in Cluster 2 (occipital gyrus) and HAMD factor scores. ALFF values in Cluster 8 precuneus were also significantly correlated with four indices from the WCST (Fig. 6B). For Subtype 3, we analyzed correlations between ALFF values from eleven significant clusters and clinical symptoms. ALFF values in Cluster 8 (postcentral gyrus) were significantly correlated with one WCST index, and ALFF values in Cluster 10 (angular gyrus) were significantly correlated with HAMD factor scores (Fig. 6C).
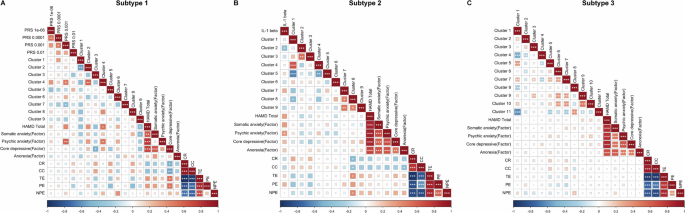
A Heatmap of Pearson correlation coefficients among polygenic risk scores (PRS), ALFF values and clinical symptoms within Subtype 1. B Heatmap of Pearson correlation coefficients among IL-1 beta, ALFF values and clinical symptoms within Subtype 2. C Heatmap of ALFF values and clinical symptoms within Subtype 3. The color bar indicates r-values, with red representing positive correlations and blue representing negative correlations. *p < 0.05 **p < 0.01 ***p < 0.001.
Discussion
In this research, the utilization of machine learning clustering techniques on functional neuroimaging features (ALFF) in MDD patients identified three distinct subtypes—Subtype 1, Subtype 2, and Subtype 3. Each subtype was characterized by unique ALFF patterns. These distinctions were further substantiated through comprehensive multi-omics biological profiling, enriching our understanding of the specific etiological factors underlying each subtype. Subtype 1 features an imbalance of brain activity between the limbic system and primary cortices, with increased ALFF in the hippocampus, cingulate, and amygdala, and decreased ALFF in the primary visual, sensory, and motor cortices. This subtype indicates a strong genetic predisposition toward MDD, primarily enriched in neuronal development and synaptic regulation pathways, accompanied by severe depressive symptoms and cognitive decline. Subtype 2 reveals a different pattern of ALFF imbalance, with increased activity in the higher-order cortices, notably the prefrontal cortex, and decreased activity in the primary cortices. Immune-inflammation dysregulation existed in Subtype 2, supported by multidimensional molecular evidence, including elevated IL-1 beta level, altered epigenetic inflammatory measures, and differential metabolites correlated with IL-1 beta level. Contrary to Subtype 2 in the ALFF pattern, Subtype 3 presents decreased activity in the prefrontal cortex and increased activity in primary cortices. There were no significant biological markers identified in Subtype 3. Our study showed that three subtypes may exhibit unique etiological mechanisms, with Subtype 1 predominantly influenced by genetic factors involved in neuronal development and synaptic regulation and Subtype 2 linked to immune-inflammatory processes. The variability of multidimensional features of subtypes reveals the complexity of MDD and highlights the potential of using neuroimaging-based subtypes to forge a path towards precision therapy in MDD.
Interestingly, all three subtypes demonstrate alterations in the primary sensory cortices, emphasizing their significance in MDD. Traditionally, the higher-order cortices and limbic system, known for their roles in cognitive and emotional regulation, have been the focus of the studies of neural mechanisms of MDD [52, 53]. The primary sensory cortices, tasked mainly with sensory input processing, have received less attention in MDD research. However, recent findings highlight the involvement of primary sensory cortices in higher-order functions, especially the visual cortex, suggesting its potential as a neuroregulatory target for alleviating depressive symptoms and improving cognitive function [54]. Our initial results from the MAM animal model, which revealed an imbalanced functional neuroimaging pattern between higher-order and primary cortices, showed that abnormal activity in the primary cortex has begun in adolescence, preceding abnormalities in the higher-order cortices that have appeared in early adulthood [55]. Studies by Jiang et al. on schizophrenia (SZ) patients examined the evolution of functional imaging features throughout the disease progression, revealing a gradual shift from the primary to higher-order cortices and subcortical areas as the disease advances [56]. These consistent observations indicate that changes in the primary cortex may be early indicators of psychiatric conditions like MDD and SZ, potentially making it a viable target for early intervention. Moreover, our prior animal study provided further support for these observations by demonstrating that targeted high-frequency repetitive Transcranial Magnetic Stimulation (rTMS) of the visual cortex during adolescence can reverse the abnormal functional connectivity in the higher-order cortex observed in early adulthood in a rat model of depression [57]. This outcome is further bolstered by human studies, where interventions targeting the visual cortex have proved effective for reversing abnormal neuroimaging and alleviating clinical symptoms [58] in mood disorders patients. Furthermore, one of our clinical trials showed that visual cortex stimulation significantly improved cognitive function in bipolar disorder (BD) patients [59]. These findings collectively suggest that primary cortices-targeted interventions may hold promising clinical utility.
The multi-omics evidence consistently indicates that immune-inflammatory dysregulation primarily drives the pathogenesis of Subtype 2. We observed a significant elevation of the pro-inflammatory cytokine IL-1 beta and pronounced metabolic dysregulation in Subtype 2 compared to HC. Notably, the disturbances in fatty acid, triglyceride, and amino acid metabolism were significantly correlated with IL-1 beta level. The association between immune-inflammatory damage and MDD has been robustly supported by human and animal research [60, 61]. Studies have identified increased levels of pro-inflammatory cytokines and acute response proteins in the plasma [62], central nervous system [63], and cerebrospinal fluid [64] of MDD patients, along with a rise in immune cells like neutrophils and monocytes [65, 66]. Clinical observations have shown that cytokine therapy, such as using IFN-α for chronic hepatitis, can lead to depressive-like behaviors, including anhedonia, anorexia, and reduced libido [67, 68]. Animal studies corroborate these findings, showing that inflammatory inducers like lipopolysaccharide (LPS) triggered depressive-like behaviors, such as decreased activity, appetite loss, and lowered sexual drive [69]. These findings suggest that at least a subset of MDD patients have immune-inflammatory damage.
Clinical trials have demonstrated promising evidence that anti-inflammatory treatments, both standalone and adjunct, can ameliorate depressive symptoms [70]. Targeted anti-inflammatory therapy, considering the biological heterogeneity of MDD, is especially crucial for patients with immune-inflammatory profiles. The challenge lies in accurately identifying this subgroup. Recent research has extended the use of molecular markers from cardiovascular to psychiatric domains, primarily utilizing molecular markers in peripheral blood for clinical stratification, such as CRP > 3 as an indicator of chronic inflammation [6]. These approaches offer valuable insights, yet the variability and potential somatic condition confounders of traditional peripheral inflammation markers hinder their clinical applicability. Neuroimaging features, serving as a conduit between peripheral inflammation and the central nervous system [71, 72], emerge as promising markers for identifying inflammatory subtypes in psychiatric disorders. In our study, distinct subtypes of MDD were identified based on ALFF, of which Subtype 2 was characterized by immune-inflammatory dysregulation and anti-inflammatory therapies would offer a promising adjunctive treatment modality for this subgroup.
Compared to Subtype 1 and Subtype 2, our multi-omics analysis did not definitively reveal the pathogenic mechanisms of Subtype 3, which shows neither significant genetic risk factors nor notable changes in inflammatory markers. We speculate that the etiology and pathological mechanisms of Subtype 3 are more complex and heterogeneous.
Limitation
Several limitations should be considered with regard to interpreting the current findings. Firstly, our whole-genome genetics and epigenetics data are limited in sample size, thus lacking the statistical power to identify specific genes or pathways associated with each subtype. This limitation prompted us to complement our analysis with large-sample-based validated results and summarized measures from whole-genome data, such as PRS and EIS, given the well-established understanding of MDD as a polygenic disorder. Secondly, not all MDD patients are medication-free, although there is no significant variation in medication use status among the three subtypes. Notably, medication does not influence the genetic profile. To address potential confounding effects, we included medication status as a covariate in our analysis of epigenetics and metabolomics data. Lastly, our study is cross-sectional, precluding the determination of direct causal effects of molecular alterations on each subtype. Future longitudinal studies are essential to explore the presence of causal relationships.
Conclusion
This study leveraged functional imaging to decipher the biological heterogeneity of MDD and employed multi-omics data to identify the primary biological mechanisms underlying the homogenous imaging subtypes: Subtype 1 is driven by genetic anomalies; Subtype 2 by immune-inflammatory dysregulation; and Subtype 3 by a complex mix. Our results offer a proof of concept for mechanism-targeted therapy in MDD.


Responses