Dopamine in the tail of the striatum facilitates avoidance in threat–reward conflicts

Main
In natural environments, animals often face the challenge of deciding whether to approach or avoid a situation before acquiring complete knowledge about it. Avoiding potential threats before experiencing catastrophic events such as injury or death is critical for animals’ survival. However, being overly cautious can be detrimental since it may prevent animals from meeting essential needs, such as obtaining food. Previous studies of threat-driven behaviors have identified specific neural circuit mechanisms for threat avoidance and extinction across various animal species1,2,3. While fear extinction has been a powerful model, threat coping requires additional components that may not be fully captured by this conventional framework. First, although painful stimuli are commonly used in extinction studies1,2,3,4,5, natural threat avoidance is not necessarily caused by physical pain but often by potential threats. Second, threat coping requires balancing threat avoidance against other factors, such as food or mating opportunities. When animals overcome a potential threat under a threat–reward conflict, they might need to temporarily suppress the effects of the threat to satisfy other demands. It remains unclear how the brain assesses and learns the level of a potential threat and decides whether to avoid or overcome it while preserving knowledge of the threat.
The striatum is important for promoting or motivating actions. Dopamine release in the striatum modulates its information flow through two parallel and largely opponent striatal pathways: so-called direct and indirect pathways via D1 and D2 striatal neurons, respectively6,7. There are various models for how these neuron types work together. Some studies propose that D1 and D2 neurons oppose each other to promote or inhibit approach to and learning of rewarding stimuli, while some propose they cooperate to promote an appropriate action while inhibiting other actions8,9. Recent studies have found a unique subpopulation of dopamine neurons that appear to function differently from these canonical circuits. Dopamine neurons that project to the tail of the striatum (TS), a sensory domain of the striatum, receive distinct sets of presynaptic inputs10 and show distinct activity patterns; this subpopulation of dopamine neurons signals novelty and physical salience of external stimuli in multiple sensory modalities11,12 but does not reliably signal reward in rodents and monkeys12,13. Despite the lack of reward responses in dopamine signals, TS was thought to represent reward values such as object values14 and action values15, similar to other striatum areas. However, ablation of TS-projecting dopamine neurons inhibits the avoidance of aversive stimuli, without affecting reward value-based behavioral choices12. Thus, understanding the exact roles of TS is critical for comprehending the functional organization of the striatum and to moving beyond its hypothesized role in reward processing.
In the present study, we examine the interplay between dopamine and neurons in TS under a threat–reward conflict to test the role of TS in reward approach versus threat avoidance. To mimic natural circumstances, mice freely foraged in the presence of a potential threat (a moving object), without experiencing any pain. In this paradigm, mice progressively exhibited distinct threat-coping behaviors. We demonstrate that dopamine in TS suppresses reward acquisition under threat–reward conflict. Furthermore, D1 neurons promote avoidance, while D2 neurons enable threat overcoming, exerting opposing effects on behavioral output (threat avoidance). We also present evidence that dopamine in TS biases D1 versus D2 neuron pathways both acutely and in a longer term through plasticity. Our results reveal a specialized module of dopamine–striatum systems for threat coping, yet similar functional architectures (opposition of D1 and D2 neuron pathways) across diverse dopamine–striatum systems.
Results
Dynamical threat-coping behaviors
To gain insight into the mechanisms underlying the avoidance of a potential threat, we implemented a recently established ‘monster’ paradigm using a fictive predator16,17. In this paradigm, mice freely forage in an open arena where they occasionally encounter an unfamiliar moving monster object (Fig. 1, Extended Data Fig. 1 and Supplementary Videos 1 and 2). At the start of each trial, the door opens, allowing the thirsty mouse to leave its shelter in search of a water reward in the foraging arena (Fig. 1a). Once the mouse returns to the shelter, the door closes, and the next trial starts after a brief delay. In some sessions, a monster object was set at the far end of the foraging arena. In these sessions, an invisible line marks the monster territory, and when the mouse crosses this line, the monster would ‘charge’, moving back and forth and emitting a loud noise until the mouse returns to the shelter.

a, Schematics of the monster paradigm (left) and test schedule (right). b, A heat map depicting the returning point, defined as the furthest point along the arena that the mouse reached before returning to the shelter, for each mouse and each trial. c, A time course of avoidance rates (mean ± s.e.m.). d, Left: the rates of predictive avoidance were higher in the monster sessions than in the control sessions (P = 2.7 × 10⁻⁴, paired t-test). The error bars represent the s.e.m. The regression coefficients of the rate of predictive avoidance with trial number in day 1 for each animal are significantly positive (P = 6.1 × 10⁻⁶, two-sided t-test). Right: the returning points in error trials gradually decreased across trials (P = 1.9 × 10⁻⁵, two-sided t-test, the regression coefficients of the returning points with trial number in day 1 for each animal). The center of box plot shows the median, the edges are the 25th and 75th percentiles and the whiskers are the most extreme data points. e, Different groups of mice experienced a session with a moving or motionless static monster on day 1 and were tested avoidance of static monster on day 2. The experiences of a moving monster on day 1 increased failure to acquire reward in the presence of a static monster on the next day (moving → static versus static → static, P = 2.1 × 10⁻³; moving → static versus moving → no, P = 4.5 × 10⁻³, two-sided t-test, n = 6 animals for each). The center of box plot shows the median, the edges are the 25th and 75th percentiles and the whiskers are the most extreme data points. f, Regression coefficients of avoidance rate (P = 2.3 × 10⁻⁷, t-test (left)) and the rate of reactive avoidance (P = 4.9 × 10⁻⁸, two-sided t-test (right)) with trial number in monster sessions (days 1–3) for each animal. The center of box plot shows the median, the edges are the 25th and 75th percentiles and the whiskers are the most extreme data points. g, Left and center: the escape duration was shorter in the monster sessions than in control sessions (P = 3.6 × 10⁻⁷, paired two-sided t-test). The error bars represent the s.e.m. Right: the regression coefficients of escape duration with trial number in monster sessions (P = 0.87, two-sided t-test). The center of the box plot shows the median, the edges are the 25th and 75th percentiles and the whiskers are the most extreme data points. The monster icons indicate monster sessions and the circle icons indicate no monster sessions. n = 24 animals for all except for e. n.s., not significant. *P < 0.05.
Source data
The mice showed dynamic and diverse avoidance behaviors. In sessions with a moving monster, the mice failed to collect reward (that is, avoided a monster) in a large fraction of trials (‘avoidance’ rate) (Fig. 1b,c and Extended Data Fig. 1b). The very first time a moving monster was presented, all the mice entered the monster territory, triggering the movement of the monster. However, most mice then failed to reach the reward location (‘reactive avoidance’) (Fig. 1c, right, Extended Data Fig. 1c and Supplementary Video 1). In subsequent trials on the first day (‘day 1’), mice increasingly avoided entering the monster territory even before the monster started to move (‘predictive avoidance’) (Fig. 1c,d, middle and left, respectively, and Supplementary Video 2). Similarly, the latency to enter the arena or the monster territory gradually became longer, indicative of greater hesitation (Extended Data Fig. 1d). The points where mice turned back in the arena became progressively closer to the shelter in avoidance trials on day 1 (Fig. 1b,d, right). These observations suggest that in later trials of the first session, avoidance was driven more by threat prediction at earlier time points rather than being directly triggered by the moving monster. To further investigate threat prediction, we next used a motionless ‘static’ monster. We found that the static monster alone was not sufficient to induce strong avoidance behavior (Extended Data Fig. 1f). However, after mice were exposed to a moving monster on day 1, the presence of a static monster led to avoidance in most trials during later sessions (Fig. 1e). These results indicate that mice learned to predict a potential threat from the sight of the monster, after experiencing the monster’s movement.
On a longer time scale, overall avoidance gradually decreased, leading to improved reward acquisition across multiple sessions (Fig. 1c,f, left). The decrease in avoidance was primarily due to a gradual reduction in reactive avoidance (Fig. 1c,f, right, and Extended Data Fig. 1e). However, other aspects of behavior suggest that the threat was not completely extinguished. We observed that mice returned to the shelter after crossing the trigger line (thus triggering a monster movement) more quickly in monster sessions compared to sessions with no monster (‘escape duration’) (Fig. 1g and Extended Data Fig. 1g). Notably, the escape duration remained short, even after the success rate improved. These results suggest that mice overcame the monster threat sufficiently to capture the reward rather than completely extinguishing their threat prediction. In summary, we observed a gradual development of threat-coping behaviors in our paradigm, transitioning through different components: threat avoidance, threat prediction and threat overcoming.
Physical salience coding and threat avoidance with dopamine in TS
Previous studies have found that a prominent characteristic of dopamine activity in TS is its monotonical modulation by intensity of external stimuli of various sensory modalities11,12. However, other studies have suggested that dopamine in both TS and the dorsolateral striatum (DLS) signals salience11,18,19, and these two regions are often grouped together20. To precisely locate TS, we systematically mapped dopamine activity patterns in various striatal subareas using a genetically encoded dopamine sensor, GRABDA2m21, while head-fixed mice received different intensities of tone (50, 75 and 100 dB) and varying amounts of water (1, 3 and 10 μl) (Fig. 2). Overall, we observed widespread excitation to water, while responses to tones varied in their sign across areas (Fig. 2b). Dopamine activity was negatively modulated by tone intensity in the anterior striatum but was positively modulated in the posterior striatum (Fig. 2b–d). Water amount coding and intensity coding showed a negative correlation with each other (Fig. 2e), and the positive intensity coding was specifically localized in TS, the most posterior part of the striatum (Fig. 2f–h).

a, Left: AAV9-Syn-GRABDA2m was injected, and an optic fiber was implanted in various areas of the striatum (66 animals, one recording site per animal). Right: three different intensities of pure tone (50, 75 and 100 dB) and three different sizes of water (1, 3 and 10 μl), pseudorandomly presented to the head-fixed mice during the fiber fluorometry recording. WT, wild type. b, Top: dopamine responses (0–1 s) to water and tone in example animals (anterior, ex1 (left); posterior, ex2 (right)). Bottom: dopamine responses to water (10 μl (left)) and to tone (100 dB (right)) across different locations of the striatum. The example animals are indicated by the arrowheads. c, The regression coefficients of dopamine responses with water sizes (R = −0.38, P = 1.6 × 10⁻³, Pearson’s correlation coefficient (left)) and tone intensities (R = 0.74, P = 4.6 × 10⁻¹³, Pearson’s correlation coefficient (right)) were plotted along the anterior–posterior axis in the striatum. d, The dopamine response types (Methods) with anatomical location in the striatum. e, The regression coefficients of dopamine responses with water sizes and tone intensities were anticorrelated (R = −0.53, P = 2.8 × 10⁻⁶, Pearson’s correlation coefficient). f, The dopamine response types were mapped onto an anatomical map of the striatum62. g, Dopamine responses to tone (top) and water (bottom) in the ventral striatum (VS), the dorsomedial striatum (DMS), the DLS, posterior DLS/aTS (anterior to Bregma −1.5 mm) and TS (mean ± s.e.m.). h, The average dopamine responses to water (left) and tone (right) in VS, DMS, DLS, aTS and TS (n = 66 animals). The error bars represent the s.e.m.
Source data
We next examined dopamine activity patterns in TS in the monster paradigm (Fig. 3 and Extended Data Fig. 2). In monster sessions, TS dopamine strongly responded to the monster charge (Fig. 3a and Extended Data Fig. 2c), but it did not respond to water reward in no monster sessions (Extended Data Fig. 2b,c). This contrasts with the adjacent DLS, where water reward strongly increased dopamine release (Extended Data Fig. 2c). Using a regression analysis that decomposes dopamine activity (Methods), we found that TS dopamine responses were mainly explained by the monster charge, while dopamine responses in the adjacent DLS were mainly explained by water delivery (Fig. 3b and Extended Data Fig. 2d).

a, The dopamine sensor signals in TS (n = 19 animals) during the monster task (average of ten monster sessions, mean ± s.e.m.). b, The average responses of kernel regression models (mean ± s.e.m.) in TS and DLS (Methods). The dopamine responses to monster in TS were significantly positive (P = 1.8 × 10⁻⁴, 0.4–2 s after movement onset, Wilcoxon signed rank test), stronger than water responses (P = 2.0 × 10⁻³, two-sided Wilcoxon signed rank test) and stronger than in DLS (P = 0.016, two-sided Wilcoxon rank sum test). The water responses in DLS were significantly stronger than in TS (P = 5.5 × 10⁻³, two-sided Wilcoxon rank sum test). The center of box plot shows median, the edges are the 25th and 75th percentiles and the whiskers are the most extreme data points. c, The dopamine response patterns (mean ± s.e.m.) on day 1. The average dopamine responses to a big monster (0–1 s) were significantly higher than responses to a small monster (P = 0.042, two-sided t-test, n = 3 animals for each). The center of box plot shows the median, the edges are the 25th and 75th percentiles and the whiskers are the most extreme data points. d, The monster’s size modulated the avoidance rate on day 1 (P = 0.042, F(2,17) = 3.95, one-way ANOVA, n = 6 animals for each; P = 5.6 × 10⁻³, small versus big, two-sided t-test, n = 6 animals for each). The error bars represent the s.e.m. e, The average TS dopamine responses to the monster were positively correlated with individual variability of avoidance rate (average of ten monster sessions, R = 0.69, P = 1.1 × 10⁻³, Pearson’s correlation coefficient). DA, dopamine. f, The dopamine responses 0.1–1.1 s after monster movement in reward acquisition trials and avoidance trials (average of ten monster sessions, mean ± s.e.m.). Right: the dopamine responses at monster movement were significantly higher in avoidance than in reward acquisition trials (P = 8.7 × 10⁻³, F(1,18) = 6.9 for successful reward acquisition, P = 7.4 × 10⁻⁴, F(1,18) = 15.8 for trial number, P = 7.6 × 10⁻³, F(1,18) = 7.2 for successful reward acquisition × trial number interaction, three-way ANOVA; P = 5.3 × 10⁻⁴, two-sided paired t-test). g, The changes of neural responses 0.1–1.1 s after monster movement across sessions (P = 1.1 × 10⁻⁵, n = 19 animals, beta coefficient for linear regression of responses with session number, two-sided t-test). TS-DA and DLS-DA denote dopamine sensor signals in TS and DLS, respectively. The monster icons indicate when the monster starts to move. The water drop icons indicate when the animals obtain water reward. *P < 0.05.
Source data
Because TS dopamine signals the magnitude of various external stimuli in the environment in head-fixed mice12 (Fig. 2), we next examined whether TS dopamine activity similarly varied with the size of the monster. We found that TS dopamine was strongly activated by the moving big monster but not by the small monster (Fig. 3c). Consistent with these dopamine activity patterns, mice avoided the big monster significantly more than the small monster (Fig. 3d). This avoidance difference was not due to a lack of awareness of the small monster; regardless of its size, the mice showed similarly shorter escape durations in monster sessions compared with control sessions (Extended Data Fig. 2e). Thus, mice adjusted their threat-coping strategy on the basis of the size of the monster, which corresponded to modulations in dopamine activity.
Because TS dopamine responds to monster movement, we next examined the correlation between natural variability in TS dopamine responses and avoidance behavior (Fig. 3e–g and Extended Data Fig. 2f,g). There was a wide range of individual variability in avoidance behaviors (Fig. 1b and Extended Data Fig. 1b). We found that average TS dopamine responses to monster movement were positively correlated with individual variability in the avoidance rate (Fig. 3e,f). Further, dopamine responses to monster movement in avoidance trials were significantly greater than those in nonavoidance (that is, reward acquisition) trials (Fig. 3f), indicating a link between dopamine activity and avoidance behaviors on a trial-by-trial basis. As the mice habituated to the monster over trials and sessions, dopamine activity evoked by monster movement gradually decreased (Fig. 3g). The reduction in dopamine responses can be explained by the previous finding that TS dopamine strongly responds to novel stimuli and represents prediction error related to threat, based on physical salience11,12,22. In this task, the reduction of dopamine activity over repeated presentations may reflect both reduced prediction errors through learning (increased predictability of monster movement) and a gradually decreasing threat level (learning that monster movement does not lead to harm)22.
In summary, consistent with the stimulus intensity coding by dopamine in TS, dopamine responses in TS were modulated by the size of the monster. Dopamine responses to the monster were correlated with individual variability in the avoidance rates and the animal’s avoidance behavior both on a trial-to-trial basis and over a longer time scale of habituation.
Dopamine in TS facilitates avoidance, sacrificing reward acquisition
To test whether dopamine in TS affects reward-guided behaviors under threat–reward conflicts, we ablated dopamine neurons using targeted injections of 6-hydroxydopamine (6-OHDA) (Fig. 4a–f and Extended Data Fig. 3a–f). In contrast to conventional reinforcement learning models with dopamine23,24, ablation of TS-projecting dopamine neurons did not affect reward acquisition in control sessions (Fig. 4d and Extended Data Fig. 3b). Further, ablation increased reward acquisition (that is, decreased avoidance) in monster sessions (Fig. 4b–d). This suppression of avoidance behavior was strongly correlated with the ablation locations along the anterior–posterior axis of the striatum (Fig. 4b), indicating a specific role of TS dopamine in promoting threat avoidance. On the other hand, the escape duration did not change following ablation (Fig. 4f and Extended Data Fig. 3c), suggesting that the ablated mice still recognized the moving monster. In addition, ablation did not lead to a gradual increase in predictive avoidance (Fig. 4e and Extended Data Fig. 3d). Because a previous study suggested corelease of glutamate and dopamine in TS25,26, it is possible that effects of ablation was caused by dopamine and/or glutamate release from dopamine neurons. However, genetic removal of vesicular glutamate transporter 2 (vGluT2) expression in dopamine neurons did not affect the avoidance rate during the monster task (Fig. 4g and Extended Data Fig. 4). These results indicate that TS dopamine facilitates both threat avoidance and threat prediction.

a, Ablation of dopamine neurons (DA ablation) with 6-OHDA. The white represents tyrosine hydroxylase (TH). Scale bars, 1 mm. b, The avoidance rate was lower in mice with DA ablation in the more posterior striatum (R = 0.83, P = 3.1 × 10⁻⁵, Pearson’s correlation coefficients, n = 18 animals). c, The returning points that each animal reached in each trial. d, Left: the avoidance rate in control and DA ablation mice in days 1–3. The average avoidance rates in DA ablation mice were significantly lower than control mice (P = 0.022, control versus ablation mice, two-sided t-test; P = 0.016, control mice; P = 0.45, ablation mice, control versus monster sessions, paired two-sided t-test, n = 6 animals each). Right: time course of avoidance rate in control and TS-DA ablation mice. TS-DA ablation mice succeeded in reward acquisition from the first trial of day 1 (first trial in day 1 versus first trial in control, χ2 = 6, P = 0.014, chi-squared test). The error bars represent the s.e.m. (binomial). e, Left: the average predictive avoidance in days 1–3 in DA ablation mice was significantly lower than control mice (P = 0.028, control versus ablation mice, two-sided t-test; P = 0.048, control mice; P = 0.088, ablation mice, control versus monster sessions, two-sided paired t-test, n = 6 animals each). Right: time course of predictive avoidance in control and TS-DA ablation mice. The error bars represent the s.e.m. (binomial). f, The escape duration was significantly shorter in monster sessions 1–3 than in control sessions with both control mice (black, P = 2.7 × 10⁻³, two-sided paired t-test, n = 6) and ablation mice (blue, P = 5.8 × 10⁻³, paired two-sided t-test, n = 6). The error bars represent the s.e.m. g, The mice with vGluT2 knockout (KO) in dopamine neurons avoided a monster (P = 3.2 × 10⁻⁵, control; P = 9.3 × 10⁻⁵, KO, control versus monster sessions, paired t-test; P = 0.96, control versus KO, two-sided t-test, n = 6 animals for each). The error bars represent the s.e.m. h, The validation of a DAT inhibitor, GBR12909. Left: AAV9-Syn-GRABDA2m was injected into TS. Dopamine sensor signals were recorded while head-fixed mice were presented with a complex tone. Middle: dopamine responses to tone before (top, ‘pre’) and after (bottom, ‘post’) injection of DAT inhibitor or vehicle (mean ± s.e.m.). The dopamine responses were normalized by the responses to 75 dB of tone in the preinjection session. Right: average dopamine responses to tone (0–1 s). The dopamine sensor signals were significantly higher when the DAT inhibitor was infused in the TS than vehicle (P = 0.011, n = 6 sessions with three animals, two-sided paired t-test). The error bars represent the s.e.m. i, The DAT inhibitor or vehicle was bilaterally injected into TS, and the mice were tested in the monster paradigm with a small monster for one session. The avoidance rate was significantly higher with the DAT inhibitor in TS than with the vehicle (P = 0.014, vehicle versus DAT inhibitor, two-sided t-test; P = 0.79, control mice; P = 0.19, DAT inhibitor mice, control versus monster sessions, two-sided paired t-test, n = 6 animals each). The monster icons indicate monster sessions and the circle icons indicate no monster sessions. The error bars represent the s.e.m. *P < 0.05.
Source data
We then performed the converse manipulation using the dopamine transporter (DAT) inhibitor, which leads to an increase of dopamine concentration within a physiologically relevant range (Fig. 4h,i). Mice received bilateral infusions of either the DAT inhibitor or vehicle in TS and were then tested in the monster paradigm with a small monster. While most mice infused with the vehicle successfully acquired rewards with the small monster, those infused with the DAT inhibitor exhibited significantly increased avoidance (Fig. 4i and Extended Data Fig. 3g). These results demonstrate a causal role of dopamine signaling in avoidance behavior, which is influenced by the size of the threatening stimulus. Beyond the behaviors observed during initial threat learning, we next examined whether dopamine in TS affects the gradual improvement of reward acquisition (Extended Data Fig. 3h). The mice were presented with a moving big monster in one session and then were bilaterally infused with DAT inhibitor in TS in later sessions. The slight increase in dopamine levels in TS induced by the DAT inhibitor delayed animal’s ability to overcome the threat posed by the monster.
These results indicate that dopamine in TS facilitates the avoidance and prediction of potential threats, which may come at the expense of reward acquisition. In the later stage of threat coping, dopamine in TS suppresses overcoming the threat.
Opposite relationship of D1 and D2 neuron activity with behavior
Functions of dopamine depend on the activity of dopamine-recipient cells. Therefore, we next examined the activity patterns of neurons in TS. While biochemical and anatomical properties point to opposing roles for D1 and D2 neurons in the striatum27,28, concurrent activity observed in some studies has challenged this view29,30. We recorded the population activity of D1 and D2 neurons in the monster paradigm using fiber fluorometry with the Ca2+ indicator GCaMP7f31 (Fig. 5 and Extended Data Fig. 5).

a, Left: AAV9-Syn-flex-GCaMP7f was injected unilaterally into TS of tachykinin precursor 1 (Tac1)-cre mice for D1 neurons or adenosine 2A receptor (Adora2A)-cre mice for D2 neurons. The representative image of GCaMP expression in D1 neurons. The arrowhead represents the tip of a fiber. GCaMP7f is shown in green. Scale bar, 1 mm. Right: D1 and D2 neuron activity patterns (average of ten monster sessions). Top: the mean ± s.e.m. b, The avoidance rate versus average D1 and D2 neuron responses before (left) and after (right) monster movement in each animal (average of ten monster sessions, R = 0.43, P = 0.16, 0–1 s before monster; R = 0.74, P = 6.4 × 10⁻³, 0.1–1.1 s after monster, n = 12 animals, D1; R = −0.62, P = 0.040, before monster; R = −0.33, P = 0.32, after monster, n = 11 animals, D2, Pearson’s correlation coefficient). c, D1 and D2 neuron activity in reward acquisition trials and avoidance trials (average of ten monster sessions). Left: the mean ± s.e.m. Right: a comparison of neuron responses in reward acquisition versus avoidance trials (P = 4.5 × 10⁻⁷, F(1,11) = 26.4 for successful reward acquisition, P = 1.0 × 10⁻⁴, F(1,11) = 15.3 for trial number, P = 5.1 × 10⁻⁴, F(1,11) = 12.2 for successful reward acquisition × trial number interaction, three-way ANOVA, P = 0.37, before monster; P = 0.031, after monster, n = 12 animals, D1; P = 0.76, F(1,10) = 0.09 for successful reward acquisition, P = 6.8 × 10⁻⁴, F(1,10) = 11.6 for trial number, P = 0.94, F(1,10) = 0 for successful reward acquisition × trial number interaction, three-way ANOVA, P = 0.014, before monster; P = 0.081, after monster, D2, two-sided paired t-test, n = 11 animals). d, The changes of neural responses before and after monster across sessions (P = 0.42, before monster; P = 0.15, after monster, D1, n = 6 animals; P = 0.012, before monster; P = 0.030, after monster, D2, n = 11 animals, beta coefficient for linear regression of responses with session number, two-sided t-test). The monster icons indicate when the monster starts to move. *P < 0.05.
Source data
Upon introduction of the monster, both D1 and D2 neurons in TS were strongly activated (Fig. 5a and Extended Data Fig. 5c). Notably, however, the temporal dynamics of the activity differed: D1 neurons showed transient activation at door opening and after the initiation of monster movement, whereas D2 neuron activity gradually ramped up from door opening through arena entry, sustaining until water acquisition, after which the activity abruptly decreased (Fig. 5a). Underscoring this difference, we observed an inverse relationship between behavioral outcomes and neural activity between D1 and D2 neurons. Across mice, the average response of D1 neurons after monster movement was positively correlated with the avoidance rate, whereas the average response of D2 neurons before monster movement was negatively correlated with the avoidance rate (Fig. 5b and Extended Data Fig. 5d,e). Further, on a trial-by-trial basis, D1 neuron responses following monster movement were stronger in trials in which animals avoided the monster compared with trials in which animals acquired reward, whereas D2 neuron responses before and after monster movement were stronger in trials with successful reward acquisition (Fig. 5c and Methods). Thus, despite largely concurrent activity patterns, the tendency to avoid was associated with higher activity in D1 neurons and lower activity in D2 neurons on both a trial-to-trial and interindividual level.
During the behavioral transition from avoidance to overcoming the monster threat, D2 neuron activity both before and after monster movement gradually increased, whereas D1 neuron activity exhibited a tendency to decrease, although this trend did not reach statistical significance (Fig. 5d).
D1 and D2 neurons in TS promote avoidance of and overcoming a potential threat
Having observed modulation of D1 and D2 neuron activity in TS during avoidance behaviors, we next tested causality through cell-type-specific ablations using diphtheria toxin subunit A (dtA) (Fig. 6 and Extended Data Fig. 6). Similar to the ablation of TS-projecting dopamine neurons, specifically ablating D1 neurons in TS did not alter reward acquisition in control sessions but increased reward acquisition in monster sessions by decreasing the overall avoidance rate (Fig. 6b–d, top). This decrease in avoidance was significantly correlated with ablation locations along the anterior–posterior axis of the striatum (Fig. 6c), indicating a specific role of TS D1 neurons in avoidance behaviors. Breaking down avoidance, ablated animals showed decreases in both reactive and predictive avoidance (Extended Data Fig. 6b–g), indicating that D1 neurons promote both reactive avoidance and threat-predictive behaviors.

a, AAV-CAG-flex-dtA was bilaterally injected into TS in Tac1-cre/Ai14 (top) or Adora2A-cre/Ai14 (bottom) mice to ablate D1 or D2 neurons, respectively. tdTomato is shown in white. Scale bars, 1 mm. b, The returning points that each animal reached in each trial. c, The avoidance rate was lower in mice with D1 ablation in the more posterior striatum (R = 0.69, P = 2.0 × 10⁻³, Pearson’s correlation coefficients, n = 17 animals). d, The avoidance rate in D1 or D2 neuron ablation mice (mean ± s.e.m.). The avoidance rates in the monster sessions were significantly lower in D1 ablation mice and higher in D2 ablation mice than control mice across sessions (second left, group × phase interaction, P = 2.2 × 10⁻⁴, F(2,20) = 10.19, D1; P = 0.011, F(2,44) = 5.65, D2, two-way repeated measures ANOVA; P = 5.1 × 10⁻⁵, day 1, P = 9.9 × 10⁻³, day 2, P = 0.043, day 3, D1; P = 0.62, day 1, P = 0.021, day 2, P = 6.4 × 10⁻³, day 3, D2, two-sided t-test) and on average (second right, P = 6.1 × 10⁻⁴, n = 6 animals each, D1; P = 0.048, n = 12 animals each, D2, control versus ablation mice, two-sided t-test; P = 1.4 × 10⁻⁴, D1 control mice (top black); P = 0.056, D1 ablation mice (top orange); P = 5.9 × 10⁻⁴, D2 control mice (bottom black); P = 3.3 × 10⁻⁶, D2 ablation mice (bottom green), control versus monster sessions, two-sided paired t-test). The avoidance rate gradually decreased in the control but not in D1 or D2 ablation mice (P = 0.013, D1 control; P = 0.72, D1 ablation, n = 6 animals each; P = 6.4 × 10⁻⁴, D2 control; P = 0.61, D2 ablation, n = 12 animals each, two-sided t-test; P = 0.038, D1 control versus ablation; P = 4.4 × 10⁻⁴, D2 control versus ablation, two-sided paired t-test). The monster icons indicate monster sessions and the circle icons indicate no monster sessions. *P < 0.05.
Source data
In contrast, after ablation of D2 neurons in TS, the mice initially exhibited avoidance at a level similar to control mice (Fig. 6b, bottom, day 1). This indicates that D2 neurons were not essential for threat avoidance in this task. Further, mice with D2 neuron ablation were able to learn threat prediction over trials (Extended Data Fig. 6b–d). Both reactive and predictive avoidance behaviors were slightly increased after ablation (Extended Data Fig. 6b–g). However, in stark contrast to control mice, those with D2 neuron ablation did not improve reward acquisition over subsequent days (Fig. 6b,d, bottom), indicating that the ablation impaired their ability to overcome the potential threat.
The effects of ablating D1 and D2 neurons differ in two fundamental ways. First, the directions of behavioral changes were opposite; suppression of avoidance by D1 neuron ablation and promotion of avoidance by D2 neuron ablation. Second, these effects manifested at different stages of threat-coping behaviors: initial threat avoidance and prediction versus overcoming the threat at a later stage. Strikingly, neither group of ablation mice showed dynamic modulation of avoidance behaviors across days of experiences (Fig. 6d). These results underscore the importance of both D1 and D2 neurons in TS for the progressive development of threat-coping behaviors.
TS dopamine alters the balance between D1 and D2 neurons toward avoidance
The above results indicate that both dopamine and D1 neurons in TS promote threat avoidance, whereas D2 neurons promote overcoming the threat. To examine the roles of the action of dopamine on D1 and D2 neurons in threat avoidance, we performed a ‘rescue’ experiment. We first ablated TS-projecting dopamine neurons and then tested the effect of activating D1 receptors (D1R) or D2 receptors (D2R) using their agonists (Fig. 7a–c and Extended Data Fig. 7). Consistent with dopamine’s facilitatory action on D1 neurons32,33, injecting a D1R agonist into TS before the sessions rescued both avoidance and threat prediction in a dose-dependent manner (Fig. 7b and Extended Data Fig. 7b). Similarly, D2R agonist alone also rescued avoidance and threat prediction (Fig. 7c and Extended Data Fig. 7c). Given that D2R has higher receptor-binding affinity with dopamine compared with D1R, these results suggest that D2R occupancy is critical for avoidance in normal mice. To validate this, we injected a D2R antagonist into TS in normal mice during the first monster session. We found that blocking the D2R pathway suppressed avoidance in normal mice (Extended Data Fig. 7d), indicating that high occupancy of D2R by dopamine promotes avoidance. Considering that dopamine binding to D2R may prevent strengthening of synapses onto D2 neurons32,34,35, our results suggest that both suppression of the D2 neuron pathway and activation of the D1 neuron pathway by dopamine promote avoidance.
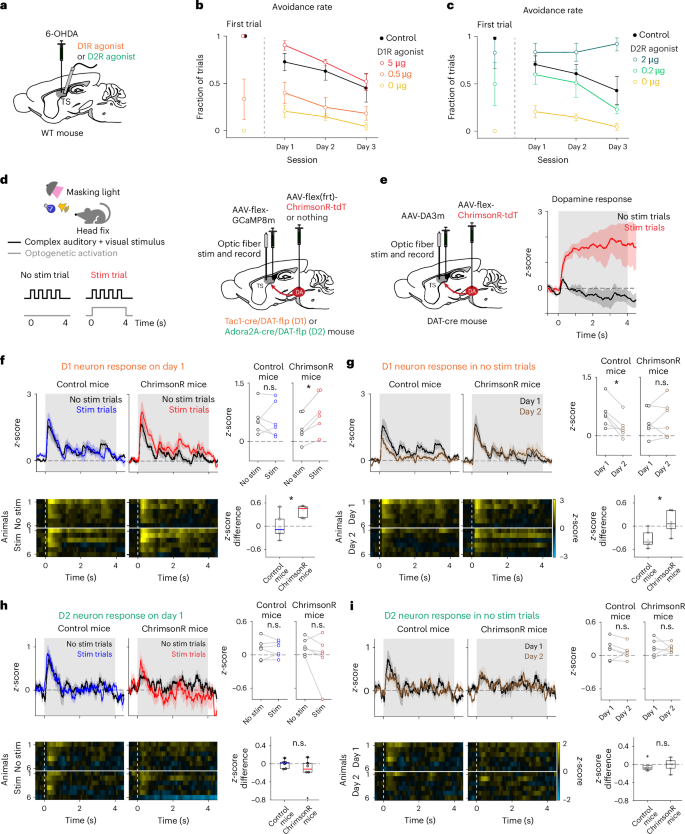
a, TS dopamine ablation mice were injected with D1R agonist (SKF-38393) or D2R agonist (quinpirole) before each session for day 1–3 monster sessions. The control mice received vehicle injection during surgery and test days. b, The avoidance was increased by D1R agonist injection in a dose-dependent manner on day 1 (P = 1.2 × 10⁻⁴, F(2,17) = 21.31, one-way ANOVA; P = 0.041, 0 µg versus 0.5 µg, P = 3.7 × 10⁻⁶, 0 µg versus 5 µg, two-sided t-test) and on the first trial (P = 1.0 × 10⁻³, 0 µg versus 5 µg, χ2 = 12, chi-squared test) and then gradually decreased (P = 1.3 × 10⁻³, 5 µg, P = 0.24, 0.5 µg, P = 0.80, 0 µg, regression coefficient of the avoidance rate with trials, two-sided t-test), similar to control mice (P = 6.1 × 10⁻³, regression coefficient of the avoidance rate with trials, control, two-sided t-test). n = 6 animals for each. The error bars represent the s.e.m. c, Avoidance was recovered by the D2R agonist in a dose-dependent manner on day 1 (P = 1.2 × 10⁻⁴, F(2,17) = 13.60, one-way ANOVA; P = 7.0 × 10⁻³, 0 µg versus 0.2 µg; P = 2.2 × 10⁻⁵, 0 µg versus 2 µg, two-sided t-test) and on the first trial (P = 1.0 × 10⁻³, 0 µg versus 2 µg, χ2 = 12, chi-squared test) and gradually decreased or increased across days depending on the agonist doses (P = 5.1 × 10⁻³, F(2,30) = 6.50, session × dose interaction, two-way repeated measures ANOVA; P = 0.11, 2 µg, P = 0.022, 0.2 µg, P = 0.80, 0 µg, regression coefficient of the avoidance rate with trials, two-sided t-test). n = 6 animals for each; mean ± s.e.m. d, A schematic for simultaneous optogenetic activation of dopamine axons and fluorometry recording of GCaMP signals from either D1 or D2 neurons in the TS. Head-fixed mice were presented with a complex visual and auditory stimulus in trials with (‘stim’) or without (‘no stim’) concurrent optogenetic stimulation. e, Dopamine sensor (GRABDA3m) signals at a sensory stimulus in the same task as d. The time of optogenetic stimulation (0–4 s) is shown in gray. n = 6 animals; mean ± s.e.m. f, Left: D1 neuron response patterns in trials with or without optogenetic stimulation on the first day of the sensory experience in all animals (mean ± s.e.m. (top), each animal (bottom)). Right: the average D1 neuron responses (0–4 s) in stimulated trials were significantly higher than in nonstimulated trials in ChrimsonR-expressing mice (P = 1.1 × 10⁻³, t = 6.65, paired two-sided t-test, ChrimsonR mice; P = 0.85, t = 0.19, two-sided paired t-test, control mice; P = 0.016, t = 2.88, two-sided t-test, control versus ChrimsonR mice, n = 6 animals each). g, Left: D1 neuron response patterns in nonstimulated trials on the first and second day of the sensory experience in all animals (mean ± s.e.m. (top), each animal (bottom)). Right: average D1 neuron responses (0–4 s) significantly decreased on the second day compared with responses on the first day in control mice but not in ChrimsonR mice (P = 0.012, t = −3.85, two-sided paired t-test, control mice; P = 0.46, t = −0.79, two-sided paired t-test, ChrimsonR mice; P = 0.014, t = 2.96, two-sided t-test, control versus ChrimsonR mice, n = 6 animals each). h, Left: same format as f but for D2 neurons. D2 neuron responses (0–4 s) did not significantly change by optogenetic stimulation (control mice, P = 0.93, t = −0.09; ChrimsonR mice, P = 0.24, t = −1.32, two-sided paired t-test; P = 0.24, t = −1.23, two-sided t-test, difference in control versus ChrimsonR mice, n = 6 animals each). i, Left: same format as g but for D2 neurons. D2 neuron responses (0–4 s) in nonstimulated trials were not significantly different between the first and second days (control mice, P = 0.42, t = −0.86; ChrimsonR mice, P = 0.87, t = −0.16, two-sided paired t-test; P = 0.67, t = 0.42, two-sided t-test, difference in control versus ChrimsonR mice, n = 6 animals each). In the box plots, the middle lines are the median, the edges are the 25th and 75th percentiles, the whiskers are the most extreme data points not considered as outliers and the crosses are outliers. *P < 0.05.
Source data
Over a longer time scale, when we injected fixed doses of D1R or D2R agonists in each session to mice with ablated dopamine neurons, avoidance gradually decreased across sessions in most conditions (Fig. 7b,c and Extended Data Fig. 7b,c). Notably, a higher dose of D2R agonist prevented animals from gradually reducing avoidance (Fig. 7c). Consistently, after normal animals experienced a monster session without manipulation, the application of a D2R agonist in subsequent sessions hindered the improvement of reward acquisition (Extended Data Fig. 7e). These results suggest that achieving low occupancy of D2R is crucial for overcoming threats, that is, learning to suppress avoidance behaviors. These findings indicate the structural similarity to the ventral striatum where reducing dopamine action on D2 neurons is essential for learning to suppress a reward-oriented behavior via synaptic plasticity32,35.
The results from the rescue experiments underscore that the balance between D1 and D2 neurons controls avoidance behavior. Dopamine probably modulates this balance by acutely altering the excitability of these neurons or by causing long-lasting changes in synaptic efficacy (plasticity). Previous studies highlighted TS dopamine’s role in facilitating learning of object avoidance and fear conditioning12,36,37, as well as its acute promotion of stimulus-guided actions38. Consistent with these findings, our results show that dopamine manipulations not only affected threat prediction learning (Fig. 4e) but also affected avoidance behavior from the very first trial (Figs. 4d and 7b,c), suggesting rapid effects of dopamine within a single trial. To directly demonstrate how dopamine influences neuronal responses in TS, we next examined the effects of optogenetically activating dopamine axons. The parameters of optogenetic activation were carefully calibrated not to exceed physiological levels32,39,40 observed in dopamine sensor (GRABDA3m)41 signals (Fig. 7d–i and Extended Data Fig. 8). Because TS-projecting dopamine neurons and TS neurons are highly sensitive to light12 (Extended Data Fig. 8a,b), we conducted this experiment under strong masking light with head-fixed mice (Methods and Extended Data Fig. 8a,b). We found that optogenetic activation of dopamine axons in TS on day 1 increased the response of D1 neurons but not of D2 neurons to a complex multimodal stimulus (Fig. 7f,h and Extended Data Fig. 9a,b). Further, while D1 neuron responses to the same stimulus decreased on day 2, optogenetic activation of dopamine axons on day 1 prevented this decrease, indicating that D1 neuron responses were potentiated on day 1 (Fig. 7g, day 2). On day 2, concurrent optogenetic stimulation did not augment sensory responses in either D1 or D2 neurons (Extended Data Fig. 9c,d), suggesting that the potentiation on day 1 masked any acute effects on day 2. In contrast to its effects on sensory responses, optogenetic activation of dopamine axons alone, without concurrent salient sensory stimuli, did not elicit excitation in D1 neurons in TS (Extended Data Fig. 9e). These results collectively demonstrate that dopamine release in TS exerts both acute and long-term effects; it acutely enhances D1 neuron responses to sensory stimuli and maintains an elevated sensory response across days, indicative of a learning effect.
Taken together, these results suggest that TS dopamine biases threat-coping behaviors by altering the balance between the D1 and D2 neuron pathways both within single trials initially and across multiple days.
Discussion
Although simple threat-triggered responses, such as freezing and escape, have long been studied intensively in neuroscience, how animals respond to, learn from and, eventually, overcome a potential threat (threat coping) is understudied. Threat coping requires estimation of potential threats without actually experiencing ultimate outcomes and flexible action selection according to the threat estimates together with other factors, such as rewarding opportunities.
In this study, we find that D1 and D2 neurons and dopamine in TS play critical roles at different stages of threat coping under threat–reward conflict. Dopamine and D1 neurons facilitate threat avoidance and prediction, while D2 neurons promote animals to overcome the threat. Thus, our results demonstrate that D1 and D2 neuron pathways in TS have opposing functions in regulating threat coping, allowing animals to adaptively overcome a threat via D2 neuron pathway while potentially maintaining the threat estimate via the D1 neuron pathway. We also found that dopamine axon activation in TS acutely boosts sensory responses of D1 neurons and potentiates D1 neuron responses—an effect that persisted over a day. Taken together, our results reveal that the TS D1 and D2 neuron pathways oppose each other to regulate dynamical evolvement of threat-coping behaviors and that dopamine biases these pathways both acutely and for a longer term.
Balancing avoidance of and overcoming a potential threat with D1 and D2 neurons in TS
How the activity of the D1 and D2 neurons regulate behavior remains hotly debated. Different modes of interaction between D1 and D2 neurons are often modeled as ‘scaling’ or ‘focusing’8,9 (Fig. 8a). In the scaling model, the strength of output (for example, reward value) is ‘scaled’ by relative activity of D1 and D2 neurons that compete with each other (Fig. 8a). In the ‘focusing’ model, D1 neurons promote a specific information flow while D2 neurons inhibit other information, analogous to the center-surround inhibition found in sensory processing8,9. Thus, scaling operates through competition between the two pathways, while focusing functions through cooperation. Anatomically, many D1 neurons directly project to the substantia nigra (SN) or the globus pallidus internal segment (‘direct pathway’), whereas many D2 neurons indirectly project to SN via the globus pallidus external segment (‘indirect pathway’). In the scaling model, information from D1 and D2 neurons in the same striatal area is focally integrated, for example, in the SN or globus pallidus internal segment42,43. In the focusing model, information from D2 neurons spreads more through divergent projection via the indirect pathway and/or differential output pathways from the globus pallidus external segment42,43,44, although the precise integration mechanisms remain to be determined. Importantly, these two models make opposite predictions regarding the effect of manipulating the activity of D1 or D2 neurons. Because scaling involves competition between the two pathways, inhibition of D2 neurons would enhance the function of D1 neurons. On the other hand, since focusing involves a collaborative function, inhibition of D2 neurons would counter the function of D1 neurons, for example, due to insufficient suppression of competing information or actions.

a, Classical models for striatal D1/D2 neuron pathways8,9. b, D1 neurons promote avoidance and D2 neurons promote overcoming the threat, which resembles the ‘scaling’ model. At the encounter of a potential threat, D1 neuron activity and dopamine (DA) promote avoidance, while high occupancy of D2R is also critical. Dopamine may directly enhance sensory responses of D1 neurons for immediate avoidance (left) and may prevent habituation of D1 neurons (middle). Once dopamine responses decrease, low occupancy of D2R and D2 neuron activity promote animals to overcome a potential threat, counteracting D1 pathway (right).
Here, we find that D1 and D2 neurons in TS functionally oppose each other but at different stages of threat coping. D1 neurons promote threat avoidance and prediction, while D2 neurons facilitate overcoming the threat, with dopamine levels modulating the balance between them (Fig. 8b). These results are consistent with the ‘scaling’ model, where the output strength (threat level or avoidance tendency) is determined by the relative activity of D1 and D2 neurons. Further supporting this model, while D1 and D2 neurons in the TS exhibit similar activity patterns, probably reflecting similar inputs, their activity cofluctuates with behavioral choices in opposite directions, suggesting that the difference in their activity determines behavioral outputs.
Direct and indirect parallel information flows could allow independent top-down controls, depending on the situation. Notably, a previous study found that the prefrontal cortex modulates TS signaling via the globus pallidus external segment to the thalamic reticular nucleus so that distracting stimuli can be ignored in an attention shifting task44. This pathway, which is probably mediated by D2 neurons in TS, can temporarily manipulate the sensory information to suppress attention toward irrelevant stimuli. Importantly, this suppression happened proactively, even before the distracting cue was presented44. We also observed that D2 neuron activity started ramping up even before the monster started moving, particularly in successful reward acquisition trials. It is plausible that the similar process involving the prefrontal cortex to TS D2 neurons pathway (directing attention away from the threat) plays a role in overcoming the threat during threat–reward conflicts while maintaining the memory of a potential threat in D1 neurons. Thus, top-down controls may allow flexible decision-making in parallel with plastic changes of synapses onto D1 versus D2 neurons.
The exact mechanism of dopamine’s regulation of striatal neurons remains to be clarified32,35,45. Our observations suggest that dopamine biases the balance between D1 and D2 neurons in TS by regulating the plasticity and/or excitability of these neurons32,45. Multiple studies have previously observed dopaminergic modulation of the striatal neurons32,33,34,35,46,47, although the exact effect of dopamine in behaving animals is still under debate. Notably, recent studies have warned that the effects of physiological levels of dopamine differ from those of artificially strong optogenetic manipulation32,39,40. We found that, in addition to potentiation of D1 neuron responses that lasts a day, the sensory responses of D1 neurons are boosted by concurrent optogenetic activation of dopamine axons in TS, but this effect was observed only before the responses were potentiated. The specificity of these acute effects, both in terms of cell type (D1 neurons) and timing (before potentiation), might explain some discrepancies across studies32,35,36.
Dopamine’s effects on avoidance in the first trial in the monster paradigm differ from the results in our previous study, where dopamine in TS did not change animals’ initial responses to an air puff12. This suggests that estimating a potential threat22 posed by a moving monster is an important factor even for reactive avoidance in the present paradigm, in contrast to an actual air puff that has a direct impact onto their eye. Interestingly, TS neurons and dopamine affected both predictive and reactive avoidance as well as entry and trigger latency, suggesting that TS does not regulate a specific action per se but modulates various avoidance behaviors potentially via threat prediction.
Multiagent reinforcement learning system specialized for outcome value and threat
Our findings indicate that TS’s overall function is distinct from other parts of the striatum, yet its circuit operation involving opponent interactions between D1 and D2 neurons is shared across striatal regions. Opposing function through direct and indirect pathways has been widely observed in other striatal areas48,49,50. Previous studies have found that D1 and D2 neurons operate in opposition along the value (reward prediction) axis49,51,52. For example, D1 and D2 neurons in the ventral striatum represent positive and negative events, respectively, to support different behaviors; D1 neurons are important for reward approach and D2 neurons for threat avoidance53,54. This is consistent with the observation that dopamine neurons in the lateral ventral tegmental area represent an integrated value of both appetitive and aversive events55. Consistent with these observations, classic machine learning models typically map various events or actions onto a one-dimensional value axis for action selection and learning56. However, our results indicate that outcome values and threats are represented along two separate axes in striatal dopamine. Having specialists representing each type of information could enhance behavioral flexibility, allowing for the switching of behavioral controllers between these ‘specialists’ depending on the situation, akin to the multiagent framework in recent reinforcement learning models57,58,59.
How do threat and value information affect behavioral choice? One possibility is that once TS computes a threat level, this threat information is converted and sent to the value system, so that the animal only needs to consider the integrated value for behavioral decisions. However, integration may not be the only strategy, since deciding solely on the basis of value predictions might not be flexible enough to balance reward and threat in the face of various situations. It is possible that decisions about whether or not to engage with a potential threat are made on the basis of two-dimensional information, weighing each factor depending on the situation, similar to the idea that emotion is regulated on the basis of the valence and intensity axes60,61.
Alternatively, TS may function by ‘vetoing’ other processing to prioritize avoiding a potential threat. TS is in a privileged position to receive and pass information faster than other striatal areas. TS is a part of the sensory basal ganglia, receiving visual and auditory information directly from the sensory cortices and thalamus62,63. Dopamine inputs to TS may also arrive more quickly13,56,64. Notably, modulating TS dopamine activity based on the physical salience of sensory stimuli would be simpler than computing value64. Further, the SN lateralis (SNL), the downstream target of TS65,66, projects directly to brain areas such as periaqueductal gray and superior colliculus67,68, which can acutely induce avoidance behaviors3,69,70. Thus, for quick decisions balancing reward and threat, TS may play an essential role in executing avoidance, while other striatal areas more accurately and deliberately compute overall value. In this sense, TS might function as a ‘first responder’, while other brain areas ‘calculate’ for further actions.
Classically, TS has been studied in various perceptual tasks that typically require intensive training. The exact function of TS and its dopamine inputs in these tasks remains to be clarified38,71,72,73. The relationship between findings from trained behaviors and threat avoidance12,22,36,37,74,75 is an intriguing question. At a global circuit level, TS is positioned to access information not readily available to areas involved in value predictions. Importantly, TS indirectly projects back to cortices and thalamic areas critical for sensory processing, such as the temporal cortex and sensory parts of the thalamic reticular nucleus44,63. This raises the possibility that TS may modify sensory information even before other striatal areas can access the original sensory information. Indeed, artificially synchronized activation or inhibition of TS or its dopamine inputs affects sensory discrimination38,71,72 and can even cause erroneous perception of a tone71, consistent with the idea that TS may alter the activity of downstream sensory thalamus and cortices44. Combined with our studies, this indicates that TS may regulate attention by altering the flow of sensory information44. The biased information flow through TS may exaggerate or attenuate a physically salient stimulus to induce or suppress avoidance of a potential threat.
Together, the data presented here provide insights into the design principle of the basal ganglia, pointing to a multiagent organization with a specific role of TS in avoiding and overcoming potential threats, in parallel with previously reported reward-related striatal areas. Because dopamine and D1 neurons in TS promote avoidance, even at the expense of reward acquisition, TS and reward-related striatum areas may occasionally compete, which probably contributes to inconsistent results and side effects of systemic dopamine homolog treatments for various diseases76,77,78. While threat-driven behaviors are often believed to be related to the negative value of the threat, the link between the sensory part of the striatum and threat coping, on a different dimension from value, opens new therapeutic avenues for the treatment of phobias, post-traumatic stress disorder and related disorders.
Methods
Animals
All procedures were performed in accordance with the National Institutes of Health Guide for the Care and Use of Laboratory Animals and approved by the Harvard Animal Care and Use Committee. A total of 229 wild-type mice, 12 tachykinin precursor 1 (Tac1)-cre (B6;129S-Tac1tm1.1(cre)Hze/J, Jackson Laboratory; RRID:IMSR JAX:021877)79 heterozygous mice, 24 Tac1-cre heterozygous;Ai14 (B6.Cg-Gt(ROSA)26Sortm14(CAG-tdTomato)Hze/J, Jackson Laboratory; RRID:IMSR JAX:007914) heterozygous double-transgenic mice, 11 adenosine 2A receptor (Adora2A)-cre (B6.FVB(Cg)-Tg(Adora2a-cre) KG139Gsat/Mmucd, GENSAT; MGI:4361654)80 heterozygous mice, 24 Adora2A-cre heterozygous;Ai14 heterozygous double-transgenic mice, 10 DAT-cre (B6.SJL-Slc6a3tm1.1(cre)Bkmn/J, Jackson Laboratory; RRID:IMSR JAX:006660)81 heterozygous mice, 9 vGluT2flox (Slc17a6tm1Lowl/J, Jackson Laboratory; RRID:IMSR_JAX:012898)82 homozygous mice, 10 DAT-cre heterozygous;v3GluT2flox homozygous double-transgenic mice, and 3 vGluT2-cre (B6J.129S6(FVB)-Slc17a6tm2(cre)Lowl/MwarJ, Jackson Laboratory; RRID:IMSR JAX:028863)83 heterozygous mice, 2 DAT-flp (B6N(Cg)-Slc6a3tm1.1(flpo)Fuyu/J, Jackson Laboratory; RRID: IMSR_JAX:033673) heterozygous mice, 12 Tac1-cre heterozygous;DAT-flp heterozygous double-transgenic mice, 12 Adora2a-cre heterozygous;DAT-flp heterozygous double-transgenic mice, male and female, aged 2–10 months, were used. All mice were backcrossed with C57BL/6J (Jackson Laboratory). Age- and sex-matched mixed littermates were used for control animals in each experiment. The animals were housed on a 12–12 h dark–light cycle (dark from 07:00 to 19:00) and performed a task at the same time each day. Ambient temperature was kept at 75 ± 5 °F, and humidity was kept below 50%. The animals were group housed (two to four animals per cage) during training and then single-housed after surgery. Some mice were water restricted for behavioral tests. In those cases, mice received water every day by experimenters, and the body weights were kept >85% of their weights with freely available water.
Monster task
Apparatus
The monster apparatus (Fig. 1a) was a long rectangular box (90 cm in length, 20 cm in width, 30 cm in height, white acrylic, cat. no. 8505K755, McMaster-Carr) with ceiling. It was divided into two compartments with a door (height, 28 cm; width, 8 cm, clear red acrylic, cat. no. 24163-02, INVENTABLES), a smaller (12-cm-long) compartment (‘shelter’) and a bigger (78-cm-long) compartment (‘foraging arena’). To make the shelter dimmer (30 lux) than the foraging arena (100 lux), clear red acrylic (cat. no. 24163-02, INVENTABLES) and transparent acrylic (cat. no. 8536K162, McMaster-Carr) were used for ceiling of shelter and foraging arena, respectively. Both ceilings had a narrow slit (1 cm wide) in the center, to allow a patch cord attached to a mouse to follow animal’s movement in fluorometry experiments. A speaker (GHXamp, AliExpress) was attached on the wall at the far end of the foraging arena to present tones (‘Monster’ section). A door was opened and closed with a servo motor (cat. no. 1143, Adafruit). To detect the animal’s position, infrared (IR) break-beam sensors (cat. no. 2168, Adafruit) were installed in multiple locations on the wall (−8, −1, +1, +5, +10, +20, +30 and +40 cm from the door; with a negative sign denoting the shelter side and a positive sign denoting the foraging side). A waterspout was presented at trial start through a small hole on the floor at 40 cm from the door and withdrawn at the end of the trial with a servo motor (cat. no. 169, Adafruit). Animal’s licking was detected with a touch sensor (cat. no. 1982, Adafruit) attached to the waterspout. All electronics were controlled by Teensy 3.2 (SparkFun Electronics) and Python software (https://www.python.org/).
Monster
In some sessions, an object (18 cm in height, 18 cm in width and 15 cm in depth; Jurassic World Velociraptor Blue 1/2 Mask, Rubies) (monster) was placed at the far end of the foraging arena, facing the shelter. A monster was attached to a gear rack (30 cm long, cat. no. 7854K15, McMaster-Carr), which penetrated the wall at the far end of the foraging arena through a narrow slit (1 cm wide). Monster movement was controlled with a servo motor (cat. no. CPM-MCVC-2310S-RLN, TEKNIC), connected to a gear (cat. no. 57655K54, McMaster-Carr) that is located outside of the arena. A monster territory was defined as the far side of a foraging arena (30 cm or further from the door). When a mouse entered the monster territory (sensed with IR beam break at 30 cm from the door), a monster started to move forward (10 cm for 200 ms) during which a loud complex tone (120 dB, Godzilla Sounds, SoundBible.com, https://soundbible.com/tags-godzilla.htm) was presented. After the forward movement, the monster stayed for 500 ms, moved backwards to its original position (10 cm for 200 ms) and started moving again after 500 ms. The back and forth movement with tone (about 1,400 ms per cycle) was repeated until the mouse returned to the shelter. The animal’s return to the shelter is defined as the time when the IR beam at −1 cm is broken and the IR beam at +1 cm is not broken for 2 s or when the IR bam at −8 cm is broken. The trial time is indicated after comma. ‘Door closing’ could occur multiple times because a door was closed sequentially; when a mouse enters the shelter (breaks −1 cm beam), the door starts to close (marked as ‘door closing’) and stops in the middle. If the mouse stays at the shelter (no beam break at +1 cm) for more than 2 s or reaches the deep end of the shelter (breaks −8 cm beam), the door closes completely, and an intertrial interval starts. Otherwise, the door opens again to allow the mouse to fully return to the foraging arena. We used the first ‘door closing’ as arena exit. To test the effects of monster movement on avoidance behavior, a monster was placed in the same manner, but the motor was turned off (‘static monster’) (Fig. 1e and Extended Data Fig. 1f). To test effects of size of the monster on avoidance behavior, smaller objects (‘medium monster’, 10 cm in height, 5 cm in width, 7 cm in depth, Dinosaur Toy Untamed T-Rex, Shenzhen ZCT Technology; ‘small monster’, 3 cm in height, 2 cm in width, 6 cm in depth, Mini Dinosaur Play Set, Zooawa) were used (Fig. 3).
Training
On the first day of habituation, the mice were handled by an experimenter for 10 min. Water restriction was started and continued until the last day of the behavioral testing. On the following day, the mice were placed in the shelter for 30 min with droplets of water and food on the floor to acclimate to the area. Then, 3 days of training sessions started. A mouse was gently introduced in the shelter with the door closed. A trial was initiated with the door opening. The entry to the foraging arena was detected when the mouse broke the IR beam at +1 cm from the door. During a trial, a mouse was allowed to freely explore the foraging arena. When a mouse licked a waterspout, a drop of water (10 µl) was delivered. A water reward was available only once per trial so that a mouse was not rewarded even if it continued to lick the waterspout. A trial ended when a mouse returned to a shelter and the door was closed. When a mouse did not enter the foraging arena for 180 s, the door was closed and the trial was ended. After 20 s of intertrial interval, the next trial was initiated. Between sessions, the arena was thoroughly cleaned, with the base of the arena was wiped down with 70% ethanol. A total of ten trials were run per session per day, and thus, the animals consumed during one session at most 100 μl in total. After the behavioral task, supplemental water (1.5–2.6 ml) was added to keep their body weights from 95% to 85% of ones with free water. The amount of supplemental water was determined by the following calculation and given to each animal after the behavioral task: ((last day’s body weight) – (today’s body weight))/2 + (last day’s supplemental water amount). Only mice who obtained water reward more than 80% of total trials in the last day of training were used for the next behavioral tests. A total of 2 out of 26 mice were excluded from Fig. 1 because they did not achieve this criterion.
Behavioral tests
Following the 3 days of training, the animal behaviors were tested for 7 days (4 days with no monster and 3 days with monster, interleaved in an alternating manner). Control (no monster) sessions were exactly the same as training sessions. Monster sessions were the same as control sessions except for the presence of a monster. The monster moved when a mouse entered the monster territory (‘Monster’ section).
The ‘avoidance’ trial was defined as any trial without reward acquisition (a contact to the waterspout). The avoidance rate for each trial was calculated as the fraction of animals that failed, and the standard error of the mean (s.e.m.) was calculated using binomial distribution. Avoidance rate for each session or multiple sessions was calculated as the fraction of trials that each animal failed, and then, the mean and s.e.m. in all the animals were obtained. The predictive avoidance trial was defined as any trial without entry to the monster territory. A rate of predictive avoidance was calculated as the fraction of animals that did not enter the monster territory (each trial data) or as the fraction of trials when each animal did not enter the monster territory (session data). The reactive avoidance trial was defined as any trial when animals enter the monster territory but did not acquire reward. A rate of reactive avoidance was calculated as the fraction of animals that did not acquire water in animals that entered a monster territory (each trial data) or as the fraction of trials that did not acquire water in trials when each animal entered a monster territory (session data).
Surgeries for ablation were performed after the 3 days of training (control sessions with no monster). After the recovery periods (1 week), we performed one day training with no monster and then 7 days of tests (4 days with no monster and 3 days with monster, interleaved in an alternating manner). Surgeries for neural recording and cannula implantation were performed before starting training. For recording, after the recovery periods (1 week), we performed 3 days of training followed by 1 day of recording without monster and 10 days of recording with monster and 10 days of no recording without monster interleaved in an alternating manner. For the drug infusion experiments, after the recovery periods (1 week), we performed 3 days of monster training followed by 7 days of tests.
Drug infusion
To inject a DAT inhibitor (GBR12909, D052, Sigma-Aldrich, 5 mg ml−1 in distilled water with 5% dimethyl sulfoxide, 67-68-5, Sigma-Aldrich), D1R agonist ((±)-SKF-38393 hydrochloride, 0.5 or 5 µg per 0.2 µl in saline, D047, Sigma-Aldrich), D2R agonist ((−)-quinpirole hydrochloride, 0.2 or 2 µg per 0.2 µl in saline, Q102, Sigma-Aldrich), D2R antagonist ((−)-raclopride, 2 µg per 0.2 µl in saline, 84225-9506, Sigma-Aldrich) or vehicle, we followed an existing protocol12,84. The cannula plug (‘Surgical procedures’ section) was removed and replaced with an infusion needle (4.2 mm long, C317I/SPC, P1 Technologies). A solution (200 nl per side with 300 nl min−1 flow rate) was infused with a syringe pump (70-4501, Harvard Apparatus), which was connected to the infusion needle via a polyethylene tube (50 cm long, C313CT/PKG, P1 Technologies). Following the injection, the infusion needle was left in the brain for 5 min. Then, the infusion needle was removed and replaced with the cannula plug. The solution was bilaterally infused while an animal was freely moving in the home cage. The behavioral task started 10 min after the injection.
Head-fixed task
We followed an existing protocol for the head-fixed tone-water test12. After recovery from surgery, the mice were handled for 10 min, and water restriction was started and continued until the final day of behavioral testing. Then, the mice were habituated to being head fixed for 3 days. During these days, the mice were head fixed for 5–10 min and given water at random intervals (exponential distribution between 10 s and 20 s, average 13 s). After habituation, the dopamine sensor signals were recorded for one session while mice performed in tone-water tests (‘Fluorometry (photometry) recording’ section); three intensities of 8 kHz pure tone (50, 75 and 100 dB, duration 1 s) and three sizes of water (1, 3 and 10 μl) were presented in pseudorandom order. The tone was applied from the contralateral side of the recording site. Each session consisted of 120 trials.
For optogenetic experiments, each session was composed of a block of 20 trials with no optogenetic stimulation (‘no stim trials’), followed by a block of 30 trials, 15 trials with optogenetic stimulation (‘stim trials’) and 15 ‘no stim trials’ in a pseudorandom order. In each ‘no stim trial’, the mice were presented with pulses of a multimodal sensory stimulus that consisted of a moderate intensity of complex tone (wolf’s howl, 50 dB maximum, Incredible Free Sound Effects, Mixkit, https://mixkit.co/free-sound-effects/) and blue LED light (EK8437, Gitfun). Each sensory pulse lasted for 0.5 s and was repeated four times with 0.5 s interstimulus intervals, mimicking the monster paradigm (Figs. 1a and 7d). The total duration of stimuli was 3.5 s. We chose this duration because normal mice decided whether to acquire reward or avoid a monster within 4 s (the duration from the monster movement onset to the reward onset; Extended Data Fig. 8c). In stim trials, 20 Hz optogenetic stimulation at 10 mW with a duration of 5 ms each pulse (‘Optogenetic activation of dopamine axons with fluorometry recording’ section) was applied simultaneously with the sensory stimulus (0–4 s after the stimulus onset). We chose these parameters to not exceed the physiological ranges of responses (natural responses to a high intensity of stimulus: 100 dB complex tone plus LED light; Extended Data Fig. 8d). A variable intertrial interval of flat hazard function (exponential distribution between 17 s and 27 s, average 20 s) was placed. The mice experience the same schedule of session twice (days 1 and 2) with a 1-day break in between.
AAV construction
To make a DNA construct for adeno-associated virus (AAV) to express dtA, PGKdtabpA (gift from Philippe Soriano; #13440, Addgene)85 was cleaved with NcoI and SacI, blunted and subcloned into pAAV-CA-flex (#38042, Addgene)86 cleaved with EcoRV to obtain pAAV-CA-flex-dtA. AAV was produced at the UNC Vector Core. The construct is deposited at Addgene (#232236), and the virus will be deposited at the UNC Vector Core.
Surgical procedures
All surgeries were performed under aseptic conditions with animals anesthetized with isoflurane (1–2% at 0.5–1.0 l min−1). Analgesia was administered by intraperitoneal injection pre- (buprenorphine, 0.1 mg kg−1) and postoperatively (ketoprofen, 5 mg kg−1). We used the following coordinates to target injections and/or implants for TS: bregma −1.7 mm, lateral +3.2 mm, depth −2.4 mm; posterior DLS/anterior TS (aTS): bregma −1.0 mm, lateral +3.2 mm, depth −2.4 mm; DLS: bregma −0.5 mm, lateral +3.0 mm, depth −2.4 mm; and SNL: bregma –3.5 mm, lateral +1.9 mm, depth –3.8 mm (relative to dura)87.
Ablation of dopamine neurons
To bilaterally ablate dopamine neurons projecting to the striatum, we largely followed an existing protocol12,22,88. We prepared a solution of 2.5 mg ml−1 desipramine HCl and 0.5 mg ml−1 pargyline: 28.5 mg desipramine (D3900, Sigma-Aldrich) and 6.2 mg pargyline (P8013, Sigma-Aldrich) were dissolved in 10 ml sterile saline (0.9% NaCl, PHR1008, Sigma-Aldrich), neutralized to pH 7.4 with NaOH, frozen in −80 °C and thawed each time before use. This cocktail prevents uptake of 6-OHDA by noradrenaline neurons (although noradrenalin projections are not detectable in TS) and degradation of 6-OHDA. The solution was injected (intraperitoneally) to animals at 10 ml kg−1 before surgery. After injection, the mice were anesthetized as described above for injection of 6-OHDA into the brain.
We then prepared a solution of 0.2% (2 mg ml−1) ascorbic acid: 10 mg ascorbic acid (1043003, Sigma-Aldrich) was dissolved in 5 ml sterile saline, frozen in −80 °C and thawed each time before use. 10 mg ml−1 6-OHDA solution was freshly prepared before each surgery: 11.03 mg 6-OHDA.HBr (H116, Sigma-Aldrich,) or 9.15 mg 6-OHDA.HCl (H4381, Sigma-Aldrich) was dissolved in 0.5 ml of 0.2% ascorbic acid solution. The ascorbic acid in this solution prevents 6-OHDA from breaking down. The control animals were injected with 0.2% ascorbic acid solution (vehicle). To further prevent 6-OHDA from breaking down, we kept the solution on ice, wrapped in aluminum foil, and it was used within 3 h of preparation. If the solution turned brown (indicating that 6-OHDA has broken down), it was discarded, and fresh solution was made. The 6-OHDA (or vehicle) was injected bilaterally into DLS, posterior DLS/aTS or TS (200 nl per side). The mice were given 1 week of resting to recover and to allow sufficient cell death to occur. The control animals were pooled for Fig. 1.
Guide-cannula implantation surgical procedure
To inject a dopamine related drugs into the TS, we bilaterally implanted a stainless guide cannula (4-mm long, 23 GA, C317G/SPC, P1 Technologies). We slowly lowered the cannula into the TS, one side at a time. Once the cannula was lowered, we attached it to the skull with black Ortho-Jet dental adhesive (Ortho-Jet, Lang Dental,). After waiting 15 min for the dental adhesive to dry, we applied a very small amount of rapid-curing epoxy (A00254, Devcon) to attach the cannula even more firmly to the underlying adhesive. After waiting 15 min for the epoxy to dry, a cannula plug (4.2 mm long, 30 GA, C317DC/SPC, P1 Technologies) was inserted to prevent tissue growth in the cannula. The mice were given 1 week of recovery time to rest following the procedure.
Fluorometry (photometry) surgical procedure
To express GRABDA2m21 or GRABDA3m41, we unilaterally injected 300 nl of mixed (3:1) virus solution, AAV9-Syn-GRABDA2m (5.0 × 10¹³ particles per milliliter, Vigene Bioscience) and AAV5-CAG-tdTomato (4.3 × 10¹² particles per milliliter, UNC Vector Core) or 300 nl of AAV9-hSyn-DA3m (h-D05) (1.3 × 10¹³ particles per milliliter, WZ Bioscience) into the striatum. To express ChrimsonR in dopamine neurons, we injected 300 nl of AAV8-hSyn-flex-ChrimsonR/tdTomato (3.9 × 10¹², UNC Vector Core) into the SN in DAT-cre mice. For specific expression of GCaMP7f in D1 and D2 neurons, we unilaterally injected 300 nl of mixed (3:1) virus solution, AAV9-Syn-flex-GCaMP7f31 (2.8 × 10¹³ particles per milliliter, #104492, Addgene) and AAV5-CAG-flex-tdTomato (7.8 × 10¹² particles per milliliter, UNC Vector Core) into TS in Tac1- or Adora2A-cre mice. For the specific expression of GCaMP8m in D1 or D2 neurons and ChrimsonR in dopamine neurons, we unilaterally injected 300 nl of 1:3 diluted AAV5-syn-flex-jGCaMP8m-WPRE (2.4 × 10¹³ particles per milliliter, #162378-AAV5, Addgene) in TS and 300 nl of AAV8-CAG-FLPX-rc[ChrimsonR-tdT] (2.3 × 10¹³ particles per milliliter, #130909-AAV8, Addgene) in SN in Tac1-cre;DAT-flp or Adora2a-cre;DAT-flp double-transgenic mice. Virus injection lasted around 10 min, after which the injection pipette was slowly removed over the course of several minutes to prevent damage to the tissue. We also implanted an optic fiber (400 µm diameter, Doric Lenses) into the virus injection site. To do this, we first slowly lowered an optical fiber into the striatum. Once the fiber was lowered, we first attached it to the skull with ultraviolet-curing epoxy (NOA81, Thorlabs) and then a layer of rapid-curing epoxy to attach the optical fiber even more firmly to the underlying glue. After waiting 15 min for this to dry, we applied a black dental adhesive (Ortho-Jet, Lang Dental). We used a zirconia ferrule (ZF_FLT, Doric Lenses) for a corresponding patch cord (SMA-MF, Doric Lenses) in head-fixed experiments and a magnetic fiber cannula (SMR_FLT, Doric Lenses) for a patch cord (SMA-SMC, Doric Lenses) in the freely moving experiments. After waiting 15 min for the dental adhesive to dry, the surgery was complete.
Other AAV surgical procedure
To specifically ablate D1 or D2 neurons in the striatum, AAV8-CA-flex-dtA (2.6 × 10¹² particles per milliliter, UNC Vector Core)89 was bilaterally injected (200 nl each) into TS in Tac1-cre/Ai14 mice and in the TS in Adora2A-cre/Ai14 mice. The saline was bilaterally injected in TS in control mice. The injection procedures are the same as described in Fluorometry surgical procedures. The mice were given 2 weeks resting to recover and to allow cell death.
To visualize vGluT2-positive neurons in the SNL, 300 nl of AAV5-CAG-flex-GFP (4.3 × 10¹² particles per milliliter, UNC Vector Core) was unilaterally injected into SNL in vGluT2-cre mice. The injection procedures are the same as described in fluorometry surgical procedures. The injection procedures are the same as described in Fluorometry surgical procedures. Histology was performed after 2 weeks from the surgery.
Fluorometry (photometry) recording
The fluorometry recording was performed as previously reported22,90. We used an optic fiber to stably access deep brain regions and interface with a flexible patch cord on the skull. The patch cord simultaneously delivers excitation light (473 nm, Laserglow Technologies, Canada; 561 nm, Opto Engine) and collects dopamine sensor/GCaMP and tdTomato fluorescence emissions. Activity-dependent fluorescence emitted by cells in the vicinity of the implanted fiber’s tip (NA 0.48) was spectrally separated from the excitation light using a dichroic, passed through a single band filter and focused on a photodetector connected to a current preamplifier (SR570, Stanford Research Systems). During the photometry recording, the optic fibers on the animal’s skull were connected to a magnetic (400 µm diameter, NA 0.48, 3 m long, SMA-SMC, Doric Lenses) or zirconia (SMA-MF, Doric Lenses) patch cord for freely moving or head-fixed experiments, respectively. The emitted light was then filtered using a 493/574 nm beam splitter (FL-006972, Semrock), separated by a 556 nm beam splitter (T556lpxr, Chroma Technology) into two channels, followed by a 500 ± 20 nm (Chroma) and 661 ± 20 nm (Semrock) bandpass filter and collected by a photodetector (FDS 10 × 10 silicone photodiode, Thorlabs), which is connected to a current preamplifier (SR570, Stanford Research Systems). This preamplifier outputs a voltage signal which was collected by a data acquisition board (NIDAQ, National Instruments) and custom software written in Labview (National Instruments). The lasers were turned on at least 30 min before recording to allow them to stabilize. Before each recording session, laser power and amplifier settings were adjusted. After each recording session, collected light intensity was measured from the patch cord using a photometer. The light intensity fell within a range of 50–200 μW across animals and days.
Optogenetic activation of dopamine axons with fluorometry recording
The optogenetic activation was performed using 625 nm LED (M625F2, Thorlabs) delivered through an optical patch cord (400 μm, 0.48 NA, Doric Lenses) (Extended Data Fig. 9). Pulses of 10 mW light with a duration of 50 ms were delivered at frequencies of 10, 20 or 40 Hz, controlled by custom software written in LabVIEW (National Instruments) via a NIDAQ board (PCI-e6321, National Instruments). The same patch cord was used for photometry recording. GCaMP excitation light (473 nm, Laserglow Technologies) and optogenetics stimulation light were integrated in a three-port fluorescence mini cube (FMC3_(390-540)_(560-1000)_S, Doric Lenses with a bandpass filter (Semrock FF01-630/92, transmitting 580–680 nm) added to the optogenetic stimulation port) and then delivered to the mice. Other signal collection setups were the same as described in the ‘Fluorometry (photometry) recording’ section. To mask light illumination for optogenetics, two red lamps (Bluex Bulbs Store) were placed on both sides of the mouse with approximately 15 cm distance to their eyes (‘masking light’). They were turned on before the mice entered the arena and kept on throughout the experiments.
Signal analysis
The DA sensor or GCaMP (green) and tdTomato (red) signals were collected as voltage measurements from current preamplifiers (SR570, Stanford Research Systems). The green and red signals were cleaned by removing 60 Hz noise with band-stop, finite impulse response filter at 58–62 Hz and smoothing with a moving average of signals in 50 ms. The global change within a session was normalized using a moving median of 100 s. Then, the correlation between the green and red signals was examined by linear regression using signals during an entire session for monster tasks and using signals during the intertrial interval (−6 to 0 s) for head-fixed tasks. If the correlation was significant (P < 0.05), the fitted red signals were subtracted from green signals. The responses aligned at a behavioral event were calculated by subtracting the average baseline activity (−2 to 0.2 s before trial start for monster tasks and −2 to 0.1 s before trial start for head-fixed tasks).
In head-fixed tasks, the dopamine responses in striatal areas were categorized into five types with modulation by water size and/or tone intensity: value (+/−) (significantly positive modulation with water size and significantly negative modulation with tone intensity), value (+) (significantly positive modulation with water size and no significant modulation with tone intensity), intensity (significantly positive modulation with tone intensity and no significant modulation with water size), value and intensity (significantly positive modulation with both tone intensity and water size) and other (no significant modulation with either water size or negative tone intensity).
We built a regularized linear regression to fit cosine kernels90,91 (width of 500 ms, interval of 100 ms) to the activity of dopamine axons in each animal. We used down-sampled (every 20 ms) responses for the model fitting. We used two different time points to lock kernels: water onset (‘water’) and monster movement onset (‘monster’). Both kernels span −5–12 s from the event start. All the kernels were fitted to responses using linear regression with an elastic net regularization (α = 0.75) with tenfold cross validation. The regularization coefficient lambda was chosen so that cross-validation error was minimum plus one standard deviation. A percent explained by a model was expressed as the reduction of the variance in the residual responses compared to the original responses. Contributions of each component in the model were measured by reduction of the deviance compared with a reduced model excluding the component. A model was fitted with dopamine activity of each animal in control sessions 1–3 and monster sessions 1–3.
To test correlation between neural signals and behavior (overall avoidance which is determined by failure of reward acquisition, predictive avoidance or reactive avoidance) across individuals or across monster sessions (that is, days), neural responses in each animal were first averaged within a session. The obtained responses in each session in each animal were used to examine the time course of the responses across sessions in each animal. The average responses within a session were further averaged across sessions in each animal to prevent sampling bias across sessions, which was used to examine individual variability. To examine effects of trial types, neural responses in successful reward acquisition trials and avoidance trials in each animal were first averaged within a session and then averaged across sessions to visualize activity patterns in each trial type. To compare responses between trial types, all trials of each trial type in each animal were averaged and directly compared within animals. The same dataset was also examined with a three-way analysis of variance (ANOVA) with animal identity (ID), successful reward acquisition (success) and trial number (trial) as predictive factors. The ID was treated as a random variable and the others as fixed, and the trial was treated as a continuous variable and others as categorical.
Histology and immunohistochemistry
The histology was conducted in the same manner as previously reported12,22. The mice were perfused using 4% paraformaldehyde, then brains were sliced into 100-µm-thick coronal sections using a vibratome (Leica) and stored in PBS buffer. To visualize dopamine axons in the striatum and dopamine cell bodies in the midbrain, the brain sections were incubated with rabbit anti-tyrosine hydroxylase antibodies (1:500, TH; AB152, MilliporeSigma) at 4 °C overnight and then with fluorescent secondary antibodies (1:1,000, A-11012, Thermo Fisher Scientific) at 4 °C overnight. The slices were then mounted in 4′,6-diamidino-2-phenylindole-containing antifade solution (VECTASHIELD antifade mounting medium, H-1200, Vector Laboratories) and imaged with a Zeiss Axio Scan Z1 slide scanner fluorescence microscope. In the figures, anatomical positions were plotted on the nearest reference slice87.
In situ hybridization
DAT-cre heterozygous; vGluT2flox homozygous double-transgenic mice were verified with RNAscope Multiplex Fluorescent V2 kit (Advanced Cell Diagnostics, ACD) using probes for DAT and vGluT2 designed and synthesized by ACD (vGluT2 C1 probe and DAT C2 probe). Double-label fluorescence in situ hybridization was performed according to the manufacturer’s instructions. Briefly, the brains were mounted in optimal cutting temperature compound embedding medium (Tissue-Tek) and freshly frozen on dry ice. The fresh-frozen brains were sectioned using a cryostat (Leica CM3050s) at 18 μm thickness, and the sections were collected on glass slides were stored at −80 °C. On the day of fluorescence in situ hybridization, the frozen sections were fixed in 4% paraformaldehyde for 15 min followed by dehydration in 50%, 75% and 100% ethanol at room temperature. The fixed sections were pretreated with 3% hydrogen peroxide (VWR) for 10 min and permeabilized for 25 min using Protease IV (ACD). For each RNAscope experiment, C1 and C2 probes were mixed (50:1), heated at 40 °C for 10 min and applied to sample slides which were then placed in ACD HybEZ II oven at 40 °C for 2 h for hybridization. The fluorescence images were acquired with Axioscan 7 using 20× objective lens and Zen Blue 3.5 software (Zeiss) as well as LSM 880 confocal microscope (Zeiss) using 40× objective oil lens and Zen Black 2.0 software (Zeiss). The analyses for cell counting and colocalization were manually performed with ImageJ.
Statistics and reproducibility
The animals were randomly selected for ablation experiments. The experimenters were blinded to the treatments of mice in ablation studies until completion of behavioral analyses. The number of animals used for ablation studies (dopamine neurons and D1 neurons, n = 6 animals) was determined by a power analysis using a pilot experiment (t-test, six animals for control and six animals for dopamine neuron ablation; the data were not included because the apparatus was slightly different) to be able to detect a significant difference in the failure rate for water acquisition compared to controls at 90% confidence level. The number of animals used for ablation studies (D2 neurons, n = 12 animals) was determined by a power analysis using a pilot experiment (t-test, 6 animals for D2 neurons ablation and 18 animals for pooled controls) to be able to detect a significant difference in improvement of the failure rate at 90% confidence level. The data analysis was performed using custom software written in MATLAB (MathWorks). All statistical tests were two-sided. All error bars in the figures are s.e.m., unless notification was given. In the boxplots, the edges of the boxes are the 25th and 75th percentiles, and the whiskers extend to the most extreme data points not considered outliers. The major experimental data were taken from more than two separate batch of experiments, and the observed tendency was conserved among the batches.
Reporting summary
Further information on research design is available in the Nature Portfolio Reporting Summary linked to this article.

Responses