Drivers of avian genomic change revealed by evolutionary rate decomposition

Main
Birds are the most species-rich lineage of tetrapods and occur in all major habitat types on the planet. Their evolutionary radiation is associated with striking biological innovation in adaptive traits1, including flight7,8, song3,9,10, coloration11,12 and beak morphology4,13. These traits have various associations with genomic evolution14, with notable examples including reduced genome size in birds with more aerial lifestyles7,15, accelerated evolution of regulatory mechanisms upon the loss of flight2, and major genomic changes associated with bone structure and song complexity1,3,9. However, it remains a challenge to disentangle the role of life history in driving genome evolution, and to identify any particular genes that have strong associations with the diversification of avian phenotypes14,16. The increased availability of whole-genome sequences for large numbers of bird species5 offers an unprecedented opportunity to explore how life history and phenotype are linked to genomic signals across evolutionary time17. In particular, whole genomes have now been sequenced for almost all bird families, offering an improved resolution of phylogenetic relationships at the family level and providing a comparative framework for detailed analysis of genomic evolutionary rates6.
Studies of the rates of genomic change across taxa have helped to explain various macroevolutionary phenomena, with the potential to improve our understanding of the factors that drive evolutionary success. For instance, the explosive diversification in birds has been linked to faster genomic evolution18 and to changes in the probabilities of different nucleotide point mutations19. Absolute evolutionary rate is also expected to be influenced by fundamental life-history traits such as generation length20, body mass21,22,23, metabolic rate23,24 and polygyny25, supporting a close relationship between ecology, genome evolution and macroevolutionary success.
Genomic comparative research has often focused on the substantial variation in evolutionary rates across taxa26,27, while assuming that these patterns of variation are shared across all regions of the genome28. However, such a focus on among-lineage variation overlooks the nuanced signals across the genome that might reveal the role of particular metabolic pathways or subsets of genes as drivers of evolution. In birds, for example, sex chromosomes and macrochromosomes appear to be evolving more rapidly than the rest of the genome1,5. This pattern is hypothesized to reflect the lower effective population size of sex chromosomes, the reduced gene density in large chromosomes and relaxed selective constraints, all of which heighten the effect of genetic drift. Similarly, rates might be accelerated in the coding regions of songbird genomes, as complex vocalization is likely to be associated with substantial genomic changes9. Whole-genome data from large numbers of avian taxa now offer a wealth of information for testing such hypotheses about the molecular evolutionary process. However, these data pose a challenge for the methods that are commonly used to study evolutionary rates, which generally have limited scalability.
Here we have identified the major axes of evolutionary rate variation across phylogenetic branches and genomic loci in birds. By using formal tests based on principal component analysis of molecular rate estimates, we are able to identify the most influential taxa and loci on each axis of evolutionary rate variation29. We refer to this approach as ‘evolutionary rate decomposition’ (Extended Data Fig. 1). We applied this method to a dataset of 218 de novo genomes produced by the Bird 10,000 Genomes (B10K) consortium5 that sampled from almost every extant avian family (87%)6, allowing us to identify genes that have covarying rates within subsets of lineages29. Using a comprehensive dataset of species traits, we identified the major correlates of evolutionary rates across families. We also leveraged estimates of rates of nonsynonymous substitutions (dN) and synonymous substitutions (dS) to gain insights into the contribution of mutation rate, selection and population size to evolutionary rate variation30. Our study provides a comprehensive description of the dominant drivers of avian evolutionary rates at the genomic scale.
Clutch size predicts mutation rates
To examine the relationship between biological traits and molecular evolution in birds, we analysed a comprehensive set of 23 life-history, morphological, ecological, geographical and environmental traits (Supplementary Data 1; Methods). We tested the association between these traits and average family-level rates across four measures of molecular evolution: dN, dS, dN/dS (ω) and rates in intergenic regions (Supplementary Data 2). These measures have the potential to provide complementary insights into the evolutionary process30: dN is influenced by the mutation rate, population size and selection; dS is influenced by the mutation rate; and their ratio (ω) is influenced by selection and population size. Genome-wide variation in ω is expected to be driven by population size. Rates in intergenic regions of the genome are expected to reflect the mutation rate. We used multiple Bayesian regression to test predictors of evolutionary rates, and supported these inferences with frequentist regression and machine learning-based random forest analyses. All regression models included body mass as a covariate, given its strong association with life-history traits.
Clutch size showed a significant positive association with mean dN, dS and mean rates in intergenic regions, after accounting for a diverse range of covariates (Fig. 1a,b; dN coefficient 95% credible interval (CI): 1.19–8.57; dS 95% CI: 4.20–10.50; intergenic 95% CI: 3.57–10.03). Generation length was further revealed by random forest analyses as the most important variable in driving molecular rate variation, receiving the maximal importance score in explaining dN, dS, ω and intergenic region rates, this time in a negative relationship (Fig. 1a,c). These results suggest a role for clutch size and generation length in driving mutation rates across deep timescales, which is consistent with both variables being found as predictors of instantaneous mutation rates in parent–offspring trios31. Our results are also consistent with findings of a link between clutch size and substitution patterns among the four nucleotide types19. Clutch size is likely to have an important role in adaptation, given its association with a wide range of other species characteristics, including growth rate, egg size and longevity, as well as geographical factors such as insularity and latitude32. Meanwhile, animals with short generations tend to copy their genomes more frequently per unit of time, whereas those with long generations are expected to place greater investment in DNA repair20,31. We also note that clutch size and generation length covary, such that longer-lived birds tend to have smaller clutches. The independent effects of these two variables on molecular evolutionary rates are likely to be connected via other overriding life-history strategies (for example, pace of life). Clutch size might offer greater explanatory power for molecular rate variation than other variables because of its effect on the number of viable genomic replications per generation. Larger clutch sizes are associated with greater numbers of viable copies of the genome, increasing the opportunity for mutations to be transmitted to future generations33. Alternatively, the expected greater parental care in small clutches could lead to reduced mutation rates, driven by reduced exposure to mutagens in the germline34. However, this latter hypothesis has not been described or tested in detail.

a, Clutch size significantly predicted the largest number of metrics of genome-wide molecular rates in Bayesian multiple regression, whereas generation length was also found to have the greatest importance scores in driving molecular rate variation. IG, intergenic. Error bars indicate the 95% highest posterior density interval (HPDI) in coefficients. b,c, Avian family lineages (n = 218) with larger clutches show greater molecular evolutionary rates (b), whereas lineages with longer generations show reduced molecular rates (c). Branch colours show uncorrected log mean clutch size per family, whereas those coloured by generation length show the residuals of the variable regressed against body mass. Myr, million years. d, Rates of dS at genes (n = 14,368), with mean rate taken across all lineages at each locus, were explained in Bayesian regression by terms involving the content of guanine and cytosine (GC content). e, Interaction terms showed accelerated dS rates at genes with high GC content that occur close to chromosome endings and that have short sequences.
When we used species-level trait data rather than family averages, multiple regression analyses revealed additional links between ecological traits and genome-wide rates. In these analyses, taxa with shorter tarsi were found to have elevated rates of dN (95% CI: −9.88 to −1.13) and intergenic region evolution (95% CI: −8.06 to −0.13; Extended Data Fig. 2). These links are consistent with genomically widespread adaptations to flight-intensive lifestyles associated with the shortest tarsi. Short tarsi are generally associated with arboreal and particularly aerial lifestyles, whereas long tarsi are often found in ground-dwelling birds35. Therefore, the links that we identified are consistent with genomically widespread adaptations for flight-intensive lifestyles associated with the shortest tarsi36. High intergenic rates in these taxa might reflect the mutagenic effect of the oxidative stress of intensive flight habits24.
Population size provides a further possible link between genome-wide dN and variables such as tarsus length, wing length, brain mass, beak size and developmental mode, all found as moderately important in random forest analyses (Fig. 1a). For example, taxa with longer tarsi such as cariamids and rails are often ground-dwelling, with a tendency towards reduced dispersal or flight ability, potentially reducing connectivity among populations37. Nonetheless, abundance and traits associated with flight ability, such as the hand-wing index, were not significant predictors of molecular rates in our data. Unlike clutch size, the effect of tarsus length on mutation rate varies with the comparative analysis framework. Many such traits with inconsistent effects are unlikely to represent dominant drivers of genomic rates across avian history and, instead, might affect subsets of genes and taxa.
Another trait of interest is body mass, which we found to be a strong predictor of avian molecular rates in single-variable regression. This association might arise via a link between body mass and the number of cells under pressure to reduce somatic mutation and damage, particularly when body mass is associated with longevity20. However, body mass is correlated with several life-history traits, and once we accounted for these in multivariate models, we found no evidence that body mass predicts variation in molecular rates (Supplementary Data 3). Therefore, our data suggest that changes in body mass have not directly driven genome-wide evolutionary rates, but that these are indirectly linked to molecular evolution through more dominant mechanisms mediated by clutch size, generation length and other factors.
In contrast to other molecular rate metrics, genome-wide values of ω did not show an association with any of the sampled traits, pointing to a limited effect of fluctuations in selection or population sizes on avian molecular evolution. Population sizes are believed to have increased rapidly immediately after the Cretaceous–Palaeogene (K–Pg) transition, when a wide array of ecological niches became available following the extinction of many larger species of birds and other animals, as proposed by the ‘Lilliput effect’ hypothesis23,38,39. The large populations that came as a consequence would have experienced reduced genetic drift, leading to more efficient removal of slightly deleterious non-synonymous mutations and thus lower ω in smaller-sized avian taxa30. One explanation for the lack of this signal in our data is that the effects of population-size fluctuations are indistinguishable from signatures of selection, and have been eroded by other genomic processes across ancient timescales. For instance, inferences of genome-wide ω at deep timescales can be negatively affected by multiple substitutions (saturation), phylogenetic error and shifts in the evolutionary rate of subsets of genes in individual lineages. In addition, the effects of selection and population size are uneven across the genome6, which is reflected in our finding of variation in ω across axes of variation and across chromosomes. Finally, incomplete lineage sorting and reticulate evolution can also degrade the signal of ancestral population size40. Future examinations of these questions at finer taxonomic levels will be able to produce a more nuanced picture, for instance, by extending estimates of population-size dynamics41 to deeper timescales.
Evolutionary rates at individual gene loci, averaged across lineages, offer a complementary insight into overall drivers of genomic evolution. We tested whether gene-specific evolutionary rates, taken as the unweighted average rates across lineages per gene, could be explained by three key variables: the proportional content of guanine and cytosine in sequences (GC content), gene length and gene location within chromosomes. Multiple regressions of rates of dS revealed faster evolution in genes with higher GC content (95% CI: 19.42–24.29), shorter sequences (95% CI: −10.23 to −7.74) and smaller distance to chromosome endings (95% CI: −7.01 to −2.56; Fig. 1d). This is in agreement with previous work on the effect of GC content on synonymous evolutionary rates in birds22. Increasing values of ω were observed with decreasing GC content (95% CI: −27.09 to −20.64) and greater distance from chromosome endings (95% CI: 0.60–5.60), probably reflecting the effect of these factors on dS but not dN. Interaction terms in regression revealed that the highest rates of dN and dS occur in short genes with high GC content (dN 95% CI: −27.47 to −14.58; dS 95% CI: −32.01 to −23.56), and highest dS also occurring in genes with high GC content located near chromosome ends (95% CI: −20.97 to −4.92). However, we did not find evidence for an interaction where accelerated evolution occurs in short genes found near chromosome endings. Our results point to a dominant role of GC content in mediating mutation rate across genes given that dS (primarily associated with mutation rate) is linked to the factors examined, whereas changes in ω appear concomitant with changes in dS but not dN. High GC content has previously been associated with more frequent breaks in DNA strands, greater recombination42 and a unique evolutionary dynamic in avian genes22. Similarly, chromosome endings tend to have complex evolutionary signatures consistent with accelerated rates6,35.
Major changes in rates across lineages
Rate decomposition presents a powerful approach for the analysis of molecular rates that allows a dissection of the subsets of lineages and genes that have had an unusually large effect on evolutionary rate variation29 (Extended Data Fig. 1). By using principal component analysis of the full set of branches in the phylogenetic tree, the method uses unsupervised learning to model the main axes of variation in rates. Permutation tests can reveal the contribution of each axis, and of each taxon on each axis, to variation in rates. Out of 433 principal components in each avian molecular dataset, our analyses of rate decomposition consistently showed that only a small portion of components (less than 5%; P < 0.01) explained significant amounts of variation in rates. This included 8 principal components in dN, 10 in dS, 7 in ω and 16 in intergenic regions.
The first principal component explained large proportions of variation in dN (35%), ω (38%) and rates in intergenic regions (24%), and the lineages with the greater loadings on this component were consistently the terminal branches in the avian phylogeny (Fig. 2 and Extended Data Figs. 3 and 4). This indicates that there is no particular subset of family lineages that drives rate variation across loci. Instead, most loci show a consistent pattern of rate variation across families, supporting the dominant effect of gene-specific rates26. As this result of terminal branches dominating rate heterogeneity is observed in dN and ω, but not dS, it is likely to reflect widespread variation in genome-wide selective constraints or population sizes within families (Extended Data Fig. 5). Denser taxon sampling will enable further disentanglement of the drivers of rate variation, such as any concomitant climate-driven fluctuations in population size across families43. Alternatively, the strong influence of terminal branches might indicate the difficulty in recovering signals of selection or population-size fluctuation from nucleotide data at deeper timescales44.
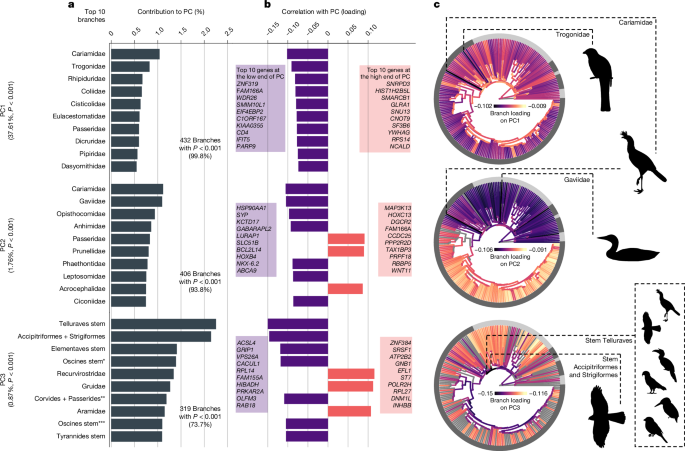
The rates matrix that undergoes decomposition includes branches as columns and loci as rows, and is built separately for each type of rate (dN, dS, ω and intergenic; the results of ω rates are shown here). Principal components (PCs) describe the variation of locus rates as explained by taxa with significantly high loadings (Extended Data Fig. 1). a, Taxon contributions for the top ten taxa in the top three principal components. The principal components and taxa shown here explain significantly more variation than expected under permutation (P < 0.01). According to the taxonomy of passerines56: * indicates the stem of the oscines minus the grouping of Menuridae and Atrichornithidae; ** denotes the stem of infraorders Corvides and Passerides, plus the grouping of families Orthonychidae and Pomatostomidae; and *** indicates the stem of the oscines minus Menuridae, Atrichornithidae, Climacteridae and Ptilonorhynchidae. b, Branch loadings indicate the correlation between taxa and locus rates in each principal component. c, Branches are coloured by loadings, in which grey branches are those that did not have significantly greater explanatory power than expected under permutation. The outer ring indicates the major taxonomic groups named in Fig. 1, whereas the dashed lines indicate the two branches with the greatest loading in each principal component. Silhouettes in panel c were adapted from PhyloPic (http://phylopic.org) under CC0 1.0 (Alcedinidae, Buceros rhinoceros, Nestor notabilis, Passer domesticus, trogon and Accipiter nisus) and Public Domain Mark 1.0 (Gavia immer and Cariama cristata) licences.
The other significant principal components of dN and ω highlighted the stem branches leading to the large neoavian clades Telluraves and Elementaves, as well as several deep branches in the passerine clade, as being hotspots of variance in molecular rates (Fig. 2). The prominent role of these early neoavian branches in explaining variation in molecular rates points towards major ecological and adaptive changes across birds occurring immediately after the K–Pg transition. This is consistent with evidence of rapid change across a range of traits such as body mass and brain mass at that time23,38. The major principal components of dS variation also point to the same branches (stem lineages leading to Telluraves and Elementaves) as having the greatest explanatory power, consistent with genome-wide increases in mutation rate soon after the K–Pg transition23,40.
Extensive variation in chromosomal rates
Evolutionary rates vary considerably across the chromosomes of avian genomes, with the largest macrochromosomes showing evidence of lower rates of mutation (dS) than expected under permutation of loci (Fig. 3a). Similarly, microchromosomes frequently have significantly higher evolutionary rates than expected under permutation. These results are consistent with greater rates of intrachromosomal rearrangement and recombination in microchromosomes than in macrochromosomes6,42. Microchromosomes have also been found to contain greater amounts of simple repeats and hotspots of double-strand breakage that are GC rich. Our data also show microchromosomes to be GC rich overall (Fig. 3), consistent with the hypothesis that the increased GC content that arises from recombination is a possible source of DNA damage and a likely cause of elevated mutation rates.
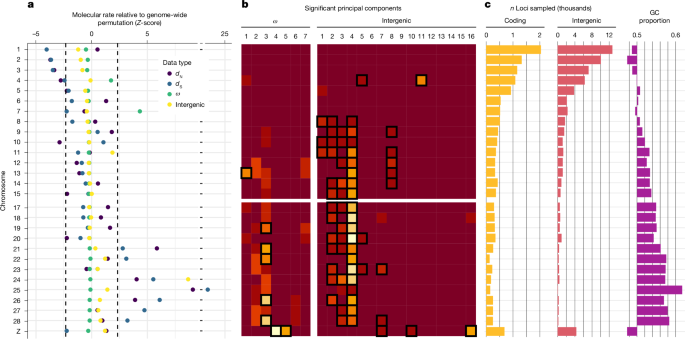
a, Each chromosome was assessed for its mean rate being different from that expected under genome-wide permutation. b, Loci at the extremes of principal components were tested for having an overrepresentation of each chromosome. The light colours indicate increasing overrepresentation of a chromosome (rows) at a particular principal component (columns). The boxed cells indicate chromosomes with a significantly greater portion of genes at the extremes of a principal component (P < 0.01). Chromosome 16 was excluded from all analyses due to a small sample size of loci. c, The number of loci in our samples reflects chromosome size, whereas the mean proportion of GC content is likely to reflect the density of genes and recombination breakpoints.
Rate decomposition further revealed the subsets of lineages in which chromosomes showed extremes in evolutionary rates. The extreme values of principal components of ω and intergenic regions included an overrepresentation of loci in microchromosomes (Fig. 3b). That is, although all microchromosomes were overrepresented at the extremes of at least one principal component, chromosomes 1–3 and 5–7 were not overrepresented in any significant principal component. Furthermore, this distribution of ω highlights the role of microchromosomes in driving rates in principal component 3, a component that is substantially explained by the earliest neoavian and passerine lineages, suggesting widespread selective constraints on microchromosomes immediately after the K–Pg transition. As microchromosomes are thought to be crucial for the expression of housekeeping genes42, the result suggests that the earliest members of Neoaves experienced major evolutionary rate changes in their housekeeping machinery. Intergenic regions show similar patterns of extreme rates occurring primarily in microchromosomes and at principal components that are explained by early passerine branches (Extended Data Fig. 3).
The overrepresentation of microchromosomes in the evolutionary rate shifts along early neoavian branches suggests a greater influence from microchromosomes than macrochromosomes on avian evolution. This result is consistent with evidence that microchromosomes are highly acetylated powerhouses of gene expression and that they form the building blocks of larger chromosomes41. Meanwhile, macrochromosomes are less resistant to major rearrangements, and their large size is a consequence of the fusion of microchromosomes that are less transcriptionally active42. Evolutionary rates are likely to have varied the most in microchromosome regions undergoing intense selection, including those fundamental for development and adaptation. Overall, our data provide evidence that severe selective constraints and conserved synteny can co-exist with high nucleotide mutation rates over large temporal scales.
Early shifts in key genomic machineries
To investigate the functional groups of genes associated with the most prominent avian families driving rate variation (defined by branches with significant loadings on principal components), we examined the loci with the most extreme values at each principal component. To understand the ecological implications of these genes, we also examined whether the proportions of variance explained by each avian family (loadings) were associated with their life-history and morphological traits described above. Gene set enrichment analysis was performed for the 20% of loci at the extremes of principal components of ω (Extended Data Fig. 1), focusing on those components that explained significantly greater heterogeneity than expected under permutation (P < 0.01). Along the first principal component of ω, enrichment was found for the ribosome gene term at high values of the axis (Supplementary Data 2). As this axis is negatively linked with rates on terminal branches, the result indicates a marked slowdown in ribosomal evolutionary rates across many present-day avian families.
The loadings at the third principal component of ω (Supplementary Data 3) showed a significant positive relationship with tarsus length (Fig. 4a, 95% CI: 0.12–1.28), suggesting that genes with greater values on this axis had accelerated rates in taxa with long tarsi. This principal component (PC3 of ω) was one of the few in which large numbers of taxa contributed to variation significantly more than expected under permutation, and its link with tarsus length is the only significant association among any trait variable and components with large numbers of taxon representatives.
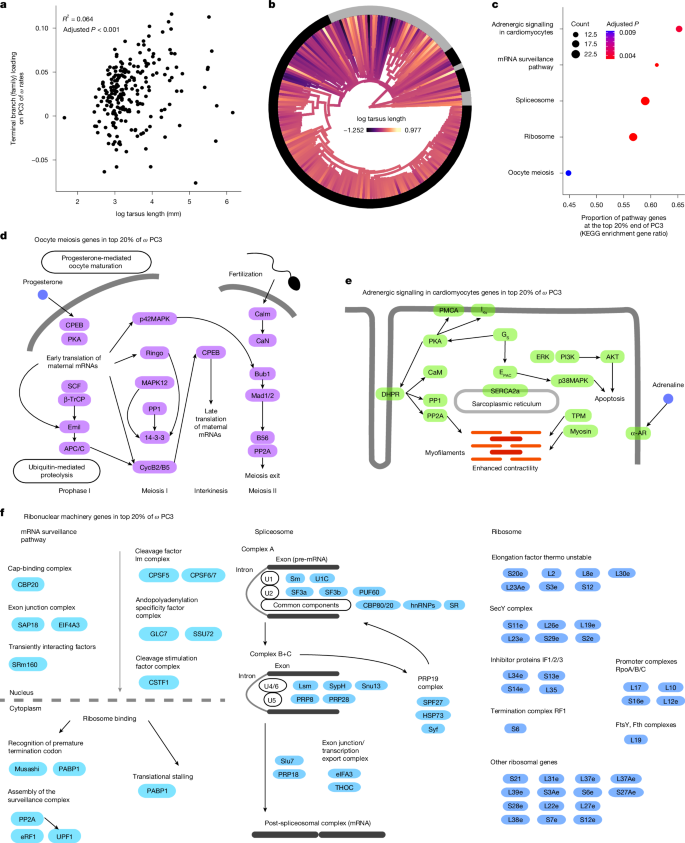
a, Regression P value and R2 are shown for the single-variable regression among family-level (terminal branches) loadings on ω third principal component (PC3) against log mean tarsus length. This variable was also uniquely significant in multiple regression involving other traits as partial terms. b, The phylogenetic distribution of tarsus length shows the increase in diversity in this trait immediately after the K–Pg transition. c–e, Genes with extreme values of PC3 of ω were enriched for multiple functional terms (c), including oocyte meiosis, putatively linked to DNA repair mechanisms (d); and adrenergic signalling in cardiomyocytes, linked with heart function (e). f, Additional enriched terms included the ribonuclear machineries for splicing, mRNA surveillance and ribosomal activity. Only the genes inside the extreme values of PC3 of ω are shown, such that their metabolic links are approximate.
One distinctive feature of tarsus length is its very rapid increase in diversity immediately following the K–Pg transition (Fig. 4b). The branches leading to birds with long tarsi represent a diverse and ancient set of avian families including plovers (Charadriidae), cranes (Gruidae), several raptor families (Accipitridae, Pandionidae and Sagittariidae) and some passerine families (Hyliidae, Cardinalidae and Thraupidae). Given that tarsus length is strongly associated with primary modes of locomotion and lifestyle in birds45,46, this finding suggests rapid diversification of lineages into an array of foraging niches associated with aerial, arboreal, aquatic and terrestrial lifestyles, all of which have evolved diverse tarsi that fit their ecology. The rapid evolution of this trait soon after the K–Pg transition suggests strong positive selection that can be explained by the enriched gene terms at the ends of PC3 of ω. In addition to corresponding to accelerated evolutionary rates along terminal branches of birds with long tarsi, gene terms enriched at the extreme of this principal component indicate decelerated rates in some of the branches with the greatest loadings on this axis, including early Neoaves (stem Telluraves and stem Elementaves) and early passerine branches (Fig. 2). These findings of a nuanced effect of the ecology surrounding tarsus length on selection regimes also complements previous work that has identified gene regulation of limb development as crucial in avian evolution2, and the tarsus as being linked to the evolution of non-coding genomic elements47.
In addition to higher ω in taxa with long tarsi and lower ω in deep post-K–Pg branches, we found the top end of the ω PC3 to be enriched for five gene functional terms (Fig. 4c). One of these terms was oocyte meiosis (Fig. 4d), which is the primary pathway involved in the replication machinery of the germline and can be expected to have widespread effects across the genome through its effect on mutation rate, and hence estimates of dS. The principal components of dS did not show enrichment for any gene term, and instead consistently supported stem branches of Telluraves and of Elementaves (or related early Neoaves) as dominant drivers of evolutionary rate changes (Extended Data Fig. 3). One explanation is that, in addition to a broad range of adaptive changes, avian genomes were subject to changes in meiotic DNA repair mechanisms that led to increased mutation rates along those early branches. Support for this hypothesis includes the presence of genes that are directly involved in DNA repair among those in the enriched oocyte meiosis term, such as MAPK48,49. A further finding was the enrichment of genes encoding adrenergic signalling in cardiomyocytes (Fig. 4e). This pathway is associated with cardiac performance50,51 and suggests rapid evolution in heart function in old families with long tarsi, possibly related to relaxation of the selective constraints for intense flight. Therefore, this is also likely to reflect stronger selective constraints in taxa with short tarsi, allowing early avian lineages to sustain intense flight habits.
Additional enriched pathways included the combination of the spliceosome, mRNA surveillance and the ribosome (Fig. 4f). In combination, these terms form the backbone of the ribonuclear cellular machinery that regulates the quality control and translation of gene products. The evolution of ribonuclear machineries has been linked to protection against deleterious insertions and mutation52,53,54, whereas a link between gene regulation and limb development has been identified as central to avian evolution2. The change in ω in ribonuclear machineries in a broad range of taxa with long tarsi suggests that genomic changes contributed to increased efficiency or novelty in gene expression and regulation. Ribonuclear machinery evolution in some of the oldest families with long tarsi may have had a role in the colonization of a vast diversity of habitats, contributing to the rapid radiations of these groups after the K–Pg transition. The marked reduction in ω in stem Telluraves and stem Elementaves (or related early Neoaves) might reflect large population sizes that were probably seen after the K–Pg transition. It is likely that there was widespread competition among early avian lineages at this time, and changes in fundamental ribonuclear machineries in early Neoaves could have conferred a competitive advantage, providing some key steps towards the explosive diversifications that followed. Together, these results indicate that a dramatic increase in novel adaptations took place in stem neoavians shortly after the K–Pg transition, and that these changes were likely to have been facilitated by evolution in ribonuclear machineries.
Evolutionary rate decomposition can reveal various genomic evolutionary phenomena with smaller effects. Across avian genomes, the taxon contributions along the fifth principal component of ω are linked with brain mass (95% CI: –2.52 to –0.33; Supplementary Data 3) and range size (95% CI: –0.69 to –0.03), with the strongest contribution to variance coming from albatrosses (Diomedeidae) and all three families of birds of prey in the order Accipitriformes. Enriched terms that are accelerated in these clades include insulin signalling, critical for lipid and glucose homeostasis, Hedgehog signalling, linked with growth, and cardiomyocyte signalling, related to heart function (Supplementary Data 4). These terms suggest that albatrosses and some birds of prey underwent substantial genomic changes in body growth patterns and fuel usage55, possibly allowing endurance locomotion in large-bodied taxa. The sixth principal component of ω was linked with several lineages of waterbirds with long tarsi (95% CI: –2.15 to –0.44) and inhabiting low-rainfall environments (95% CI: –1.52 to –0.27), and revealed accelerated rates in gene terms including cellular senescence and lectin signalling. These could be related to accelerated evolution in immune systems, which might be needed to sustain the large colonial lifestyles of many water birds. Analyses of these patterns of decomposed rates across genomes at finer taxonomic scales will provide a refined picture of the dominant drivers of adaptations within avian orders and families.
Conclusions
Our study has demonstrated the effectiveness of using a framework based on genomic evolutionary rates to disentangle processes of mutation and selection across deep timescales. By identifying the dominant axes of evolutionary rate variation, our analyses have shed light on the relationships between biological diversity and genomic evolution in birds. To achieve this, we performed a series of genomic comparative analyses that revolved around the decomposition of evolutionary rates across regions of the genome and across branches of the bird phylogeny. These analyses provide evidence that the key drivers of genome evolution in birds include clutch size, generation length and tarsus length2,19,31,47—traits long considered important in avian life history and ecology—along with GC content in genes22. Our decomposition of evolutionary rates also revealed the importance of meiotic, cardiac and ribonuclear machinery evolution along some deep branches in the avian tree. These shifts in evolutionary rates took place primarily in microchromosomes and upon the evolution of tarsus length, a trait linked to terrestrial locomotion. Collectively, our analyses indicate that meiotic and ribonuclear machineries and microchromosomes, with crucial roles in DNA replication, gene usage and housekeeping, underwent rapid evolution that is likely to have contributed to the explosion of avian diversity in the immediate aftermath of the K–Pg transition. The focus of this study on nucleotide evolution provides a foundation for testing the drivers of evolutionary rates in other genomic components, such as karyotype, protein structure, gene rearrangement and transposition. We expect that analyses of genomes gathered from large numbers of taxa will provide valuable insights into the evolutionary processes shaping phenotypic variation across the avian tree of life.
Methods
Family-level phylogenomic data for avian families were collected from the database of the B10K consortium5. These included 63,430 evenly spaced intergenic loci, each with a length of 1 kb, as well as the coding regions of 15,093 orthologous genes. For each data type, we selected the representative of each avian family for which the greatest nucleotide completeness was available, providing a sample of 218 sampled tips. Other samples within families were excluded to minimize node-density effects that can mislead family-level inferences. To make reliable estimates of branch lengths in expected synonymous (dS) and non-synonymous (dN) substitutions, we filtered coding regions to exclude codons where any of the three positions was missing for more than 50% of the taxa and where the most common amino acid occurred in less than 50% of taxa. In each region, we also excluded taxa for which less than 30% of the nucleotides were available. Regions with fewer than three taxa remaining after this step were excluded from further analyses, producing a final dataset with 63,174 intergenic and 14,849 coding regions.
To infer evolutionary rates for each genomic region, we used phylogenetic estimates of branch lengths on a fixed tree topology. We forced the tree topology for each region to conform to the family-level relationships reported by the B10K consortium, using the species tree inferred from intergenic regions under the multi-species coalescent6. Phylogenetic branch lengths from intergenic regions were estimated using the best-fitting model from the GTR + F + R57 family in IQ-TREE (v2.1.2)58. Coding regions were used for inference of dN and dS branch lengths. We first estimated distance matrices for dN and dS using maximum likelihood in PAML using the models HKY + Γ and F3 × 4 for nucleotide and codon substitutions, respectively59. For each gene, maximum-likelihood dN and dS distance matrices were then transformed to the lengths of branches in the species tree using ERaBLE60.
We used ClockstaRX29 to extract branch lengths for each locus at each species-tree branch, which we then converted into rates using the family-level time-tree estimate (Supplementary Data 5). To avoid adding error due to lack of signal in the molecular data, we excluded branches with estimated lengths of less than 5 × 10⁻⁶ substitutions per site. Analyses in which each locus has a free topology are also possible in ClockstaRX, but led to a vast loss of data, including the majority of genes at deep branches, as expected in ancient systems with large amounts of incomplete lineage sorting and compounded phylogenetic error. These analyses were not considered further. Analyses using a forced topology must acknowledge that although the data might show patterns of evolutionary rate variation when the gene trees are summarized in this way, these patterns might be due to processes that occurred on nearby branches in gene trees with discordant topologies40. Nonetheless, the species tree inferred from whole-genome data provides a reasonable hypothesis for the evolutionary history that any given locus has followed.
To explore whether specific species traits explained molecular rates, we collected trait data from a series of databases and primary literature (see Supplementary Data 1 for a description of each variable). We collected a total of 23 traits with complete or near-complete sampling across bird species, including 5 life-history and demography traits (clutch size, longevity, generation length, abundance and developmental mode from altricial to precocial), 7 morphological traits (beak size, tarsus length, wing length, hand-wing index, tail length, body mass and brain mass), 5 ecological traits (habitat, habitat density, trophic level, migration and primary lifestyle), 4 geographical traits (absolute centroid latitude, latitudinal span, centroid longitude and range size) and 2 environmental traits (mean annual temperature and annual precipitation). The variable of developmental mode comes from previous work61, and is the first principal component explaining around 60% of variance in a set of traits likely to discriminate altricial and precocial species. We calculated beak size as the first principal component of beak length, width and height, explaining 89% of variance. Missing values for wing length and developmental mode were added using phylogenetic imputation assuming a Brownian motion model for trait evolution, as implemented in Rphylopars62. Across variables, the family mean and mode were used for continuous and discrete traits, respectively. Continuous variables were verified to follow logarithmic scaling. This led us to perform natural log transformations of most variables, with the exception of temperature and longitude.
Subsequent regression analyses were performed on two treatments of trait data, using the trait value of the single species sampled for genomes, or taking the mean value across all species in the corresponding family. Results from both types of analyses are provided (Supplementary Data 3). A focus on family averages reflects the fact that estimates of molecular rates correspond to the average value along the evolutionary path between the sampled individual up to the common ancestor with its sister family, following existing literature on evolutionary rates63. This approach addresses the potential effect of internal nodes when estimating evolutionary rate, but does not explicitly consider the effect of punctuated molecular change on diversification events64,65. In agreement with this signal, models explaining molecular rates using the family-average trait data of family means led to overall higher regression R2 values than those using trait data from the species sampled.
Bayesian and frequentist regressions were used for assessing whether molecular evolutionary rates were explained by the set of traits sampled. We defined a parametric model for each of the estimates of mean rates in each family (in all dN, dS, ω and intergenic regions) as response variables. Using a Bayesian mixed-effects linear modelling framework, parameter inference was performed via the no U-turn sampler66,67 as implemented in the package brms68. By using a Bayesian model, we were able to include a shrinkage prior and mitigate finite sample sizes more adequately than through a frequentist framework. In addition, the framework naturally incorporates uncertainty around significant coefficients via credible intervals, instead of P values. Using log-transformed molecular rate estimates (yin {{mathbb{R}}}^{n}), we assumed a Gaussian likelihood,
The linear predictor μ is then assumed to have a mixed-effect structure. The fixed effects included each of the 19 continuous traits collected, forming a matrix ({X}in {{mathbb{R}}}^{ntimes m}) with an intercept included in X. We normalized covariates by centring and scaling by twice their standard deviation69. Random effects were then included for three categorical variables collected: the habitat (u1,i), trophic level (u2,i) and primary lifestyle (u3,i), modelled as Gaussian random effects with independent standard deviation parameters:
The phylogenetic effect was captured as a multivariate Gaussian random effect:
where Σ is a variance–covariance matrix from our fixed time-tree assuming a Brownian motion model of trait evolution, and then scaled during analysis by the effect of phylogeny on traits, using the ({sigma }_{gamma }^{2}) parameter. To add posterior convergence of the scaling parameter, the original Σ matrix was scaled to a correlation matrix with time of most recent common ancestry of 1. The final linear predictor was therefore:
Prior distributions were chosen such that they ensured shrinkage of parameters to zero, and thereby assuming a null model where the fixed effects and random effects have no effect on the response variable.
Parameter sampling using Markov chain Monte Carlo was run across four chains for 104 iterations each. Posterior convergence to a stationary distribution was assessed via the Rhat statistic70 as well as via visual inspection of the Markov chain Monte Carlo trace.
To complement Bayesian regression analyses, we implemented the frequentist counterparts and only interpret results that are consistent between the two approaches. Models with each molecular rate as response and including trait variables as covariates were implemented using a Pagel’s lambda model of trait evolution along the phylogeny71, implemented as phylogenetic regression in the package phylolm72. In frequentist analysis, the variable of trophic level was not included due to imbalance across small numbers of factor levels that complicates parameter optimization. The distribution of trait data was visualized across branches in the avian phylogeny using fast maximum-likelihood ancestral state reconstruction as implemented in phytools73. Phylogenetic data were processed with the support of phangorn74.
The variables explaining evolutionary rates were also tested at the level of gene rates. For each gene, we calculated the mean of each type of rate (dN, dS, ω and intergenic regions) and mean GC proportion across all families. We then calculated the location along chromosomes as the proportional distance from the end of each chromosome. Genes with a distance of 0 are the closest to a chromosome ending, whereas genes with a distance of 1 indicate the closest to the chromosome middle. Bayesian and frequentist multiple regressions were used to assess whether each of the molecular rate types was explained by GC content, gene length and gene location. We also included in these models the two-way interactions between these variables. To address the possible effect of model misspecification on these analyses, we used matched-pairs tests of homogeneity75, as implemented in IQ-TREE2 (ref. 76), and parametric regression to assess the goodness of fit77 and base compositional non-stationarity78,79, as implemented in PhyloMAd80. We added the resulting statistics from each of these tests as covariates, and did not find that including any of them had a substantial effect on the results. We report the results of models including tests of marginal symmetry as covariates accounting for possible phylogenetic model mis-specification, and make all model mis-specification metrics available online (Supplementary Data 2).
Random forests provide an alternative for comparative analysis, identifying predictors while capturing the possible interactions and non-linearities. We examined the importance scores of traits as predictors in a random forest framework. We included 500-tree forests with randomly selected sets of fivefold cross-validation resampling with five iterations for hyperparameter tuning, and using the root mean squared error as a metric for regression performance (Supplementary Data 6), as implemented in caret81. Although random forests can capture additional predictive links from those shown by linear regression, they do not incorporate non-independence across samples arising from phylogenetic relatedness, such that they can also introduce bias.
We tested whether the mean molecular rate of each chromosome was different from the mean expectation from loci across the genome. To do this, we performed permutations per chromosome, involving a random draw of 1,000 sets of loci of identical size to the chromosome. We performed this permutation for each chromosome and calculated the Z-score of the mean empirical chromosome rate with respect to the permutation distribution.
We performed rate decomposition analyses to identify the lineages and genes that dominate molecular rate variation. This was done in ClockstaRX29 for each set of loci independently (dN, dS, ω and intergenic regions). To allow computational efficiency when examining intergenic regions, we analysed three random samples of 10,000 loci, and confirmed that results were consistent across each sample. The basic method of decomposition collects rate estimates in a matrix with rows representing loci and columns representing the full set of lineages (branches) in the species-tree estimate. This data structure is then decomposed for identifying the main axes of variation using principal component analysis. The software performs a permutation of the data matrix, summarizing the eigenvalues at each component using two test statistics ψ and φ82. These statistics, together with lineage loadings on each principal component, allow for tests of whether each principal component and lineage loading contributes more variation than expected from a random sample across the data82 (α = 0.01). A primary assumption under this method is that the species tree is accurate and largely concordant with gene trees. As this assumption is often violated due to phylogenetic error and gene-tree discordance, all inferences under this method refer to either the branch in question or neighbouring branches from similar phylogenetic trees, where substitutions might have actually occurred83.
We explored whether lineage contribution to variance on rate axes was associated with any traits in our comprehensive set, such that a principal component might be driven by the ecology or life history of families. To do this, we first extracted the loadings of families (terminal branches) on each of the principal components that significantly explained variation in rates. We then proceeded to perform simple and multiple phylogenetic regressions where traits were tested to explain principal component loadings, as performed for mean genome-wide rate metrics.
We then explored whether principal components are associated with any particular metabolic pathway or gene function. We extracted the 20% of loci with the maximum and minimum values at the principal components that significantly explained variation in rates. We used gene set enrichment analysis to evaluate any overrepresentation of metabolic functions of gene products independently in loci with extreme high and low rates on each significant rate axis. Each overrepresentation analysis is equivalent to a one-sided Fisher’s exact test of the disproportionate presence of a set of genes inside another set84. Gene identities were inferred using the best blastn match85 and used as input for testing enrichment of KEGG terms using clusterProfiler86. Genes in pathways were visualized and interpreted using pathview87. Bonferroni correction was used for P values of significant terms.
Overrepresentation of chromosomes in the 20% extremes of significant rate axes (principal components) was evaluated using binomial tests. Therefore, the null hypothesis was a Bernoulli experiment88 in which the proportion of loci in a given chromosome is expected to be equal in the 20% maximum and minimum loci of each axis. This test was performed for each chromosome and each significant principal component, with P values corrected using false discovery rates within principal components.
Reporting summary
Further information on research design is available in the Nature Portfolio Reporting Summary linked to this article.
Responses