Dual wavelength Brillouin laser terahertz source stabilized to carbonyl sulfide rotational transition
Introduction
The terahertz (0.1–10 THz) region of the electromagnetic spectrum has garnered significant interest due to its potential to address a diverse range of scientific and technological challenges1. Higher bandwidth requirements and an ever-growing number of internet-connected devices are creating spectral congestion in currently available wireless communication bands. So-called “beyond 5G” wireless communications will require access to higher carrier frequencies, where recent advances have demonstrated the utility of compact terahertz sources enabling high-speed data transfer2. High-frequency radar, which has been used to detect small foreign objects on aircraft runways3, can improve the spatial resolution of traditional radar with less vulnerability to inclement weather as lidar. Future developments in radioastronomy will rely on high-frequency oscillators with low timing jitter to push the spatial resolution limits of terahertz observations from space4. Furthermore, laboratory-based precision spectroscopy uses narrow linewidth sources to establish frequency benchmarks for the remote identification of molecules5,6. Despite these applications, there remains a lack of mature technologies that deliver simultaneous spectral purity and stability at these frequencies7.
One widely used approach to generating stable terahertz radiation involves the frequency multiplication of a microwave synthesizer, typically referenced to an atomic standard8. While this method transfers the fractional frequency stability to higher frequencies, it also multiplies the synthesizer’s phase noise, thereby degrading spectral purity9. This trade-off between purity and stability has led to the investigation of alternative terahertz sources based on down-conversion from optical frequencies involving division and/or photomixing. Optical sources have separately demonstrated both high spectral purity10,11 and the ability to transfer stability from microwave atomic standards12.
A key advancement in optical-based terahertz sources is the dual-wavelength Brillouin laser (DWBL): a tunable source spanning frequencies from 300 GHz to 3 THz with unmatched spectral purity13. The DWBL has already proven its high performance in wireless communication systems at 300 GHz, reaching a data transfer rate of 200 Gbit/s over a distance of 200 m14. While the DWBL exhibits low phase noise at high Fourier frequencies, it undergoes a frequency drift of several hundred kHz over the course of a day. Stabilization could be achieved by referencing microwave or optical sources through complex optical frequency comb architectures15. An alternative, streamlined approach, would be the development of a native terahertz reference, such as terahertz cavities16,17 or utilizing molecular rotations as frequency discriminators (discussed below). With its inherent spectral purity, the DWBL is particularly well-suited for probing native terahertz frequency references. This is due to the intermodulation effect, which limits how well a source can be stabilized, by its phase noise18,19. These references, in-turn, could effectively mitigate the frequency drift and enhance the long-term stability of the laser.
Many small gas-phase molecules, such as N2O, OCS, and HCN, exhibit well-defined rotational transitions at room temperature, which overlap with the DWBL’s tuning range20. These rotational transitions provide stable, absolute frequency references and can be probed using absorption spectroscopy in compact path lengths. Unlike atomic transitions, molecular rotational transitions form a ladder of nearly equidistant steps in frequency space, offering multiple terahertz-frequency references from a single molecule, which may be advantageous for future wireless communication channels21,22 and their aggregation23. Using these molecular transitions circumvents the need for frequency translation from microwave or optical references, providing a multitude of transition frequencies with varying sensitivities to environmental perturbations. These characteristics enable the practical realization of a high-purity, low-drift terahertz source.
Stabilizing a terahertz source using molecular rotational transitions also represents an important step toward establishing a secondary frequency standard in the terahertz domain. Recent advances in this field have focused on reducing fractional frequency instability24, extending operations to higher frequencies25, and achieving compact form factors26. However, the fundamental stability limits of rotational molecular transitions remain unclear, with the spectral purity of the free-running terahertz source being a key limiting factor (intermodulation limited)27. The DWBL, with its superior spectral purity, offers a solution to these limitations, providing new insights into terahertz stabilization via molecular frequency references.
In this paper, we present an architecture that exploits the spectral purity of the DWBL in the context of molecular rotational spectroscopy. We demonstrate frequency discrimination and feedback, resulting in a stable terahertz wave, and we measure the instability of the radiation produced. Finally, we discuss the remaining stability limitations and prospects for future improvements and applications. Thereby, we have achieved a source simultaneously capable of producing a stable and pure terahertz wave, making substantial progress in the field of terahertz sources.
Results
Phase modulation spectroscopy
To realize frequency discrimination with the rotational state of a molecule, we performed phase modulation spectroscopy. A similar method has previously been described for a different oscillator and molecule24. In this report, we describe the oscillator architecture required to utilize the DWBL as a terahertz source, which is shown schematically in Fig. 1. A complete experimental diagram is also provided in the Supplementary Information (SI) Fig. S1a. The native output of the DWBL was two optical tones at a user-defined frequency difference in a single optical fiber. Since fast phase modulators (bandwidth > 1 kHz) do not yet exist in the terahertz band, a single optical tone was modulated instead (fmod = 2 MHz, see methods for more details). The modulation was inherited by the terahertz wave via photomixing. A dense wavelength division multiplexer (DWDM) was used to separate the two optical tones, one of which went through an electro-optic phase modulator (PM), before being recombined and photomixed by a uni-traveling carrier photodiode (UTC-PD). The other optical tone passed through an acousto-optic modulator (AOM) for fast frequency shifting. This allowed for fine-tuning of the terahertz frequency within a narrow frequency range, limited by the AOM bandwidth ( ±5 MHz). The AOM was also used for frequency stabilization feedback from the frequency discriminator, as discussed in the next section.
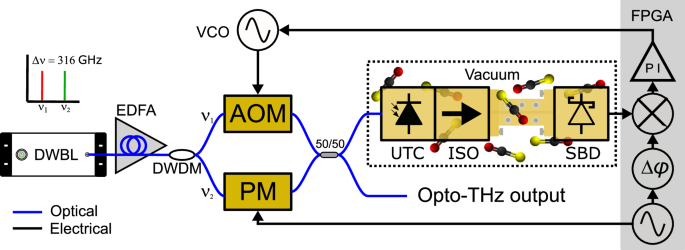
All fiber connections and components are single-mode, polarization maintaining fiber (blue lines). Electrical connections are drawn as solid black arrows. See text for functional details. DWBL dual-wavelength Brillouin laser, EDFA erbium-doped fiber amplifier, DWDM dense wavelength division multiplexer, VCO voltage-controlled oscillator, AOM acousto-optic modulator, PM phase modulator, UTC Uni-traveling-carrier photodiode, ISO waveguide isolator, SBD Schottky barrier diode, FPGA field programmable gate array, PI proportional-integrator filter.
To probe the rotational transitions of the OCS molecule, a compact waveguide spectrometer was built and placed inside a rough vacuum chamber (base pressure ≈ 4 mTorr) pictured in the SI, Fig. S1b. The optically carried terahertz wave, and accompanying modulation, was delivered to the UTC-PD via a vacuum fiber feedthrough. In the vacuum chamber, terahertz radiation (60 μW, see methods for more details) was generated via photomixing of the DWBL by the UTC-PD. The terahertz radiation passed through an isolator, followed by 13 cm of rectangular waveguide, and was detected by a zero-bias Schottky barrier diode (SBD). Similarly, the electrical signal from the SBD was delivered to signal processing electronics via a coaxial (SMA) vacuum electrical feedthrough. We adopted this architecture to minimize terahertz etalons/standing waves and collision-induced broadening from gases at atmospheric pressure.
A small quantity of OCS (70 mTorr) was admitted into the vacuum chamber, and this gas diffused into the terahertz waveguide, where the gas molecules interacted with the terahertz radiation. Specifically, the terahertz wave was tuned to be resonant with the ({J}^{{prime} }=26leftarrow {J}^{{prime}{prime} }=25) transition at ν0 = 316.146 GHz, which is highlighted in Fig. 2a28. Scanning the terahertz frequency detuning around the resonance produced the measured absorption profile shown in Fig. 2b. The pressure broadened profile was Lorentzian with a half-width at half-maximum of Γ ≈ 700 kHz. More details on the absorption measurement are provided in the SI (see Fig. S3).
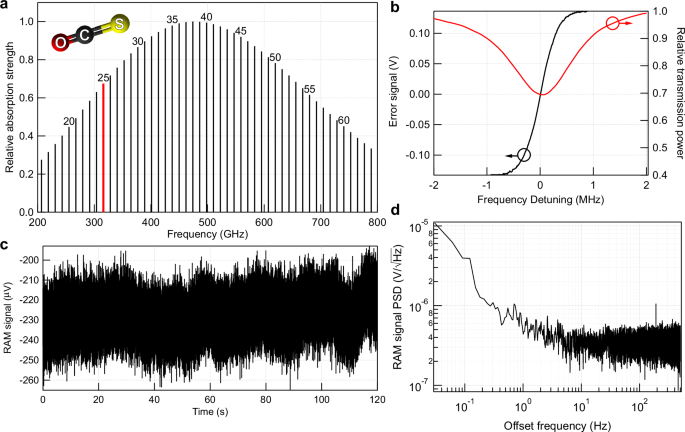
a Plot of rotational transitions at room temperature, normalized to the strongest absorption, as a function of terahertz radiation frequency28. The numbers above the transitions are the lower rotational state quantum number, J. The transition utilized in this experiment is highlighted in red. b Error and transmission signals corresponding to typical experimental conditions. The error signal is the black trace, and its corresponding axis is on the left. The transmission signal is the red trace axis is on the right, normalized to the power detected without gas present, showing a peak absorption strength of 30%. c Time trace of the signal detected without gas. The long-term fluctuations are a direct measurement of the residual amplitude modulation (RAM). d Power spectral density (PSD) of the RAM signal time trace. These data are indicative of the spectrometer noise floor.
The SBD detected amplitude variations atfmod from the dispersion of OCS near resonance. FPGA-based signal processing electronics performed lock-in detection of the dispersion, generating an error signal, and thus achieved phase modulation spectroscopy. A truncated terahertz frequency scan, shown by the black line in Fig. 2b, measured the error signal from the OCS resonance. The error signal, which corresponds to the derivative of the absorption resonance, realized the frequency discrimination needed for frequency stabilization.
The amplitude of the error signal (Vsig = 140 mV) can be compared to the noise in the measurement to determine the signal-to-noise ratio (SNR) of the spectrometer. The noise floor in the experiment was measured by removing the OCS gas and taking a time trace of the error signal. This included noise from all possible sources such as the SBD, signal processing chain, and residual amplitude modulation (RAM)29. The measured trace is shown in Fig. 2c. The longer timescale variations in the error signal were due to fluctuations in the RAM. Although the in-phase component of RAM was actively canceled (see methods), other sources of RAM fluctuations still existed. These are detailed in the discussion section. Converting the RAM signal to a power spectral density (PSD) revealed the white noise limited floor. The PSD corresponding to the RAM trace in Fig. 2c is shown in Fig. 2d. This resulted in a noise PSD of ({V}_{noise}=350,,{mbox{nV}}/sqrt{{mbox{Hz}},}). Combined with the error signal amplitude, we calculated the spectrometer SNR in a fbw = 1 Hz bandwidth with (,{{mbox{SNR}}},equiv 10{log }_{10}left({V}_{sig}/({V}_{noise}sqrt{2{f}_{bw}})right)=55) dB30.
Frequency feedback and metrology
To cancel phase fluctuations and frequency drifts of the DWBL, we fed back the error signal to the VCO driving the AOM (see Fig. 1). Locking was achieved after the error signal was sent through a proportional-integrator (PI) filter with a corner frequency of fc = 3 kHz. Once the DWBL was locked to the rotational transition, the terahertz frequency was stabilized and could be monitored for absolute frequency fluctuations. These fluctuations were used to evaluate the performance of the lock. We relied on an established technique for frequency down-conversion, which utilized an electro-optic (EO) comb, and counted the resultant RF signal that carried the fluctuations of the terahertz wave (see methods for more details)31. Figure 3a shows a comparison of the DWBL terahertz frequency fluctuations between free running and OCS locked states. The overall drift of the DWBL locked to OCS, at time scales greater than a few seconds, was reduced by more than an order of magnitude.
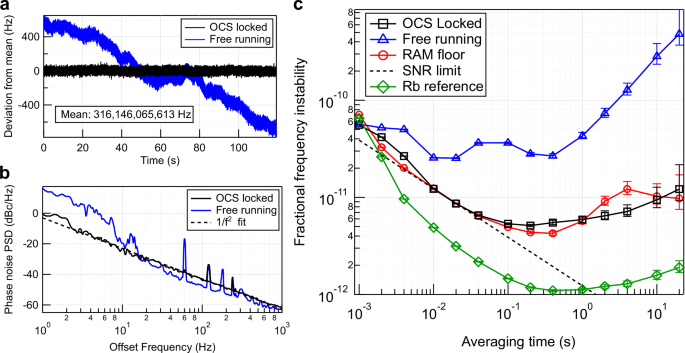
a Time trace of frequency variations around the mean. The black trace is the locked data, while the blue is free running b Phase noise measured below 1 kHz offset frequency. A 1/f2 fit line is shown for reference. c Modified allan deviations of fractional frequency fluctuations for the free-running DWBL (blue triangles) and locked to OCS (black squares) data corresponding to the time traces in a. Also shown are scaled RAM fluctuations (red circles) and SNR limit (black dashed line) described in the text. The measurement floor from our Rb clock is shown for reference (green diamonds). All error bars are 68.3% confidence intervals.
Through the EO comb down-conversion, the source phase noise was also measured. Shown in Fig. 3b, we observed a clear reduction in phase noise at low offset frequency f < 20 Hz. Additionally, the phase noise followed a slope of f−2. This phase noise trend is characteristic of white frequency noise, as expected by an atomic, or in this case molecular, reference9. The PI feedback also added some noise to the free-running DWBL at intermediate f, motivating the choice of a relatively small fc = 3 kHz, so that the phase noise of the DWBL at f > fc was preserved. Fig. S4 in SI shows an extended phase noise plot with measurement noise floor.
To gain more insight into the nature of the long-term drift of the DWBL locked to OCS, we calculated the modified Allan deviation of the fractional frequency deviations (data in Fig. 3a divided by ν0), as shown in Fig. 3c. The modified Allan deviation was chosen over the Allan deviation to remove white phase noise contributions made by the EO-comb down conversion to the frequency measurements and more accurately represent the stability of the terahertz wave, despite being measured optically. The data show that the fractional frequency of the stabilized terahertz oscillator was (1.2times 1{0}^{-12}/sqrt{tau }), where τ is the averaging time in seconds. The trend decreasing with (sqrt{tau }) also revealed the characteristic of white frequency noise, in agreement with the phase noise data.
However, the locked oscillator deviated from the trend after about 50 ms, ultimately reaching a minimum fractional frequency instability of 5 × 10⁻¹². This deviation was not caused by the molecular frequency reference drifting, but rather by RAM. We also calculated the modified Allan deviation, σRAM, of the RAM data (shown in Fig. 2c) and scaled it to a frequency deviation by dividing by the peak slope of the error signal, K = 460 V / GHz (shown in Fig. 2b)32. The considerable overlap between the locked OCS oscillator and the scaled RAM floor suggested that the frequency lock is limited by technical fluctuations in the error signal zero-crossing, which were caused by RAM as opposed to any fundamental physics of the OCS transition.
Discussion
To understand the limits of terahertz oscillator stability that can be achieved with molecular rotational transitions, we consider two possible limits to frequency stabilization. One fundamental limit to the clock instability in the presented architecture is the intermodulation limit arising from the phase noise properties of the terahertz local oscillator (here, the DWBL)18. The intermodulation effect is caused by biasing the free-running phase noise of the local oscillator at even multiples of the modulation frequency. For the DWBL, the limit is estimated to be below (3times 1{0}^{-13}/sqrt{tau }), though this estimate assumes the reference to be operating in the quasistatic regime, (fmod ≪ Γ). Because this inequality is not fulfilled, there is a further reduction in this limit19, though to our knowledge there is no treatment in the literature for the regime relevant for this work. In any case, the intermodulation limit for the DWBL is well below the instability measured in this work. By way of comparison, another candidate terahertz local oscillator is a CMOS multiplier referenced to an electronic signal generator33. However, the intermodulation noise associated with such a reference amounts to (1times 1{0}^{-11}/sqrt{tau }), above the instability demonstrated in this work. Utilizing a microcomb-based oscillator, as was done in our previous work24, leads to an intermodulation limit at a similar level as the CMOS multiplier demonstration.
With the low intermodulation noise associated with the DWBL, the practical limitation to the oscillator’s stability in this study was the spectrometer SNR. We calculated an SNR limit for the fractional frequency26,30, to be (1.2times 1{0}^{-12}/sqrt{tau }). As seen graphically in Fig. 3c, the calculated value agrees within the 68.3% confidence interval of the measured data. This level of instability is comparable to research-grade commercial rubidium atomic clocks over the timescales investigated. Further optimization of the SNR to find the fundamental limit is a challenging engineering task with many interrelated variables. For example, optimal waveguide length must balance molecular absorption strength with waveguide power loss; for pressure and terahertz power, the absorption signal must be balanced with linewidth broadening mechanisms (intensity and collisions). Similarly, the detector introduces another set of parameters that include 1/f noise, shot noise, sensitivity, and dynamic range. Finally, significant improvements may be made through the use of coherent detection in the terahertz34,35.
Despite SNR limitations, the present architecture has achieved an unprecedented level of terahertz fractional frequency stability with molecules at 100 ms averaging time of 5 × 10⁻¹². However, the frequency instability does not average down for very long. Fluctuations in the RAM prevent the oscillator from achieving a lower ultimate instability. As stated in the results section, the RAM floor scales inversely with the max signal slope. This means that a stronger absorber, like hydrogen cyanide (HCN), would allow a lower RAM floor. Similarly, using a higher frequency transition in OCS would do the same, although technical limitations in commercially available components at higher terahertz frequencies may offset such an improvement. At the time of writing, the WR3.4 waveguide components provide the best performance for the highest frequency range (220–330 GHz). Linewidth-narrowing spectroscopic schemes, like saturated absorption (Lamb-dip) spectroscopy, could also improve the relative impact of RAM36,37.
Finding and mitigating the source of the RAM fluctuations is another route to reducing the instability. As described by several prominent studies on RAM38,39,40, there are sources of RAM fluctuations that remain in this experiment. The quadrature component of the RAM error signal was too small to servo and thus was left uncontrolled. Unidentified etalons could have contributed, although optical isolators were employed to prevent this. Non-common fiber between the photodiode for detecting RAM and the UTC-PD may have allowed time-dependent polarization rotations that led to RAM fluctuations (See SI Fig. S1a for complete experimental diagram). Lastly, RAM can mediate the conversion of signal amplitude fluctuations into frequency fluctuations. Thus variations in the terahertz power and gas pressure, which otherwise should not affect the molecular frequency, can cause measured frequency shifts in the presence of a non-zero spectroscopic baseline.
Although our spectrometer was designed for frequency feedback, it was also capable of precision rotational spectroscopy. Here we report the mean transition frequency of ν0 = 316, 146, 065, 613 ±3 Hz with a statistical uncertainty derived from the modified Allan deviation after 120 s of measurement. We stress that we have not made any attempt to quantify systematic shifts in this experiment, which certainly contained an unknown offset. There is a 23 kHz discrepancy with the most accurate value reported thus far, 316, 146, 088, 630 ±740 Hz41. The over 100 times improvement in precision realized in the present architecture underscores the ability of the DWBL and the spectrometer for rotational spectroscopy.
Other systematic shifts would include those from pressure, light (AC stark), and magnetic fields (Zeeman). No self-pressure shift has been experimentally observed for OCS, but an upper bound of 6 kHz/Torr has been established42,43. This amounts to a total shift of 420 Hz at 70 mTorr. Given a typical experimental leak rate of 100 μTorr/min, the largest estimate of fluctuations due to the pressure shift would be at the 1 × 10⁻¹² level at one minute of averaging time. To our knowledge, a light shift also has not been published for rotational transitions in OCS. We provide a calculation of this shift in the methods section, which is about −1.1 Hz/μW in WR3.4 waveguide. This leads to a total shift of −66 Hz, and a 1% power fluctuation would lead to a 2 × 10⁻¹² fractional frequency instability. Magnetic field shifts have been explored in a system similar to ours44. There is no first order shift and the second order shift was calculated to be 20 μHz/Gauss2, which is completely negligible given typical magnetic fields in the lab.
In conclusion, we have developed an architecture for stabilizing a DWBL to a molecular rotational transition. Using phase modulation spectroscopy, we demonstrated that OCS can serve as a highly effective frequency discriminator at 316 GHz. As a result, we have produced the most stable terahertz wave referenced to a molecule to date. Through relatively slow feedback (fc = 3 kHz), the DWBL drift was suppressed to a fractional level of (1.2times 1{0}^{-12}/sqrt{tau }), while preserving unprecedented phase noise above fc.
The impacts of such achievements extend beyond precision rotational spectroscopy. Much like how optical communication systems had once used molecular transitions, such as acetylene or HCN, as frequency references for channel stabilization, this architecture opens the door for similar applications at terahertz frequencies. By leveraging molecular rotational transitions as highly precise frequency references, this technology could be applied to wireless communication systems for channelization and aggregation, enhancing spectral efficiency in the terahertz range. To integrate such a reference into practical systems, the stabilized 316 GHz opto-terahertz signal could be divided down using an electro-optic comb and a frequency synthesis chain to generate a 10 MHz signal. This reference could then drive a microwave synthesizer, which could be upshifted back to the terahertz domain using an electro-optic single sideband modulator on one of the opto-THz output tones. Such an approach would enable molecule-stabilized frequency synthesis between two rotational J states of OCS, offering both the stability and tunability required for radar, spectroscopy, and broadband wireless systems. Furthermore, this architecture establishes the groundwork for a terahertz frequency standard, enabling advancements in precision timekeeping and synchronization. Molecules are especially well-suited for this role due to their reduced sensitivity to temperature fluctuations and magnetic fields compared to atoms, making them ideal for use in demanding conditions45.
The discussion of instability limitations and the potential of this device for precision rotational spectroscopy highlights the need for further investigation into the SNR, which is influenced by molecular selection, experimental conditions, and detector characteristics. Ensuring a stable frequency reference will also require addressing the RAM observed in this work. Potential solutions include narrowing the line width through saturated absorption and integrating the system into a compact form factor to minimize fiber-related RAM contributions. Nevertheless, the results presented here are already comparable to commercially available microwave Rb atomic clocks over the studied timescale, with significant potential for future advancements.
Methods
Modulation frequency
There are many competing interests in choosing a modulation frequency. One consideration is the intermodulation limit. Most photonic oscillators’ phase-noise decreases far from the carrier, so higher modulation frequencies will lead to a lower intermodulation limit. The DWBL’s phase noise prevents this from being a serious consideration in our system. There are also practical considerations about the bandwidth of modulation achievable with a given source and demodulation setup. In our experiment, the bandwidth was limited both by the external PM and FPGA signal processing to <100 MHz. Higher frequencies will likely increase the cost and complexity of the associated detection electronics. From a spectroscopic point of view, the error signal slope does not appreciably change for any modulation frequency above the absorption linewidth (~1 MHz). While steeper slopes can be achieved at lower modulation frequencies and higher modulation depth (wavelength modulation regime) 1/f noise from the SBD also increases. The lowest frequency instability was achieved by balancing a steep error signal slope and low detector noise. 2 MHz modulation frequency is the lowest frequency for which we enter the shot noise limited regime of the SBD and no longer see the added 1/f noise. This threshold frequency would change for different detectors, terahertz powers, and OCS pressures. In principle, higher modulation frequencies can be used to achieve the same result, though we did not explore this experimentally.
Terahertz power determination
The radiated terahertz power was measured by the DC voltage output of the SBD, using the factory calibrated sensitivity. Then, the known losses of the other waveguide components were used to calculate emitted power from the UTC. We cross-checked this with the specified power output of the UTC as a function of photocurrent, as measured by the UTC’s DC bias power supply. These two methods produced a consistent emitted power to within 10%.
RAM measurement and cancellation
We actively mitigated RAM while the source was in continuously locked operation. This presented a challenge, as the optimum method to measure RAM required the OCS to be removed from the spectrometer (as shown in Fig. 2c). Instead, we measured the RAM optically with a photodiode (RAM-PD), via a 99:1 coupler immediately before the UTC-PD. Fig. S1a in the SI shows a complete experimental diagram that includes the RAM feedback loop. Detecting the RAM optically allowed us to employ a strategy similar to that in other RAM cancellation studies32,38. Specifically, an error signal was generated from lock-in detection of the RAM-PD at fmod. This signal was then fed back to the DC phase of the PM. Additionally, the PM was temperature stabilized to minimize quadrature RAM drifts. In total, the RAM in our experiment was on the order of 10−6, in terms of fractional fluctuations. However, the cancellation degraded with time as some form of out-of-loop fluctuations were present in the experiment (see discussion).
EO comb down-conversion
We performed frequency metrology on the terahertz wave indirectly in this study. The optically carried terahertz wave at the output (see Fig. 1) was down-converted into a radio frequency (RF) through an EO comb24,31. Specifically, the pair of optical tones was sent through a series of three phase modulators, driven at fsynth = 10.53 GHz with high power (30 dBm) and adjustable relative phase. When the phases were tuned, over 15 side-bands were generated around each carrier, spaced by fsynth, and optically bridged the gap between the two tones. The EO comb spectrum then passed through an optical bandpass filter tuned to the region in the center of the two tones that contained overlapping sidebands. The filtered spectrum was photodetected where an RF beatnote fbeat was produced. The relationship between the beat note and the terahertz frequency was then given by fTHz = 2Nfsynth ± fbeat, where N = 15 was the number of sidebands from one carrier to the filtered region, and the ambiguous sign was experimentally determined by adjusting fsynth while keeping fTHz fixed. The synthesizer driving the EO comb was locked to a stable Rb reference, thereby removing any potential drifts of the synthesizer from the measurement.
The EO comb also transferred the phase noise of the terahertz wave to the RF via the above relationship, which allowed an RF phase noise analyzer to measure the terahertz phase noise. However, the measured phase noise also includes the synthesizer phase noise, scaled up by a factor of 2N. This prevented the EO comb method from measuring the true phase noise of the DWBL at offset frequencies above 1 kHz. See SI Fig. S4 for more details.
Probe Stark shift
The interrogating terahertz radiation can lead to an ac Stark shift of the energy levels of the rotational states due to off-resonant driving of other transitions in OCS46. For a certain rotational state J in the ground vibrational state of OCS, the frequency shift due to the AC Stark effect can be expressed as,
where α(ν) is the real component of the polarizability at the frequency of oscillation ν, h is Planck’s constant, and E is the electric field amplitude. The polarizability is given by,
where the sum is over all states m with dipole-allowed transitions with J, μm is the transition dipole moment between J and m, and νm is the transition frequency. The total shift then amounts to,
For OCS, the probe Stark shift is dominated by rotational transitions, due to the relatively small detuning between consecutive rotational transitions (≈12 GHz), in comparison to the detunings of vibrational and electronic transitions (>15 THz). For a J + 1 ← J transitions, the dipole moment amounts to ({mu }_{m}^{2}={mu }^{2}frac{J+1}{2J+1}), where μ = 0.715 D is the dipole moment of OCS. Due to the ΔJ = ± 1 selection rule, the lower rotational state J″ = 25 is shifted by the 25 ← 24 transition, and the upper state (J^{prime}=26) is shifted by the 27 ← 26 transition. The probe Stark shift amounts to −0.21 Hz/(W/m2). For 60 μW of radiation in WR-3.4 waveguide, this leads to a shift of −66.4 Hz, or 2.1 × 10⁻¹⁰, at the maximum intensity location within the waveguide.
Reporting summary
Further information on research design is available in the Nature Portfolio Reporting Summary linked to this article.

Responses