Dynamic brain networks in spontaneous gestural communication

Introduction
Gestures are a fascinating puzzle. They are elaborate and secret codes that are written nowhere, known by none, but understood by all1. During interactions, gestures perform many intrapersonal and interpersonal functions. They can enhance cognitive fluency, promote joint attention and foster mutual understanding2. Due to the diversity of functions and forms of gestures, researchers have subdivided them into different categories. Although attempts to classify different kinds of gestures have used varied terminology2,3,4,5, four common types have emerged (Fig. 1): (1) Interactive gestures, which are related to social interaction and information exchange, aim to include the interaction partner in the dialogue and usually contain some form of pointing gesture directed toward the partner. Researchers have found that interactive gestures can help regulate dialogue, enhance comprehension and improve interpersonal relationships6,7. (2) Fluid gestures consist of fluid and repetitive hand movements with no apparent meaning and may facilitate individual cognitive fluency. Previous research has shown that participants making fluid hand movements scored higher on creative problem-solving tasks, cognitive flexibility and the Remote Associates Test8,9. (3) Object gestures relate to a particular object or its manipulation and could help generate alternative uses for the object5. (4) Emotional gestures, which are a more complex type of gesture, refer to using gestures to express personal feelings. Research has found an attentional bias toward angry or insulting gestures, which highlights the significant impact of emotional gestures on perception and cognitive processes10. In general, all of these findings indicate that gestures are building blocks of human interaction and varied gestures can affect cognition in different aspects, which may also shape the efficacy of learning and teaching activities.

Four categories of gestures are presented, with each category illustrated by two representative examples.
However, solving the ‘gesture puzzle’ has its unique difficulties. First, investigating the underlying intra- and inter-brain neural correlates can be quite challenging. Gestures are spontaneous, involving various hand and arm movements and mostly occur in natural social situations. Due to the constraints of applying brain imaging technologies such as functional magnetic resonance imaging (fMRI) and electroencephalography (EEG), researchers often adopt the paradigm that a single subject watches a video about gestures while recording brain activity, which is somewhat different from the real scene. Moreover, gestures are a sophisticated and dynamic system with a high level of temporal variability. Nevertheless, most of the current studies have analysed the brain signals over a period of time to reveal a general pattern, which cannot link the specific behaviour to the corresponding brain activity. In the present study, we used functional near-infra-red spectroscopy (fNIRS)-based hyperscanning technique to track brain activity in each member of a dyad during social communication tasks. During the entire process, participants’ spontaneous gestures were videotaped and classified, and the association between the specific gesture and the instantaneous state of the intra- and inter-brain network was accurately identified using dynamic brain network analysis technology. Accordingly, we aimed to explore the role of different types of gestures in face-to-face social interaction and focused on the refined, dynamic multi-brain networks.
With the flourishing of social neuroscience, previous studies have found that two different mechanisms, mirroring and mentalizing, are associated with gestural communication and social cognition. Mirroring is fast, automatic, and intuitive; it is characterised by imitating others’ actions or understanding their intentions at the subconscious level11. The main circuitry of the mirroring system (also called the action-perception network) includes the inferior frontal gyrus (IFG), the superior temporal gyrus (STG) and the frontoparietal network combining visual, somatosensory, and motor processing. The mentalizing system (consisting of the temporal-parietal junction (TPJ), precuneus and prefrontal cortex (PFC)) is controlled, conscious, reflective, and is generally involved in ‘reading’ other minds and anticipating their future actions. Gestures serve as social cues during communication, and these two systems are essential for interpreting the intent and emotions conveyed by these cues12,13.
During gestural communication, researchers found that both users’ and observers’ brains exhibited comparable activations in various mirroring and mentalizing areas14. Dialogue-related gestures, such as interactive gestures, may require more conscious processing through the mentalizing system, whereas fluid gestures with less explicit meaning could operate on a more automatic level, primarily engaging the mirroring system4,15. Rather than being competitive or exclusive, these mirroring and mentalizing networks work complementarily to process social information and functional connectivity (FC) between these regions continually fluctuates16.
To further understand how these neural networks coordinate between communicators, the concept of inter-subject functional connectivity (ISFC) is also introduced. ISFC is considered an effective neural mark of social interaction. It reflects neural alignment across interacting individuals17. In other words, when individuals model others’ behaviour, share information and cooperate to achieve common goals, ISFC will emerge and their inter-brain network will be more cohesive, more intertwined and more efficient. Previous studies have found that the ISFC between mirroring and mentalizing networks is associated with comprehension of conversations and perspective-taking18,19,20. The stronger the ISFC between communicators, the better the mutual understanding and collaboration.
Gestures, especially dialogue-related gestures such as interactive gestures, are essential in facilitating this neural alignment. For instance, Schippers et al. 21 found that during gestural communication, the observer’s brain activity in the mentalizing system echoes the temporal structure of the user’s brain activity21. However, most current studies used the static approach that averaged ISFC across the task period and did not account for its dynamic, fluctuant nature. Here we used a dynamic approach based on sliding windows and k-means clustering to capture the instantaneous ISFC states during social communication tasks. By employing graph-based analyses on dynamic ISFC (dISFC) states and comparing their link strength with the baseline metrics, we delineated the properties of these dISFC states and elucidated their cognitive implications. Subsequently, through the behaviour locking technique, we associated these dISFC states with specific social behaviours to further unravel the brain-behaviour relationship (Fig. 2).
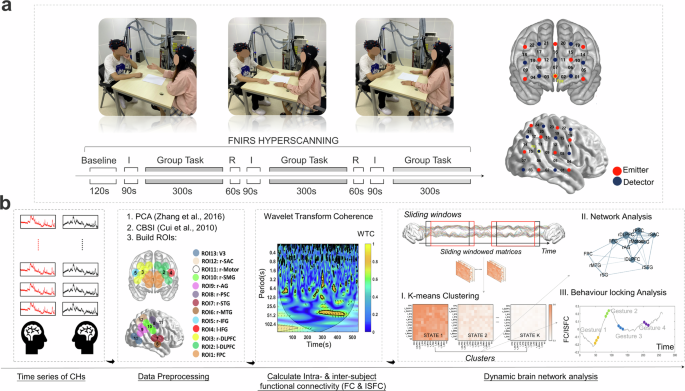
a Experimental setup and optode probe set. ‘R’ means resting station; ‘I’ means instructions for the task. b The procedure of the fNIRS data analysis. ‘CHs’ means the optode channels; ‘PCA’ means the principal component spatial filter algorithm; ‘CBSI’ means the correlation-based signal improvement method; ‘ROIs’ means regions of interest.
Specifically, in this study, fifty-four participants were randomly assigned as 27 dyads to solve realistic presented problems (RPPs) under three Conditions: both using gestures (the ‘BOTH’ condition), only one using gestures (the ‘ONE’ condition) and neither using gestures (the ‘NO’ condition). RPPs are typical open-ended realistic problems and demand multiple cognitive functions such as creativity and social information processing, providing various behavioural indicators22,23. Moreover, considering that turn-taking behaviours can enhance neural alignments between team members, which are associated with improved communication efficiency and task performance24,25, we adopted a turn-taking communication mode in the present study. During the entire procedure, brain activities in each dyad were recorded simultaneously using fNIRS hyperscanning. Participants’ gestures were coded and the corresponding FC and ISFC states were characterised using the dynamic brain network analysis and behaviour locking technique. Based on the above literature, three main hypotheses are raised:
-
(I)
During social communication, a spectrum of brain network states emerges, ranging from highly efficient and superior states to less efficient, inferior states. By comparing the occurrence rates of different types of inter-brain states across experimental conditions, we anticipate that when both participants can use gestures, more superior dISFC states will appear. When neither can use gestures, more inferior dISFC states will be observed. Additionally, the occurrence rate of the superior dISFC states will be positively correlated with task performance.
-
(II)
Under each condition, we compared the occurrence rates of various dISFC states when using different types of gestures. We postulate that even under the same condition, different kinds of gestures will be accompanied by distinct dISFC states. Specifically, interactive gestures will be associated with more superior dISFC states. Furthermore, when employing interactive gestures, the ISFC strength within the mentalizing and mirroring systems will be significantly higher compared with using other kinds of gestures or not using gestures.
-
(III)
For intra-brain networks, we hypothesise that superior dFC states will occur more frequently when both participants can use gestures, and the occurrence rate of superior dFC states will still be positively correlated with task performance. Moreover, considering the role of fluid gestures in enhancing individual cognitive fluency, we anticipate that fluid gestures will be associated with a higher incidence of superior dFC states.
Results
Effects of gestures on communicator behaviour
Participants’ performance in the RPPs was evaluated from four perspectives: fluency, based on the total number of generated ideas; originality, based on the novelty of the ideas; flexibility, based on the number of categories of the ideas; and feasibility, based on the practicality of the ideas. Moreover, we assessed the behavioural index of cooperation (IOC) for each dyad by calculating the number of combined ideas.
One-way repeated measures ANOVA using Condition (‘BOTH’; ‘NO’ vs. ‘ONE’) as the within-subject factor was performed on the RPP fluency, RPP originality, RPP flexibility, RPP feasibility and IOC. All these indices conform to normal distribution except for the IOC, therefore we converted it into sqrt (n) values (i.e. square root calculation). Results demonstrated a significant main effect of Condition on sqrt (IOC), F (2,52) = 7.96, P = 0.001, ηP2 = 0.23; RPP originality, F (2,52) = 25.29, P < 0.001, ηP2 = 0.49; and RPP fluency, F (2,52) = 3.58, P = 0.035, ηP2 = 0.12 (Fig. 3a). Post-hoc tests revealed higher sqrt (IOC) and originality in the ‘BOTH’ condition than in the ‘ONE’ and ‘NO’ conditions (sqrt [IOC]: MBOTH = 0.64, MNO = 0.49, MONE = 0.53; Originality: MBOTH = 3.10, MNO = 2.48, MONE = 2.63), and the fluency score was significantly higher in the ‘ONE’ condition than in the ‘NO’ condition (Fluency: MNO = 17.67, MONE = 20.52). No other significant differences were observed.
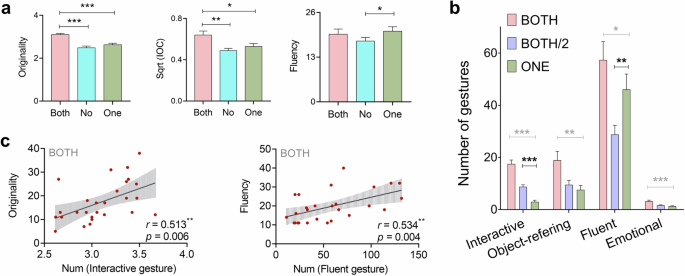
a Effects of gestures on sqrt (IOC), RPP originality and RPP fluency. b The number of different types of gestures in three conditions (i.e. ‘BOTH’, ‘BOTH/2’, and ‘ONE’). Because there were two participants using gestures in the ‘BOTH’ condition and only one in the ‘ONE’ condition, we divided the number of gestures in the ‘BOTH’ condition by two (the ‘BOTH/2’ condition) and compared it with the ‘ONE’ condition. c The positive correlation between the number of interactive gestures and RPP originality under the ‘BOTH’ condition; the positive correlation between the number of fluid gestures and RPP fluency under the ‘BOTH’ condition. *P < 0.05, **P < 0.01, ***P < 0.001.
We classified gestures into four categories based on their functions: interactive, object, fluid and emotional (Methods). We found that under the ‘BOTH’ condition, the number of all types of gestures was significantly greater than that under the ‘ONE’ condition. Because there were two participants using gestures in the ‘BOTH’ condition and only one in the ‘ONE’ condition, we divided the number of gestures in the ‘BOTH’ condition by two (the ‘BOTH/2’ condition) and compared it with the ‘ONE’ condition. One-way repeated measures ANOVA using condition (‘BOTH’; ‘BOTH/2’ vs. ‘ONE’) as the within-subject factor was performed on the number of all types of gestures. Results showed that compared to the ‘BOTH/2’ condition, significantly more fluid gestures were used under the ‘ONE’ condition, while significantly fewer interactive gestures were found (Fig. 3b, Supplementary Table 1 and 2). It seems that, when only one person could gesture, they tended to reduce the use of interactive gestures and compensate by using isolated, fluid gestures. Moreover, Pearson’s correlation showed that the number of interactive gestures was positively correlated with originality and fluency under the ‘BOTH’ condition (Originality: r = 0.513, P = 0.006; Fluency: r = 0.439, P = 0.022; Fig. 3c) and with originality under the ‘ONE’ condition (Originality: r = 0.678, P < 0.001). It also showed that the number of fluid gestures was positively correlated with RPP fluency under the ‘BOTH’ (r = 0.534, P = 0.004; Fig. 3c) and ‘ONE’ conditions (r = 0.687, P < 0.001). No other significant differences were observed.
In addition, to control for potential confounding variables, one-way repeated measures ANOVA using Condition as the within-subject factor was performed on participants’ feelings of depletion, difficulty, and enjoyment, as well as valence and arousal of their emotional states, respectively. No significant difference was observed (Supplementary Table 3). This may indicate that the effects observed in this study were not induced by task differences or extraneous variables such as participants’ emotions.
Effects of gestures on dynamic ISFC (dISFC)
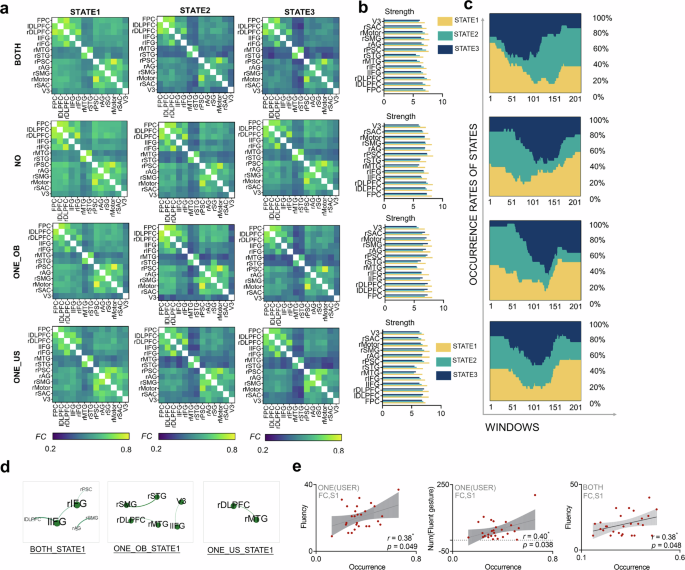
We used wavelet transform coherence (WTC) to calculate the ISFC between all ROI pairings and obtained a 13 × 13 ISFC matrix (13 ROIs in one participant) for each dyad. The dynamic approach based on sliding windows and k-mean clustering was applied to describe the dISFC states (Fig. 2 and Methods). Finally, three representative dISFC states were obtained for each condition (i.e. State 1, State 2 and State 3; Fig. 4a). The properties of these dISFC states were evaluated by the following indices: the brain network parameters (i.e. coefficient [Cp], shortest path length [Lp], global efficiency [globE]) and the ROI strength. Repeated measures ANOVAs using State as the within-subject factor were conducted to assess whether there were significant differences between the properties of these dISFC states. Results showed that under the ‘BOTH’ and ‘ONE’ conditions, State 1 had significantly higher globE, Cp and significantly lower Lp than State 2 and State 3. Under the ‘NO’ condition, State 1 and State 2 had significantly higher globE and significantly lower Lp than State 3 (Table 1). Besides, under all conditions, the ROI strength of State 1 was significantly higher than State 2 and State 3 (Fig. 4b). Moreover, paired-sample t-tests were performed to compare ISFC between the different States and the baseline session, further identifying the ISFC increments under each State. The false discovery rate (FDR) correction across all ROI pairings and validation analysis (Methods) were used for multiple comparisons. Results showed that under the ‘BOTH’ and ‘ONE’ conditions, State 1 had significantly increased ISFC that concentrated in the mirroring and mentalizing systems (e.g. regions such as the rSAC, rSTG, rSMG and rPSC; Fig. 4d), while State 2 and State 3 had no significantly enhanced ISFC. The precise significant connections were displayed in Fig. 4d and Supplementary Table 4. These results may indicate that State 1 is more productive for social communication, while State 3 is less effective.
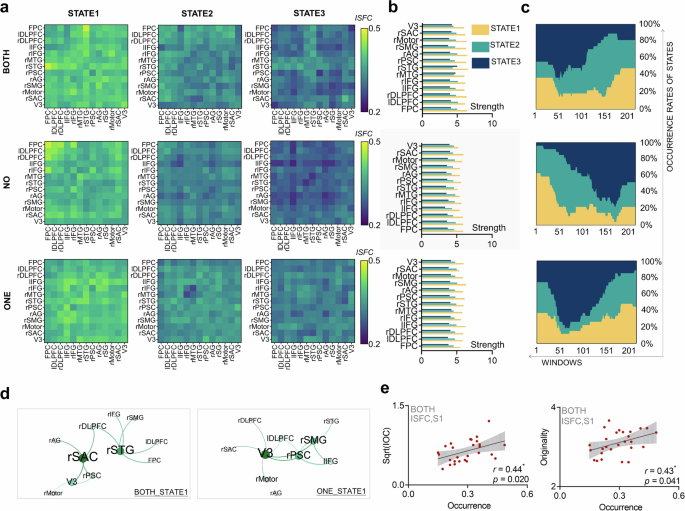
a Three representative dISFC states under each condition. The horizontal and vertical coordinates are ROI 1–13, including frontopolar cortex (FPC), left dorsolateral prefrontal cortex (lDLPFC), right DLPFC (rDLPFC), left inferior frontal gyrus (lIFG), right IFG (rIFG), right middle temporal gyrus (rMTG), right superior temporal gyrus (rSTG), right primary somatosensory cortex (rPSC), right angular gyrus (rAG), right supramarginal gyrus (rSG), right motor cortex (rMotor), right somatosensory association cortex (rSAC), right visual cortex (V3). Colour represents the ISFC value. b The ROI strength of the dISFC states under each condition. Yellow represents State 1; Green represents State 2; Blue represents State 3. c The temporal occurrence patterns of the dISFC states under each condition. The horizontal coordinates are time windows, and the vertical coordinates are occurrence rates. Yellow represents State 1; Green represents State 2; Blue represents State 3. d Significant ISFC increments in different States. The size of the dot represents the number of ISFC in this region, and the thickness of the line represents the ISFC value. e The positive correlation between the occurrence rate of ISFC-State 1 and sqrt (IOC), as well as the RPP originality under the ‘BOTH’ condition. ‘ISFC’ means inter-subject functional connectivity; ‘S1’ means State 1. *P < 0.05, **P < 0.01, ***P < 0.001.
After delineating the characteristics of different states, one-way repeated measures ANOVAs with State (State 1; State 2 vs. State 3) as the within-subjects factor were used to analyse the occurrence rates of states under each condition. Results demonstrated that under the ‘NO’ condition, State 1 occurred significantly less than State 2 and 3 (F (2,52) = 6.97, P = 0.002, ηP2 = 0.21, Ms1 = 0.26, Ms2 = 0.35, Ms3 = 0.39; Fig. 4c); and under the ‘ONE’ condition, State 1 and 2 occurred significantly less than State 3 (F (2,52) = 12.01, P < 0.001, ηP2 = 0.32, Ms1 = 0.29, Ms2 = 0.27, Ms3 = 0.44; Fig. 4c). Pearson’s correlations between the occurrence rates of different dISFC states and the behavioural indices were also calculated. After the validation analysis, results showed that the occurrence rate of State 1 was positively correlated with RPP originality and sqrt (IOC) under the ‘BOTH’ condition (Originality: r = 0.43, P = 0.041; sqrt [IOC]: r = 0.44, P = 0.020; Fig. 4e). No other significant differences were observed.
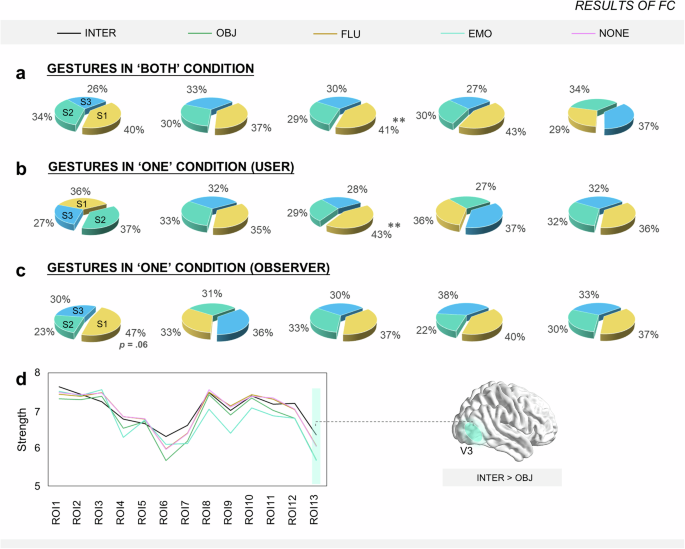
We also conducted the behaviour locking analysis. The time points of the specific gestures were marked and the corresponding dISFC states were gathered to obtain the inter-brain network when using different kinds of gestures and not using gestures (see examples in Supplementary Fig. 1). Repeated measures ANOVA using State as the within-subject factor was employed to assess whether there were significant differences in the occurrence rates of dISFC states among different kinds of gestures. In the ‘BOTH’ condition, results demonstrated that when using interactive gestures, the occurrence rate of State 1 was significantly higher than that of State 2 and 3 (F (2,52) = 40.06, P < 0.001, ηP2 = 0.61, Ms1 = 0.56, Ms2 = 0.26, Ms3 = 0.18; Fig. 5a). In the ‘ONE’ condition, results showed that the occurrence rate of State 3 was significantly higher than that of State 1 and 2 when participants were not using gestures (F (2,52) = 5.00, P = 0.010, ηP2 = 0.16, Ms1 = 0.30, Ms2 = 0.29, Ms3 = 0.41; Fig. 5c). No other significant differences were observed.
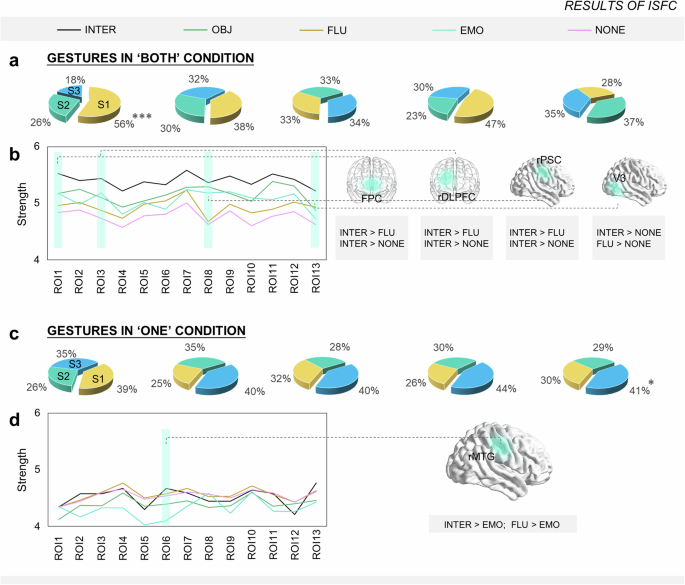
a The occurrence rate of different dISFC states when using different kinds of gestures and not using gestures under the ‘BOTH’ condition. b The ROI strength when using different kinds of gestures and not using gestures under the ‘BOTH’ condition. c The occurrence rate of different dISFC states when using different kinds of gestures and not using gestures under the ‘ONE’ condition. d The ROI strength when using different kinds of gestures and not using gestures under the ‘ONE’ condition. ‘INTER’ means the interactive gestures; ‘OBJ’ means the object gestures; ‘FLU’ means the fluid gestures; ‘EMO’ means the emotional gestures; ‘NONE’ means not using gestures. ‘S1’ means State 1; ‘S2’ means State 2; ‘S3’ means State 3. *P < 0.05, **P < 0.01, ***P < 0.001.
Moreover, under each condition, repeated measures ANOVA with Gestures (interactive, fluid, object, emotional vs. none) as the within-subject factor was used to determine whether there were significant differences in ROI strength of dISFC states across various gesture types. Results showed that, in the ‘BOTH’ condition, when using interactive gestures, participants presented with significantly higher ROI strength in the frontopolar cortex (FPC), right dorsolateral prefrontal cortex (rDLPFC) and rPSC areas compared with using fluid gestures and not using gestures; while in the visual area, participants presented with higher ROI strength when using fluid and interactive gestures than not using gestures (Fig. 5b and Supplementary Table 5, FDR corrected). In the ‘ONE’ condition, participants exhibited significantly higher ROI strength in the right middle temporal gyrus (rMTG) area when using interactive or fluid gestures compared with using emotional gestures (Fig. 5d). Considering the limited number of emotional gestures (M = 1.22), a permutation analysis was conducted. Please see details in Supplementary Results S2.1 and Supplementary Fig. 2.
Effects of gestures on dynamic FC (dFC)
Under the ‘BOTH’ and ‘NO’ conditions, the FC matrices of the participant 1 and 2 were averaged, while under the ‘ONE’ condition, the person who used gestures was called the user, and the person who did not use gestures was called the observer, and the intra-brain matrices of the two were compared separately. After the dynamic brain network analysis, three representative dFC states were obtained for each condition (i.e. ‘BOTH’, ‘NO’, ‘One-user’, ‘ONE-observer’; Fig. 6a). Repeated measures ANOVAs using State as the within-subject factor were performed on the network parameters (Cp, Lp and globE) and ROI strength under each condition. As shown in Table 1 and Fig. 6b, similar patterns were found in all conditions: State 1 had significantly higher globE, Cp and ROI strength as well as significantly lower Lp than State 2 and State 3. No other significant differences were found. Moreover, paired-sample t-tests were performed to compare FC between the different States and the baseline session, further identifying the FC increments under each State. After the FDR correction and validation analysis, the existing significant connections were displayed in Fig. 6d and Supplementary Table 6. Specifically, under the ‘BOTH’ and ‘ONE-observer’ condition, State 1 had significantly increased FC that concentrated in the mirroring and mentalizing systems (e.g. regions such as the rIFG, lIFG, rSTG, rSMG and rDLPFC; Fig. 6d). Under the ‘ONE-user’ condition, significant FC increments were observed only in the mentalizing system (e.g. rSMG and rDLPFC; Fig. 6d). No significant FC increments were observed under the ‘NO’ condition. These results indicated that State 1 had a better-optimised intra-brain network organisation. Moreover, the occurrence rate of State 1 was positively correlated with RPP fluency under the ‘BOTH’ (r = 0.38, P = 0.048) and ‘ONE-user’ condition (r = 0.38, P = 0.049), as well as with the number of fluid gestures (r = 0.40, P = 0.037) under the ‘ONE-user’ condition (Fig. 6e). However, there was no significant difference in the occurrence rates of different states under all conditions.
a Three representative dFC states under each condition. The horizontal and vertical coordinates are ROI 1–13, including frontopolar cortex (FPC), left dorsolateral prefrontal cortex (lDLPFC), right dlPFC (rDLPFC), left inferior frontal gyrus (lIFG), right IFG (rIFG), right middle temporal gyrus (rMTG), right superior temporal gyrus (rSTG), right primary somatosensory cortex (rPSC), right angular gyrus (rAG), right supramarginal gyrus (rSG), right motor cortex (rMotor), right somatosensory association cortex (rSAC), right visual cortex (V3). Colour represents the FC value. b The ROI strength of the dFC states under each condition. Yellow represents State 1; Green represents State 2; Blue represents State 3. c The temporal occurrence patterns of the dFC states under each condition. The horizontal coordinates are time windows, and the vertical coordinates are occurrence rates. Yellow represents State 1; Green represents State 2; Blue represents State 3. d Significant FC increments in different States. The size of the dot represents the number of FC in this region, and the thickness of the line represents the FC value. e The positive correlation between the occurrence rate of FC-State 1 and RPP Fluency, as well as the number of fluid gestures. ‘FC’ means functional connectivity; ‘S1’ means State 1. ‘ONE_OB’ means the observer in the ‘ONE’ condition; ‘ONE_US’ means the user in the ‘ONE’ condition. *P < 0.05, **P < 0.01, ***P < 0.001.
The same behaviour locking analysis was applied to capture the intra-brain network when using different kinds of gestures and not using gestures. Under each condition, repeated measures ANOVA with State as the within-subjects factor was used to assess whether there were significant differences in the occurrence rates of dFC states among different kinds of gestures. In the ‘BOTH’ and ‘ONE-user’ condition, results showed that when using fluid gestures, the occurrence rate of State 1 was significantly higher than that of State 2 and 3 (‘BOTH’: F (2,52) = 5.78, P = 0.005, ηP2 = 0.18, Ms1 = 0.41, Ms2 = 0.29, Ms3 = 0.30, Fig. 7a; ‘ONE-user’: F (2,52) = 5.81, P = 0.005, ηP2 = 0.18, Ms1 = 0.43, Ms2 = 0.29, Ms3 = 0.28, Fig. 7b). In the ‘ONE-observer’ condition, results demonstrated that when users employ interactive gestures, the observer’s intra-brain network presented with marginally significantly more State 1 than State 2 and 3 (F (2,52) = 2.94, P = 0.061, ηP2 = 0.10, Ms1 = 0.47, Ms2 = 0.23, Ms3 = 0.30, Fig. 7c). Moreover, under each condition, repeated measures ANOVA with Gestures (interactive, fluid, object, emotional vs. none) as the within-subject factor was used to determine whether there were significant differences in ROI strength of dFC states across various gesture types. Results showed that under the ‘ONE-observer’ condition, when watching interactive gestures, participants’ ROI strength of the visual cortex was significantly higher when compared with watching object gestures (F (4,104) = 4.86, Pcorr = 0.016, ηP2 = 0.16, Fig. 7d and Supplementary Table 7).
a The occurrence rate of different dFC states when using different kinds of gestures and not using gestures under the ‘BOTH’ condition. b The occurrence rate of the user’s different dFC states when using different kinds of gestures and not using gestures under the ‘ONE’ condition. c The occurrence rate of the observer’s different dFC states when watching different kinds of gestures and not watching gestures under the ‘ONE’ condition. d The ROI strength of the observer when watching different kinds of gestures and not watching gestures under the ‘ONE’ condition. ‘INTER’ means the interactive gestures; ‘OBJ’ means the object gestures; ‘FLU’ means the fluid gestures; ‘EMO’ means the emotional gestures; ‘NONE’ means not using gestures. ‘S1’ means State 1; ‘S2’ means State 2; ‘S3’ means State 3. *P < 0.05, **P < 0.01, ***P < 0.001.
Effects of gestures on static FC and ISFC
We also obtained the static intra- and inter-brain networks by averaging the FC/ISFC across the entire task period. Results showed that the sISFC of FPC-rSTG was significantly higher under the ‘BOTH’ and ‘ONE’ conditions than under the ‘NO’ condition, and the sISFC of rDLPFC-rSTG was significantly higher under the ‘BOTH’ condition than under the ‘ONE’ and ‘NO’ conditions (Supplementary Table 8). However, for the static intra-brain network, no significant differences were found (Supplementary Table 9). Please see more details in the Supplementary Results S2.2 and Supplementary Fig. 3. Gestures are instantaneous, whereas participants performed the communication task over a long period of time. Therefore, roughly averaging the brain activity over the entire task period could not detect the dynamic, subtle changes in the intra-brain network, further proves the necessity of the dynamic analysis method.
Discussion
In the present study, we tracked the brain activity of two communicators during face-to-face social interactions and coded their spontaneous gestures. By using the dynamic brain network analysis and behaviour locking technique, we observed that gestures are associated with enhanced collaboration, optimised multi-brain networks and better team performance. Moreover, different kinds of gestures had distinct cognitive functions and neural signatures. For example, interactive gestures were associated with the joint production of novel ideas and a more cohesive inter-brain network, while fluid gestures correlated with individual cognitive fluency and the emergence of efficient intra-brain states. These findings highlight the roles of different types of gestures and their corresponding inter- and intra-brain neural correlates and suggest a close association between dynamic multi-brain networks and specific social behaviours, offering new insights into the brain-behaviour relationship.
When both participants were able to use gestures, their sqrt (IOC) and RPP originality were significantly higher than when no one or only one could. During interactions, gestures not only help the user retrieve certain words and smooth their expression, but also help the observer characterise and memorise the speech2. For example, previous studies have found that gestures may facilitate verbal improvisation26, and speakers’ gestures may enhance listeners’ comprehension of the message27. In our study, when both participants were able to use gestures, there appeared to be an increase in idea combination, which was associated with improved team originality. Intriguingly, the number of interactive gestures under the ‘BOTH/2’ condition was still significantly greater than that under the ‘ONE’ condition, while the fluid gestures were significantly less. Different types of gestures may serve different purposes. Interactive gestures are associated with the combination of ideas and cooperation, while fluid gestures are linked with individual cognitive fluency. When both participants could use gestures, they tended to include each other in the gesture and cooperate to generate new ideas. When they were the only ones allowed to use gestures, they were more likely to use repetitive, fluid gestures with no obvious meaning, which related to individual mental fluency. This may explain the higher RPP fluency in the ‘ONE’ condition. Pearson’s correlations also showed that, under the ‘BOTH’ and ‘ONE’ conditions, the number of interactive gestures was positively correlated with RPP originality, and the number of fluid gestures was positively correlated with RPP fluency, corroborating our explanation. Future studies could use diverse scenarios to investigate the varied strategies participants utilise for gesturing under different circumstances.
In addition to verifying the diverse functions of gestures in social communication, our study also explored the underlying neural correlates at both inter- and intra-brain levels. Specifically, the instantaneous inter-brain states were characterised using a dynamic approach, and three representative dISFC states were identified under each condition. Results showed that under the ‘BOTH’ condition, State 1 had significantly higher globE, Cp and significantly lower Lp than State 2 and State 3. Under the ‘ONE’ condition, State 1 had significantly higher globE and significantly lower Lp than State 2 and State 3. Under the ‘NO’ condition, State 1 and State 2 had significantly higher globE and significantly lower Lp than State 3. Besides, under all conditions, the ROI strength in State 1 was significantly higher than that in State 3. For the inter-brain network, enhanced Cp, globE and ROI strength, coupled with a diminished Lp might be associated with more direct and rapid information transfer, as well as more effective coordination between brains, which is related to improved collaboration and better teamwork20,28. Results also revealed that under the ‘BOTH’ and ‘ONE’ conditions, State 1 had significantly increased ISFC concentrated in the mirroring and mentalizing areas. Neural alignments within these systems may reflect joint attention and the common perception of social actions17. These results suggest that State 1 might represent an efficient state of information exchange and cognitive alignment among communicators, while State 3 serves as a relatively inefficient state. The observed positive correlations of the occurrence rate of State 1 with both the index of cooperation and team originality also support this point.
After delineating the characteristics of different states, the occurrence rates of distinct states were used to measure the differences between conditions. Results showed that under the ‘NO’ condition, State 1 occurred significantly less than State 2 and 3 and under the ‘ONE’ condition, State 1 and 2 occurred significantly less than State 3. This may indicate the difficulty of entering a productive interactive state without gestures, corroborating our Hypothesis (I). However, under the ‘BOTH’ condition, State 1 did not appear significantly more than other states, suggesting that maintaining effective interpersonal communication can be challenging, even with the aid of gestures.
The behaviour locking analysis further refined the dynamic inter-brain states associated with different kinds of gestures. When both participants could use gestures, results demonstrated that the occurrence rate of State 1 was significantly higher when employing interactive gestures. Additionally, participants exhibited significantly higher ROI strength in the FPC, rDLPFC and rPSC areas when using interactive gestures compared to when using fluid gestures or not using gestures, consistent with our Hypothesis (II). The FPC and rDLPFC are high-order regions in the mentalizing system, which are involved in discerning and anticipating others’ goals and intentions29. Previous studies found that the brain activity of the listener in these prefrontal areas preceded the speaker, and neural alignments in these areas are positively correlated with the listener’s comprehension level19. The rPSC, as part of the mirroring system, is associated with understanding others’ actions and sensations30. Accordingly, the increased strength in these areas might reflect the neural engagement related to understanding others’ actions and intentions. The feature of interactive gestures is to include the partner in the dialogue, which often contains some form of pointing in the partner’s direction, while fluid gestures are repetitive hand movements with no apparent meaning. Therefore, compared with fluid gestures and not using gestures, interactive gestures might play a more important role in exchanging information and cooperation, which are related to more efficient inter-brain networks and increasing strength in these areas. Results also showed that participants presented with higher ROI strength in the visual area when using fluid and interactive gestures compared to when not using gestures, which may be because both fluid and interactive gestures could attract visual attention. Moreover, in the ‘ONE’ condition, when participants did not use gestures, the occurrence rate of State 3 was significantly higher than that of State 1 and 2, which suggests that the absence of gestures is associated with an arising of inefficient inter-brain states. Besides, the rMTG, being part of the mentalizing network, exhibited significantly higher ROI strength when participants were using interactive or fluid gestures compared to emotional gestures. One possible explanation is that emotional gestures might be more complex and difficult to reach a consensus on, which could relate to the observed decrease in the strength of this area. However, given that our study did not discriminate the types of emotions and the degree of arousal, the precise reasons warrant further exploration employing more stringent paradigms and refined categorisations.
The dynamic intra-brain states were also clustered and three representative dFC states were obtained under each condition. Similar patterns were found in all conditions: State 1 had significantly higher globE, Cp and ROI strength as well as significantly lower Lp than State 2 and State 3. For the intra-brain network, these attributes suggest a brain network optimised at both local specialisation and global integration, which are crucial for streamlining information pathways and cognitive processing31,32. Results also demonstrated that under the ‘BOTH’ and ‘ONE-observer’ conditions, State 1 had significantly increased FC that concentrated in the mirroring and mentalizing systems, and under the ‘ONE-user’ condition, significant FC increments were observed in the mentalizing system. In the ‘BOTH’ and ‘ONE-observer’ conditions, participants were engaged in construing both gestures and speech information from partners, while in the ‘ONE-user’ condition, participants were mainly processing speech information. All of these results suggest that State 1 might represent a network organisation optimised for cognitive processing, potentially reflecting a more adaptive and responsive state in the intra-brain network. Moreover, the occurrence rate of State 1 was positively correlated with RPP fluency and the number of fluid gestures, revealing a positive association between fluid gestures and individual cognitive fluency, supporting our Hypothesis (III). However, no significant difference was observed in the occurrence rates of states under all conditions. One possible explanation is that gesture is a transient action, and its influence on individual brain networks throughout the entire task procedure may not be overtly discernible.
The behaviour locking analysis also showed that when using fluid gestures, participants’ intra-brain network exhibited significantly more State 1 than State 2 and 3, suggesting a positive connection between fluid gestures and efficient intra-brain states. Intriguingly, we found that when users employed interactive gestures, the observer’s intra-brain network presented with marginally significantly more State 1 than State 2 and 3 (P = 0.06). This may indicate that interactive gestures are not only associated with inter-brain information transfer but also related to the dynamics of the observer’s intra-brain network.
In summary, this study marked the time points of the spontaneous gestures during real-life social communication and clustered the corresponding inter- and intra-brain states, providing a novel approach to exploring the dynamic neural signatures of various social behaviours. However, there were still several limitations. First, we only focused on several brain regions in the mirroring and mentalizing systems. Future research can expand the coverage of the optode probes to comprehensively investigate the underlying neural correlates. Moreover, for the classification of emotional gestures, we did not discriminate the types of emotions and the degree of arousal, which may lead to deviations between emotional gestures. Future studies can subdivide various kinds of gestures to further explore the distinct cognitive functions of different gestures.
Last but not least, to investigate the influence of gestures on communication, we established two control conditions: only one participant could use gestures (the ‘ONE’ condition), and neither using gestures (the ‘NO’ condition). These conditions are less natural compared to the condition when both participants could use gestures, which could potentially affect participants’ performance and brain network states. The behaviour locking analysis might mitigate this concern. Within the ‘BOTH’ condition, we collected the corresponding brain states during different gestures and non-gesture periods. The cognitive demand was the same throughout this time. Intriguingly, even within the ‘BOTH’ condition, more superior states were observed in inter-brain networks during interactive gestures, and in intra-brain networks during fluid gestures. Furthermore, we examined participants’ emotional valence and arousal, as well as their feelings of depletion, difficulty and enjoyment across all conditions. No significant differences were found. This may indicate that the effects observed in this study were not induced by extraneous variables such as participants’ emotions. However, given our use of the turn-taking mode and specific task demands, it should be cautious when extrapolating these findings to real-life communication. Future studies could use more naturalistic settings.
Methods
Experimental design
This study used a within-subject design. Dyads were asked to solve RPPs under all three Conditions: both using gestures (‘BOTH’), only one using gestures (‘ONE’) and neither using gestures (‘NO’). Different conditions were distinguished through instructions given to the participants. The sequence of each condition was counterbalanced. Please see the specific instructions and experimental manipulation check in the Supplementary Methods S1.1 and S1.2.
Participants
Fifty-four participants with a mean age of 20.6 ± 2.2 years (27 females, 27 males) were randomly assigned as 27 gender-matched dyads (9 female-male, 9 male-male, 9 female-female) to solve RPPs under three conditions: ‘BOTH’, ‘ONE’ and ‘NO.’ Participants were randomly assigned to either position 1 or position 2, with the participant in position 1 being the one to gesture in the ‘ONE’ condition. In the male-female pairs, we also followed this random assignment. Eventually, 56% of the male-female pairs had the female participant as the one gesturing. Participants were recruited by school-wide online advertising. All participants were right-handed and had normal or corrected-to-normal visual acuity. Participants signed informed consent and were each paid ¥45 for their participation. The study procedure was approved by the University Committee on Human Research Protection of East China Normal University (approval number: HR 160-2019). The sample size in the present study is comparable to previous publications19,28. Moreover, to examine the achieved power in this study, a post-hoc analysis using G*power 3.1 was conducted33. The effect size was set to the smallest reported ηP2 = 0.12 in the behavioural results. The calculated power (1-β) was 0.988 which was acceptable. Written informed consent has been obtained for the publication of all images and related materials.
Procedures
Before starting, participants were asked to complete several pre-tests. The experimental procedure consisted of a 2-min resting-state session, three 5-min task sessions and two 1-min rest sessions. During the 2-min resting session, participants were required to relax with their eyes closed. This session served as the baseline. Prior to the task session, the instructions were introduced. During each task session, participants were asked to generate as many solutions as possible to solve the open-ended realistic problem (e.g. ‘As there are fewer and fewer customers, the school cafeteria will close down soon. What can the owner do to make his business better?’)22,23. Participants were required to talk while taking turns, and report only one idea per turn. During their turns, participants were free to make comments and there was no time limit for each individual turn, allowing participants to explain their ideas fully. If they could not think of an idea during their turn, they were allowed to say ‘pass’ and present an idea during the next turn. The number of ‘passes’ was detailed in the Supplementary Methods S1.1. The effects of task sequence were clarified in the Supplementary Results S2.3 and Supplementary Table 10.
Pre- and post-experimental tests
After each task, participants completed the self-assessment manikin scale34 to measure the valence and arousal of their emotional states. The feelings of depletion, difficulty and enjoyment when performing each task were also rated on scales ranging from 1 (‘not at all’) to 5 (‘very much’).
Behavioural assessments
Participants’ performance on the RPP was measured from four dimensions: fluency, flexibility, originality and feasibility23,24. The fluency score was the total number of ideas. The flexibility score was assessed based on the number of categories of ideas. To offset the impact of fluency on flexibility, the final flexibility score was the number of categories divided by the fluency score. Two trained raters independently coded the flexibility scores for each participant. The inter-rater agreement was satisfactory (internal consistency coefficient [ICC] = 0.83, calculated as Cronbach’s α). The final flexibility score of each participant was the average ratings of the two raters. The originality/feasibility score was assessed using a subjective method. Three trained raters independently assessed the originality/feasibility of each idea on a 5-point Likert scale (1 = not original/feasible at all, 5 = highly original/feasible). The inter-rater agreement of this method was satisfactory (for originality, ICC = 0.81; for feasibility, ICC = 0.70). The score of each idea was obtained by averaging the ratings of the three raters. The final originality/feasibility score of each participant was obtained by averaging the scores of all responses from that participant, and the score of each dyad was the average score of the two members.
The index of cooperation (IOC) was calculated based on the convergence of the ideas, which reflects the perspective-taking behaviours35. The ideas reported by each dyad were listed in chronological order. If one participant reported an idea that belongs to a similar category as the previous one from the other participant, it scored ‘1’. The total number of ideas scored ‘1’ was defined as the ‘converge’, and the IOC for each dyad was calculated using the following equation: IOC = converge/(group fluency—converge). In this regard, this index reflects the level of idea combination and cooperation.
Moreover, the participants’ gestures were videotaped and coded during the entire process. According to previous studies2,5, gestures were divided into four categories based on their functions: (1) Interactive gestures aim to engage the interaction partner in conversation and involve pointing gestures in the partner’s direction (e.g. pointing at someone to indicate that it is their turn to speak). (2) Fluid gestures are repetitive hand movements with no apparent meaning. Specifically, fluid hand movements that are repeated more than three times in a row and have no apparent meaning are considered fluid gestures (e.g. continually tapping the table with the index finger). (3) Object gestures relate to specific objects or their manipulation (e.g. flipping the hands like turning the pages of a book when referring to reading). (4) Emotional gestures are gestures used to express personal feelings (e.g. clenching nervously). Two trained raters counted participants’ gestures of each category based on the recording videos. The inter-rater agreement of this method was satisfactory (interactive gestures: ICC = 0.82; object gestures: ICC = 0.75; fluid gestures: ICC = 0.78; emotional gestures: ICC = 0.71). The final scores were computed by averaging the ratings of the two raters.
fNIRS data acquisition and pre-processing
An ETG-7100 NIRS system (Hitachi Medical Corporation) was used to record the oxyhaemoglobin (HbO) and deoxyhaemoglobin (HbR) concentrations of each dyad. Based on the abovementioned literature suggesting the important role of the mirroring and mentalizing systems in social communication, the optode probe sets were placed on each participant’s PFC (3*5 optode probe set; 22 measurement channels) and right temporal-parietal-occipital (r-TPO) areas (4*4 optode probe set; 24 measurement channels). The registration of the probe sets was based on the 10–20 system. Channel locations were further determined using a 3D-digitiser and subsequently transformed into Montreal Neurological Institute (MNI) coordinates36. Then the MNI coordinates of each fNIRS channel were mapped onto the corresponding regions using the Automatic Anatomical Labelling (AAL) atlas. Specifically, each channel was automatically allocated to the closest AAL region based on its MNI coordinates, and channels within the same AAL region were grouped to create Regions of Interest (ROIs). The MNI coordinates of the optode channels in a normal participant are presented in Supplementary Table 11. Eventually 13 ROIs are created, including frontopolar cortex (FPC), left dorsolateral prefrontal cortex (lDLPFC), right dlPFC (rDLPFC), left inferior frontal gyrus (lIFG), right IFG (rIFG), right middle temporal gyrus (rMTG), right superior temporal gyrus (rSTG), right primary somatosensory cortex (rPSC), right angular gyrus (rAG), right supramarginal gyrus (rSMG), right motor cortex (rMotor), right somatosensory association cortex (rSAC), right visual cortex (V3). Among these, the rIFG, lIFG, rSTG, rPSC, rMotor, rSAC and V3 belong to the mirroring system; while the FPC, lDLPFC, rDLPFC, rMTG, rAG and rSMG belong to the mentalising system. See details in Fig. 2.
Prior to establishing the ROIs, several pre-processing steps were conducted to reduce noise. First, we plotted the time courses of all channels. Two raters worked together to visually check the plots and excluded channels that exhibited obvious noise (for example, the variances of noisy channels ranged from 10 to 30, while the variances of normal channels ranged from 0.5 to 0.8). The noisy channels were replaced with data from neighbouring channels within the same ROI37. On average, each participant had 2.3 noisy channels. Because the noisy channels varied across participants, we did not universally exclude any specific channels. Subsequently, a principal component spatial filter algorithm was used to remove the effects of systemic components, such as blood pressure, respiratory variation and blood flow variation38. Moreover, a correlation-based signal improvement method was utilised to remove motion artefacts39. To collect data within the steady period, the data in the initial and final 30-s periods of each condition were removed, leaving 240 s of data for each task session. Previous studies found that the HbO signal is more sensitive to changes in cerebral blood flow than the HbR signal, therefore we mainly focused on the HbO signal for further analysis40,41.
fNIRS data analysis
The fNIRS data analysis mainly includes two components: (1) intra- and inter-subject functional connectivity (i.e. FC and ISFC) computation, (2) dynamic brain network analysis.
Wavelet transform coherence (WTC) was used to calculate the FC and ISFC. WTC is a method that measures the cross-correlation between two HbO time series across both frequency and time domains. This technique allows us to capture how the relationship between brain regions changes over different frequencies and time periods, providing a detailed understanding of neural connectivity42,43. Fisher’s r-to-z transformation was applied to the WTC values before further analysis to increase normality of the distribution. We calculated the FC and ISFC of all ROI combinations (i.e. 13 × 13 intra-subject FC matrices for each participant, 13 × 13 inter-subject FC matrices for each dyad). For the inter-brain network, the ISFC values between the same ROI pairings were averaged. For the intra-brain network, the FC matrices of the participant 1 and 2 were averaged under the ‘BOTH’ and ‘NO’ conditions, while under the ‘ONE’ condition, the person who used gestures was called the user and the person who did not use gestures was called the observer, and the intra-brain matrices of the two were calculated separately.
To determine the frequency band of interest (FOI), the following procedures were performed: first, data below 0.01 Hz were excluded to avoid low-frequency fluctuations, and data above 0.7 Hz were also excluded to ensure that high-frequency noise such as cardiac activity (0.8–2.5 Hz) was eliminated44. Therefore, the full frequency range is 0.01–0.7 Hz. Second, to avoid bias, the FC/ISFC were averaged across different conditions (i.e. for ISFC: ‘BOTH’, ‘NO’ and ‘ONE’ conditions; for FC: ‘BOTH’, ‘NO’, ‘ONE-user’ and ‘ONE-observer’ conditions) before conducting the following t-tests45. Subsequently, paired sample t-tests were performed to compare ISFC between the task session and baseline session for each ROI combination along the full frequency range to identify the FOI. This process was repeated for FC, comparing the task session against the baseline session. After the false discovery rate (FDR) correction, significant P-values (Pcorr < 0.05) were observed at frequencies between 0.034 Hz and 0.045 Hz (corresponding to the period between 22.2 and 29.7 s) for both FC and ISFC. These results indicated that in this frequency band, both FC and ISFC of the task session were significantly higher than that of the baseline session. Additionally, to investigate if a specific condition extremely influences the determination of the FOI, paired sample t-tests were performed to compare FC/ISFC between the task session and rest session under each condition (see details in the Supplementary Methods S1.3). After the FDR correction, the FOIs for each condition are detailed in Supplementary Table 12 and visually represented in Supplementary Fig. 4. According to these results, the selected FOI almost incorporated significant frequency bands in all conditions. Therefore, this band was identified as the FOI, and the FC and ISFC within the FOI were averaged for further analyses.
The dynamic approach based on sliding windows and k-means clustering was applied to characterise the FC and ISFC states under each condition. First, sliding windows were used to segment the FC and ISFC data. The window size was set to 26 s (according to the FOI) and moved in an increment of 1 s throughout the task, and the FC/ISFC values were then averaged within each time window, resulting in a series of FC/ISFC matrices. Then we averaged these FC/ISFC matrices across groups and applied a k-means clustering algorithm in MATLAB to capture the representative FC/ISFC states (i.e. clusters). K-means clustering is a method that groups data into a specified number of clusters based on their features. It is particularly useful for identifying patterns in large datasets by organising similar matrices together. This technique helps to reveal the underlying structure of the data, allowing us to understand different states of brain networks. Specifically, the Manhattan distance was used to calculate the similarity between the windowed FC/ISFC matrices46, and the number of clusters was identified based on the elbow criterion of the cluster validity index. The elbow criterion is a widely-used technique in cluster analysis for determining the optimal number of clusters (k) in a dataset28,47,48. Specifically, the cluster cost was computed as the ratio of within-cluster distance to between-cluster distance for a range of k values (i.e. 1–15). These computed costs were then graphically represented as a function of cluster number (Supplementary Fig. 5). This strategy aims to minimise the within-cluster distance and maximise the between-cluster distance, while controlling the number of clusters. The appropriate k value was selected at the elbow of the curve, thereby achieving a balanced trade-off between cluster cost and the number of clusters. In this study, we chose k = 3 as the appropriate k value, and after iterating 1000 times to avoid accidental results, the cluster centroids (i.e. representative FC/ISFC states: State 1, State 2 and State 3) were obtained. These cluster centroids derived from the group-averaged FC/ISFC matrices were then used as the initial centroids for the cluster analysis of the single dyad to obtain the dynamic FC and ISFC (dFC & dISFC) states of each dyad.
The dFC and dISFC states were further evaluated by graph-based network analysis49. The ROIs were treated as the nodes of the brain network and the functional connections between any two of them were the edges. To exclude the effects of spurious correlations, a sparsity threshold was utilised to ensure that only the highest correlations remained. The sparsity threshold was the ratio of the number of existing edges divided by the maximum possible number of edges in a network. Specifically, we thresholded each FC/ISFC matrix multiple times over a wide range (0.2 < sparsity < 0.5; interval = 0.01) to obtain the weighted networks. Finally, brain network parameters, including cluster coefficient (Cp), shortest path length (Lp), and global efficiency (globE), were calculated using GRETNA in MATLAB50. Cp represents the extent of local interconnectivity or cliquishness in a network. A higher Cp in brain networks often suggests more efficient information transfer among neighbouring brain regions51. Lp is a harmonic mean length between all pairs of nodes and indicates the average shortest number of edges that must be traversed from one node to another in the network. A shorter Lp in brain networks indicates more direct pathways for information transfer across distant brain regions, which are associated with higher cognitive performance in tasks involving working memory and attention52. globE assesses the efficiency and vitality of information transmission over the entire network. Higher globE suggests that the brain network can process information more parallelly and rapidly, leading to more efficient cognitive processing. It can be associated with better performance on tasks that require integration of information from different brain regions50. A large number of studies have shown that higher Cp, globE and shorter Lp in the intra-brain network are associated with faster idea generation and information integration, promoting the ability to combine disparate ideas into novel constructions and for the inter-brain network, they are related to more efficient interpersonal communication and better teamwork20,31,32,53. Therefore, we selected these three classical indicators to measure the participants’ brain network states during the task.
Moreover, we also calculated the ROI strength of each dFC/dISFC state. The strength of a ROI is defined as the sum of all FC/ISFC connected to this ROI, which indicates its involvement or importance in the network49. It quantifies how much this particular ROI is involved in intra- or inter-brain connectivity. If an ROI has a high ‘strength’, it suggests that this region is highly synchronising with other regions.
Statistical analysis
For behavioural data, one-way repeated measures ANOVA using Condition (‘BOTH’; ‘NO’ vs. ‘ONE’) as the within-subject factor was performed on IOC, RPP fluency, RPP originality and RPP flexibility. Moreover, in order to examine the variation of gestures under different conditions, we also conducted an exploratory analysis. Because there were two participants using gestures in the ‘BOTH’ condition and only one in the ‘ONE’ condition, we divided the number of gestures in the ‘BOTH’ condition by two (the ‘BOTH/2’ condition) and compared it with the ‘ONE’ condition. One-way repeated measures ANOVA using condition (‘BOTH’; ‘BOTH/2’ vs. ‘ONE’) as the within-subject factor was performed on the number of all types of gestures. Post-hoc Bonferroni correction was used to account for multiple comparisons.
For fNIRS data, the dFC/dISFC states were discriminated by the network parameters (Cp, Lp and globE), ROI strength and the FC/ISFC increments. Repeated measures ANOVAs using State (State 1; State 2 vs. State 3) as the within-subject factor were performed under each condition on the network parameters (Cp, Lp and globE) and ROI strength. Moreover, paired-sample t-tests were performed to compare FC/ISFC between the different States and the baseline session, further identifying the FC/ISFC increments under each State. After delineating the characteristics of different states, the occurrence rates of distinct states were used to measure the difference between conditions. Specifically, One-way repeated measures ANOVAs with State (State 1; State 2 vs. State 3) as the within-subjects factor were used to analyse the occurrence rate of each State under various conditions. The FDR correction, post-hoc Bonferroni correction and validation analyses (see details below) were used to avoid false discoveries.
In addition, we also conducted the behaviour locking analysis (Fig. 2b). The time points of the specific gestures were marked and the correspondence dFC/dISFC states were gathered to obtain the brain network when using different kinds of gestures and not using gestures. Repeated measures ANOVA using State (State 1, State 2 vs. State 3) as the within-subject factor was employed to assess whether there were significant differences in the occurrence rates of states among different kinds of gestures. Moreover, we also computed the ROI strength for different kinds of gestures. Repeated measures ANOVA with Gestures (interactive, fluid, object, emotional vs. none) as the within-subject factor was used to determine whether there were significant differences in ROI strength across various gesture types. The FDR correction and post-hoc Bonferroni correction were used. Besides, the brain network parameters of different kinds of gestures were also calculated as an additional exploratory analysis (please see details in the Supplementary Results S2.4 and Supplementary Table 13).
Pearson’s correlations between the occurrence rates of different dFC/dISFC states and the behavioural indices (the IOC/fluency/originality/flexibility scores and number of different gestures) were calculated to reveal the brain-behaviour relationship. Validation analyses (see details below) were used to avoid false discoveries.
Validation analysis
For ISFC, we constructed reshuffled dyads by rearranging individuals from real dyads under the same condition. All analyses were applied to the reshuffled data in the same manner as to the real data. Specifically, we calculated the dISFC matrices of the 27 reshuffled dyads (the same sample size as the real group) and obtained 3 representative dISFC states (the same number of cluster centroids as the real group) using dynamic brain network analysis. Then the occurrence rate of each dISFC state was calculated. This permutation process was repeated 400 times. Since it was difficult to calculate the IOC scores of reshuffled dyads, we only calculated the RPP originality, RPP fluency and the occurrence rate of each dISFC state. The originality/fluency score of the reshuffled dyads was the average score of the two individuals. Different from the real condition, over 95% of the reshuffled groups showed no significant correlations between RPP originality/fluency and the occurrence rate of any dISFC states, and the observed ISFC increments of the real data were in the top 5% of the permutation distribution. Besides, for the sISFC results, the static analysis approach was also applied to the reshuffled data in the same manner as for the empirical data. This permutation process was repeated 1000 times, and the observed effects of the real data were also in the top 5% of the permutation distribution.
For FC, the permuted data were constructed using circular shifts (preserving the temporally autocorrelated structure of the data)54. All analyses were applied to the time-shifted data in the same manner as to the real data. This permutation process was repeated 400 times under each Condition. Different from the real condition, over 95% of the time-shifted groups showed no significant correlations between the behavioural indices and the occurrence rate of any dFC states, and the observed FC increments of the real data were in the top 5% of the permutation distribution.


Responses