Dynamic flood adaptation pathways for Shanghai under deep uncertainty

Introduction
Flooding is one of the most devastating natural hazards, causing billions of dollars in damages each year1,2,3. Flood risks are expected to increase due to sea level rise, enhanced storminess, and socio-economic development, particularly in coastal megacities4,5,6,7,8. According to Tiggeloven et al.9, the estimated expected annual damage of coastal floods may increase 150-fold globally between 2010 and 2080, if no adaptation is implemented. Around three-quarters of countries have adaptation plans in place, but the financing and implementation progress is hampered by future uncertainties in climate- and socio-economic projections10. To support adaptation investments, rigorous methods should be employed that take into account future changes in flood risk and address the dynamics of designing climate adaptation strategies11.
There is no doubt that flood adaptation measures can reduce flood risk in coastal megacities in a changing environment12,13,14,15,16,17,18,19,20. However, designing and investing in long-term adaptation strategies is a complex and challenging process for policymakers as there are deep uncertainties regarding relevant future changes and developments. Deep uncertainty can be defined as the gap between existing knowledge and the knowledge needed for decision-makers to make optimal policy choices11,21. In the context of coastal adaptation, deep uncertainty primarily originates from: uncertainty in projections of sea level rise13; uncertainty in future socio-economic developments (population growth), which affects the exposure to flooding of people and assets4; uncertainty in the views and preferences of decision-makers. Not addressing these uncertainties in adaptation decisions may result in inefficient decisions or maladaptation22. Instead, adaptation plans need to be dynamic and flexible, so they can be adjusted over time23,24, addressing the full consideration of the sources of deep uncertainty23,25,26,27.
To support robust decision-making under deep uncertainty (DMDU), several tools have been created26,28,29. Dynamic adaptive policy pathways (DAPP) are often applied as they allow exploring multiple sequences of adaptation measures (i.e., ‘adaptation pathways’) assuming different future projections (e.g. refs. 26,30,31). DAPP has been used within the TE2100 project for the Thames River estuary in the UK22,32, a study in New Zealand on flood risk management in the Hutt River33, a study for reducing future coastal risk in New York City34, and research on long-term flood risk adaptation and decision-making in Shanghai21,35. However, while the first study did not yet consider the floodproofing of buildings or nature-based solutions the latter study did not address compound flooding. Furthermore, the existing studies for Shanghai applied a relatively simple CBA method to evaluate pathways. Several studies show how to apply CBA for robust decision-making under uncertainty, including methods to assess efficiency and robustness optimization30,35,36,37. Furthermore, if uncertainty about future outcomes is expected to decrease, then CBA should allow to evaluate delaying adaptation investments or partially investing now and retaining the option of investment in the future may14.
To address the research gaps, we present a methodological framework that combines DAPP with an advanced form of cost–benefit analyses (CBA), allowing for studying the flexibility of adaptation over time. Our study analyzes a broad range of adaptation options such as green roofs, drainage systems, seawalls, and coastal wetlands. The current master plan of Shanghai (2017–2035) states that the city should upgrade its hard flood protection system (i.e., floodwalls, sea dikes, and barriers) to ensure flood adaptation to future sea level rise. To further expand on this plan, we formulate hybrid pathways, mixing different measures over time. When evaluating these pathways, we analyze the direct- and indirect losses of assets and potential casualties of the exposed people, design comprehensive adaptation strategies under compound flooding (coastal, fluvial, pluvial), and combine the latest urban planning policies for the first time to comprehensively design possible adaptation strategies. We evaluate the economic performance of adaptation pathways on their flexibility and robustness using different economic objectives (risk reduction maximization, cost minimization, maximizing net present value, etc.). Our framework is transferable to other cities in other regions. The framework contributes to the ongoing public and policy debate on the potential for adaptation, by allowing more realistic and transparent estimation of the costs and benefits and also by enabling robust decision-making for flood-prone coastal cities.
Results
Flood risk assuming no additional adaptation
FloodMap-HydroInundation 2D model is conducted to produce compound flood hazard maps (pluvial, fluvial, and coastal floods) for three return periods, namely, 10, 100, and 1000 years under the worst-case emission scenario RCP8.5 (Supplementary Fig. 1) and the low emission scenario RCP2.6 (Supplementary Fig. 2). For the current 1/10-year and 1/1000-year flood simulations, 6–30% (or 394–1012 km2) of Shanghai is flooded by ≥0.25 m of water, causing significant flooding into the urban center (Fig. 1a). Under the RCP8.5 scenario, a 1/100-year flood is simulated to inundate 17% of Shanghai with ≥0.25 m water in 2030, 19% in 2050 and 44% in 2100. A 1/1000-year flood is predicted to inundate 37% of Shanghai with ≥0.25 m water in 2030, 43% in 2050, and 69% in 2100 (Fig. 1a). This is mainly concentrated along the Huangpu River, low-lying areas in the west, and the estuary islands. Under the RCP2.6 scenario, a 1/1000-year flood is simulated to inundate 36% of Shanghai with ≥0.25 m water in 2030, 41% in 2050, and 62% in 2100. The 1/100-year flood is simulated to inundate 16% of Shanghai with ≥0.25 m water in 2030, 18% in 2050, and 29% in 2100 (Supplementary Fig. 2).

Inundation maps for the 1/10-year and 1/1000-year floods in 2020 and 2100 under the worst-case emission scenario RCP8.5 (a). Future adaptation strategies considered in this study: “hard” conservation strategies and “soft” strategies (b).
Results show that the 1/10-year event in 2020 caused only minor flooding in central Shanghai. This result points to the relatively high drainage capacity of central Shanghai. The 1/100-year flood may cause inundation of the coastal lowlands of Baoshan and the southwest of the estuary islands with lower embankments. In addition, some extremely low floodwall sections along the Huangpu River may experience minor flooding. The scope and depth of the 1/1000-year flood will be larger and deeper than that of the 1/100-year flood, which will affect densely populated areas and many important economic function areas. The flood inundation range of estuary islands, the upstream reach, and the right bank of the Huangpu River, with additional failures scattered throughout the middle reach. Compared with the research of Shan et al.16 and Yin et al.38, the flood simulated in this study shows greater inundation. This is due to the fact that when modeling floods, we updated the drainage capacity data to 2020, while Shan et al.16 and Yin et al.38 were to 2010. In addition, the temporal changes in rainfall are taken into account, and precipitation information is used as an external driving force of pluvial flooding.
EAD and EAC reduction by adaptation strategies
Expected annual damage (EAD) and expected annual casualties (EAC) were calculated by integrating the economic losses and human casualties across three return periods (1/10-year, 1/100-year, and 1/1000-year). Shanghai’s current EAD is US$ 2.8 billion/year, accounting for 0.5% of GDP in 2020. Shanghai will suffer increasing future flooding impacts in the absence of additional adaptation. Even for RCP2.6, Shanghai’s EAD may reach 3.8 US$ billion/year in 2030, US$ 4.1 billion/year in 2050, and US$ 5.3 billion/year in 2100. Under RCP8.5, Shanghai’s EAD in 2030, 2050, and 2100 may reach 4.0, 4.3, and US$ 7.6 billion/year, respectively. Under current conditions, the EAC is 6 casualties/year. Under the RCP2.6 scenario, the simulated EAC increases by a factor of 2 by 2050 and of 35 by 2100 compared with the current condition due to the combined influence of sea level rise, land subsidence, and population growth. Particularly, the EAC is projected to reach 8.8 casualties/year in 2050 and 579.6 casualties/year in 2100 under the RCP8.5 scenario. The potential casualties in 2100 will be 97 times higher than the current situation.
All adaptation measures (Table 1) can effectively reduce the future EAD—with storage tanks and storm surge barriers being the most effective ones. Figure 2 shows the performance of adaptation strategies in terms of benefits, costs, and flood risk (i.e., EAD) under the RCP8.5 and RCP2.6 scenarios. Under the two emission scenarios, a storm-surge barrier in the urban planning enhancement strategy I (UPE-I) in 2100 (Table 1) can significantly reduce the EAD from US$ 5.28–7.57 billion/year to US$ 1.50–1.98 billion/year in 2100, if implemented from 2020 to 2100 (Fig. 2 and Supplementary Fig. 3). Storage tank measures can reduce the EAD to US$ 2.20–3.08 billion/year in 2100. Among the three measures in the building code, dry-floodproofing is significant in reducing EAD, and can reduce the EAD to US$ 1.93–2.54 billlion/year in 2100. Coastal wetlands can reduce EAD to US$ 3.49–4.27 billlion/year in 2100. Hybrid Strategy 1, Hybrid Strategy 7, and Hybrid Strategy 10 can significantly reduce EAD in 2100 to US$ 1.34–1.71 billlion/year; US$ 1.17–1.51 billlion/year; US$ 1.10–1.54 billlion/year, respectively.
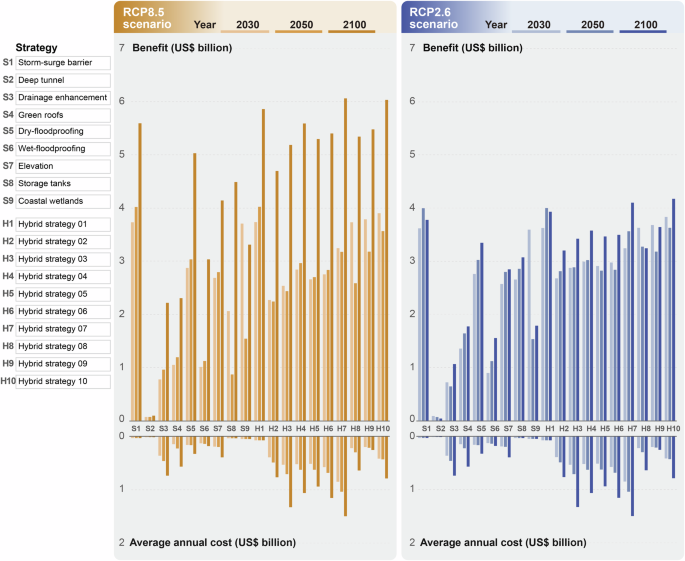
On the right side of each panel is the ranking of the measures after the benefits they yield.
All strategies lead to a reduction in EAC. Under the two emission scenarios, the effect is similar to that seen for EAD, a storm-surge barrier, coastal wetlands, dry-floodproofing, and storage tanks have significant effects on reducing EAC (Supplementary Fig. 3). The storm-surge barrier can reduce the EAC in 2100 from 264.9 to 579.0 to 7.2–34.9 casualties/year. Dry-floodproofing can reduce the EAC to 115.8–301.6 casualties/year in 2100. Storage tank measures can reduce the EAC in 2100 to 147.8–372.6 casualties/year. As far as hybrid strategies are concerned, hybrid strategies 1, 7, and 10 reduce EAC most relative to other hybrid strategies. Hybrid Strategy 1 can reduce the number of casualties in 2100 to 6.50–33.2 casualties/year; Hybrid Strategy 7 can reduce the number of casualties in 2100 to 23.80–42.0 casualties/year.
Benefits of dynamic adaptation pathways
Under the two emission scenarios, we quantify the net present value (NPV) and benefit–cost ratio (BCR) of adaptation measures by implementing adaptation measures and using different discount rates based on scenario-based CBA-I (Fig. 3, Supplementary Figs. 4–7). The cumulative NPV and BCR of the single strategies and hybrid strategies with discount rates of 6% under the RCP8.5 scenario are shown in Fig. 3. Among the three hard strategies (storm-surge barrier, deep tunnel, and storage tanks), the storm-surge barrier strategy has better performance in terms of both the NPV and the BCR. Among the soft strategies, among the adaptation strategies based on building codes (dry-floodproofing, wet-floodproofing, and elevation), the dry-floodproofing measure has the highest NPV and BCR. Under the RCP8.5 scenario, at 4%, 6%, and 8% discount rates, the NPV of dry-floodproofing are US$ 25.52–139.96 billion, US$ 24.81–99.76 billion, US$ 24.17–75.24 billion, respectively. The BCRs are 20.63–41.44, 20.29–32.03, and 19.95–26.99, respectively. The NPV of the storm-surge barrier measure at a discount rate of 6% ranges from US$ 32.74–108.47 billion under the RCP2.6 scenario to US$ 33.73–125.82 billion under the RCP8.5 scenario, compared to the NPV of US$ 30.98–62.69 billion to US$ 31.96–77.30 billion obtained by the coastal wetlands strategy. The BCR of the storm-surge barrier measure ranges from 156.42–246.84 under the RCP2.6 scenario to 161.08–286.15 under the RCP8.5 scenario. It is higher than 82.45–85.30 under the coastal wetlands strategy RCP2.6 scenario to 87.95–101.43 under the RCP8.5 scenario.
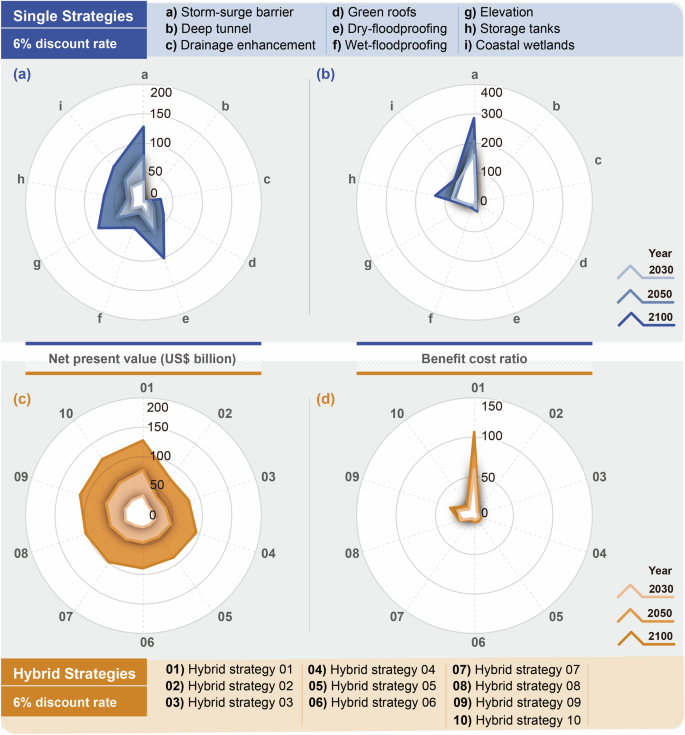
Figures a and c show the net present value of single strategies and hybrid strategies. Figures b and d denote the benefit–cost ratio of single strategies and hybrid strategies.
However, the coastal wetlands strategy has higher NPV and higher BCR than dry-floodproofing. This is because coastal wetlands contribute to social welfare by offering multiple ecosystem services, such as carbon sequestration, biodiversity enhancement, and esthetic value11. These social and environmental benefits are incorporated into the evaluation of the strategy’s economic benefits, providing a more comprehensive assessment of its overall value (Supplementary Note 1). Dry-floodproofing and elevation measures have a higher NPV than the storage tank measures, but the BCR is lower than for storage tank measures. Under the RCP8.5 scenario, the BCR of the storage tank at a 6% discount rate is 74.91–133.43, which is 3.7–4.2 times and 4.8–5.7 times that of dry-floodproofing and elevation, respectively. Among the soft adaptation measures, coastal wetlands have the best flood control effect. The NPV and BCR at a 6% discount rate are 2.0–3.8 times and 9.7–13.3 times that of green roofs, respectively. This is due to the fact that wetlands can act as wave breakers, thereby reducing the risk of wave climb. For flood control, wetlands are generally built in front of embankments, thereby reducing the cost of constructing embankments39. Among all adaptation strategies, the deep tunnel has the lowest NPV. Therefore, investments in deep tunnels need to be combined with storage tanks and building-code (i.e., dry-floodproofing and elevation) measures to maximize economic benefits. Under two emission scenarios, at a 6% discount rate, the NPV is US$ 0.71–1.64 billion and US$ 0.54–2.00 billion. The BCR of drainage enhancement is the lowest, with BCRs of 2.12–2.83 and 2.34–4.60, respectively. We design ten hybrid strategies by combining hard and soft measures (Table 1). Compared with other hybrid adaptation strategies, hybrid strategies 1, 9, and 10 have higher NPV and BCR. Under the two emission scenarios, at a discount rate of 6%, the NPV of Hybrid Strategy 1 is US$32.44–109.16 billion and US$33.39–127.49 billion. According to the comprehensive analysis of its NPV and BCR, the order of cost–benefit of each hybrid strategy from the best to the worst is hybrid strategies 1, 9, 8, 10, 4, 6, 5, 7, 3, and 2.
Flexibility focuses on delaying the implementation of measures or reducing initial investment to maintain system flexibility in terms of avoiding pathways dependence and improving economic benefits. Under certain circumstances, delaying the implementation of adaptation strategies may be more economically effective. As flood risk increases (and often accelerates) over time, it is generally more efficient to implement adaptation measures when they can yield more substantial benefit, i.e., later than sooner, and to postpone adaptation investments to the future. We, therefore, explored the impact of investment time delays (td) referred to as CBA-II. The cost and benefits of adaptation measures under delayed investment are calculated by accounting for the costs associated with dynamic changes in exposed land uses (e.g., residential, commercial, and industrial land), across different time periods (i.e., 2030, 2050, and 2100). Figure 4 shows the NPV after delayed investment for the Urban Planning Enhancement I (UPE-I) and Urban Planning Enhancement II (UPE-II) strategies. Figure 4 shows the delayed NPV for each year of delay (y-axis) under the 6% of discount rates, showing 80 trends. By evaluating the likelihood of 80 periods of delay, we seek the optimal timing of the delay for the adaptation strategies. As shown in Fig. 4, after delaying investment in drainage enhancement and green roofs, the economy is optimal and NPV will increase. The economically optimal decision is to delay drainage enhancement measures for 11–16 years (i.e., 2031–2036) will start to generate positive NPV, which is US$ 0.05 billion, and by 2100, the NPV will be US$ 0.56 billion. Depending on how the future plays out, the economically optimal decision for green roofs is to delay implementation for 16–21 years (i.e., 2036–2041), which would generate an NPV of US$ 14.8 billion by 2100. We compared the NPV of dry-floodproofing, wet-floodproofing, and delay in elevation measures and found that by 2035–2040, the efficiency of implementation of dry-floodproofing will be 55% higher than that of wet-floodproofing, and the efficiency of elevation measures will be 43% higher than that of wet-floodproofing.
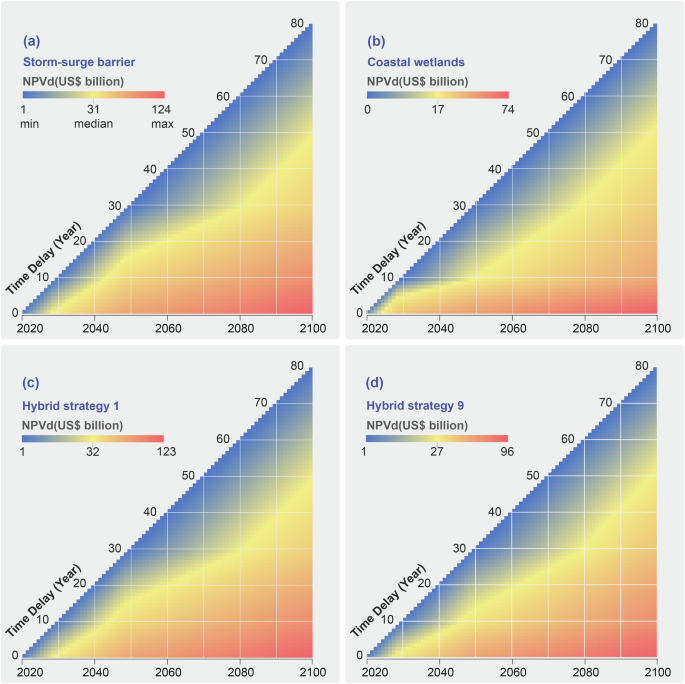
The unit of time delay is the year, and the unit of NPV is US$ billion. The horizontal axis represents the time axis. The color represents the value of NPV. The redder the color, the greater the NPV. The black dashed line is the contour of NPV.
It can be found that under scenarios such as sea level rise, land subsidence and socio-economic development, hard adaptation strategies (i.e., storm surge barrier) require immediate investment, and delay will reduce economic NPV. In terms of hybrid strategies, Hybrid Strategies 3 and 7 require a delay in investment of at least 15 years, while Hybrid Strategies 2, 4, 5, and 6 require a delay of at least 5 years in implementation. The delayed NPV under the RCP2.6 scenario and the BCR under the two emission scenarios are presented in the electronic supplementary information; Supplementary Figs. 8–11.
Switching between pathways to maximize economic efficiency
The delayed investment results show that some UPE-I and UPE-II strategies can generate better NPVs under high sea level rise scenarios when the investment time is delayed. Therefore, it may be economically beneficial to seek an adaptation pathway that initially implements the EUA strategy (Table 2) and eventually switches to one of the UPE-I or UPE-II strategies. We evaluated 16 possibilities for switching the EUA adaptation strategy to a UPE-I or UPE-II adaptation strategy (Table 2). We evaluate the year-by-year NPV and BCR for 80-time delay possibilities. Figure 5 and Supplementary Fig. 12 illustrate the NPV using scenario-based cost–benefit (i.e., static cost–benefit, see Supplementary Note. 2) calculations and the NPV and BCR for different time delays under the RCP8.5 scenario and the RCP2.6 scenario, respectively. The x-axis represents the year in which a switch is made, and the y-axis is the NPV and BCR displayed in 5-year increments.
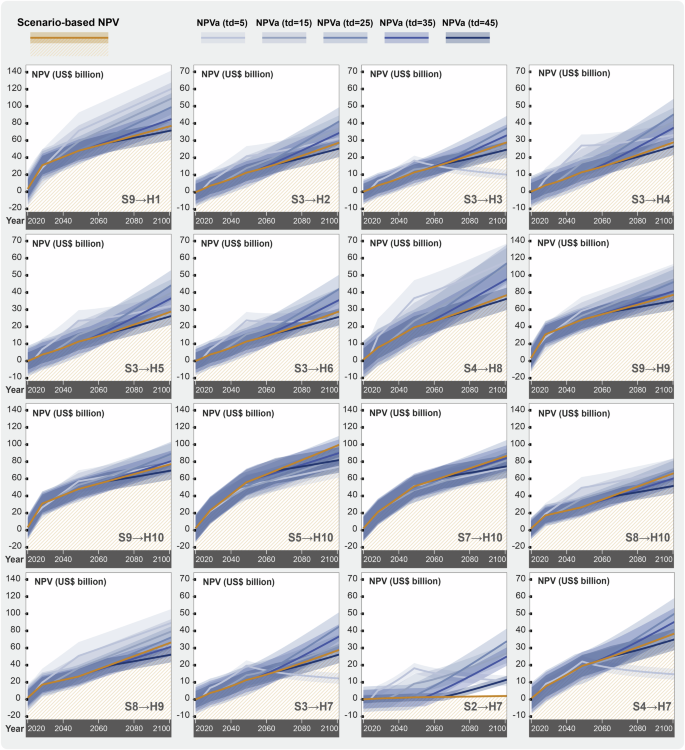
NPV in billion US$ for a transition from an investment in 2020, to UPE I/II strategies; 6% discount rate, shaded area interval indicates the 50% confidence interval for the NPV. The td means time delay. Economic efficiency means that applying adaptation pathways can produce higher economic efficiency than individual adaptation strategies. S2 switching to H7 means that when the deep tunnel switches to Hybrid Strategy 7, the NPV will increase in the future. This is due to the fact that the yellow line in the figure represents the NPV of a static scenario-based investment in the deep tunnel, and its implementation alone will not yield a high NPV in the future.
The NPV of switching from the EUA strategy to the UPE-II strategy shows that the best time to switch coastal wetlands to Hybrid Strategy 1 is 2029, with an NPV of US$ 124.52 billion, which is higher than the NPV of scenario-based coastal wetlands of US$77.30 billion. We compare the NPV of switching drainage measures to Hybrid Strategy 2, Hybrid Strategy 3, Hybrid Strategy 4, Hybrid Strategy 5, and Hybrid Strategy 6. We found that switching drainage enhancement measures to Hybrid Strategies 2, 3, 4, 5, and 6 in 2050. In particular, switching to Hybrid Strategy 4 will generate the highest NPV of US$ 48.15 billion, which is 2 times the NPV obtained by scenario-based CBA-I, which shows that switching to Hybrid Strategy 4 can increase economic benefits. The NPV of the drainage enhancement switching to Hybrid Strategies 2, 4, and 5 is higher than the scenario-based NPV in 2025, while the drainage enhancement is switching to Hybrid Strategy 3, and the NPV starts to be higher than the scenario-based NPV in 2037. The drainage enhancement switches to Hybrid Strategies 2–6 until 2060, when the NPV begins to be lower than the NPV of the scenario-based. The green roofs switch to Hybrid Strategy 8, yielding the highest NPV in 2025. The best time for coastal wetlands to switch to Hybrid Strategy 9 is 2030, with an NPV of US$ 103.12 billion, but it needs to switch to other strategies in 2058.
We compare the NPV of coastal wetlands, dry-floodproofing, elevation, and storage tank switch to a Hybrid Strategy 10. The good time for coastal wetlands to switch to Hybrid Strategy 9 is 2030, with an NPV of US$ 91.66 billion, but it will need to switch to other strategies in 2058. Dry-floodproofing and elevation are suitable for switching to Hybrid Strategy 10 in 2050, with NPVs of US$ 100.41 billion and US$95.45 billion, respectively, but elevation needs to switch to other strategies in 2053. The storage tank can be converted to Hybrid Strategy 10 in 2030, with an NPV of US$77.43 billion; it can be switched to Hybrid Strategy 9 in 2025, with an NPV of US$94.13 billion, but it needs to be switched to other strategies after 2052. We compared the NPV of drainage enhancement, deep tunnel, and green roofs switching Hybrid Strategy 7. Green roofs switch to Hybrid Strategy 7 have the highest NPV of US$ 55.59 billion in 2060. Deep tunnel switches to a Hybrid Strategy 7, with an NPV of US$ 36.91 billion. An investment in a deep tunnel needs to be used in conjunction with storage tanks, as well as dry-floodproofing and elevation in building regulations to minimize the overall risk of flooding. The NPV of different adaptation strategy switches under the RCP2.6 scenario and the BCR under the two emission scenarios are presented in the electronic supplementary information; Supplementary Figs. 12 and 14.
Trade-off analysis of dynamic adaptive pathways
We determine the tipping point of adaptation strategies, i.e., when they no longer meet the planned objectives. For this, we use criteria along six dimensions: the maximum flood risk reduction rate, the maximum NPV scenario-based, the NPV of the delayed investment, the maximization of economic efficiencies of the conversion pathways of adaptation strategies, the minimization of costs, and the maximum BCR. We combine the results of the analysis of satisfaction indicators for all adaptation strategies to perform a trade-off analysis. We use the DAPP method to identify the sequences of action of different adaptation strategies over time, as well as alternative routes to reach a satisfactory adaptation in the future. The adaptation tipping point is based on risk reduction rates greater than thresholds, cost minimization rankings, and the maximization of NPV and BCR calculated based on the CBA-I method. We also seek an adaptation strategy to delay the possible year based on the NPVd results of delayed investment calculated by the CBA-II method. We compare the NPVa calculated based on the CBA-III method with the NPV calculated scenario-based (CBA-I) to compare possible adaptation options for different adaptation strategy switches. We then explore combinations of candidate pathways, taking into account both adaptability and flexibility, ensuring adaptive decision-making processes that are designed from the outset to adjust over time in response to future deep uncertainties.
Figure 6 presents the DAPP map exclusively under the RCP8.5 scenario, chosen based on minimal differences in flood hazard outcomes between RCP2.6 and RCP8.5. Adhering to the risk-aversion principle, adaptation strategies under the RCP8.5 scenario address a worst-case, and are prioritizing preparedness for severe risks. The DAPP also incorporates transitions between measures within the hybrid strategies, ensuring flexibility and adaptability. Here, we focus on showing the transition pathways and timing of single measures to Hybrid Strategy 7 and Hybrid Strategy 1. The drainage enhancement measures in the EUA adaptation strategy are shifted to Hybrid Strategy 2, Hybrid Strategy 3, Hybrid Strategy 4, Hybrid Strategy 5, and Hybrid Strategy 6 in the UPE-I strategy, which will occur in 2024–2029, 2029–2034, 2055–2060, 2050–2055, and 2053–2058, respectively. The green roofs measure could move to a Hybrid Strategy 8 in 2025–2030. The coastal wetland measure can be converted to Hybrid Strategy 1 in 2063–2068. The best economic performance is a switch from a storage tank strategy to a hybrid strategy of coastal wetlands, dry-floodproofing, and land elevation in 2052–2057. It can be found through the DAPP that after 2072–2077, Hybrid Strategy 1 that combines storm-surge barrier and wetland conservation most effectively reduces flood damages and casualties and yields promising high co-benefits. Afterward, Hybrid Strategy 7 and Hybrid Strategy 1 continue to reduce flood risk while providing economic benefits. Our clearly formulated and quantified DAPP clarifies the decision-making space and helps overcome paralysis failures due to deep uncertainty.
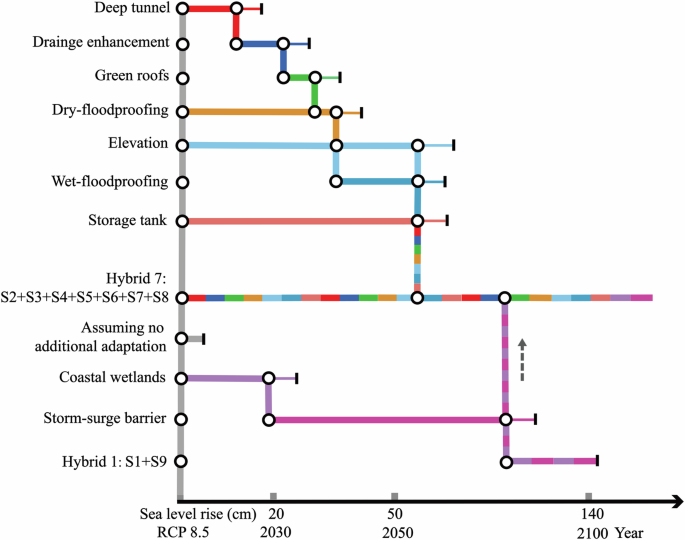
Black circles represent switch stations for new policy actions; black vertical line indicates the adaptation tipping point of a policy action.
Discussion
We adopt a novel modeling framework that integrates: a Decision Making under Deep Uncertainties (DMDU) framework for flood risk adaptation, compound hydrodynamic modeling (including pluvial, fluvial, coastal floods); flood risk analysis; three different CBA methods; robust metric and trade-off analysis and, finally, applying the DAPP framework using a pathway and tipping point analysis.
Under current conditions, the flood risk in Shanghai is high, with an EAD of US$ 2.64 billion/year, which is much higher than the current flood risk in New York City of about US$ 71 million/year12, although the latter was calculated only for direct damage to buildings and vehicles. Even under current conditions, flood risk adaptation strategies are urgently needed in Shanghai. This conclusion is supported by positive NPV results, even with a high discount rate of 8%. Moreover, in terms of cost–benefit analysis of adaptation strategies, our results are consistent with the conclusion of Du et al.40 that different adaptation measures, such as a storm surge barrier and storage tanks in the UPE-I/II strategies, can effectively reduce the current flood risk. Finally, the performance of potential adaptation measures in the future is quantitatively evaluated, and the optimal implementation following the DAPP framework for dealing with extreme compound floods in Shanghai in the future is formulated. The signal for adaptation policy transformation is sent through the tipping points of the adaptation pathways, which are flexible and dynamic. DAPP can enhance the ability to adapt to future coastal flood threats in stages and plan, combine, and implement new adaptation measures before the arrival of each new adaptation tipping point to ensure that flood risks are always below the tipping point. This change of action plans over time to reduce the impact of uncertainty on the decision-making process and results can ensure the robustness of the decision-making. This suggests that actual adaptation measures will depend on regular monitoring of sea level rise in the future41, which is consistent with Scussolini et al.17.
We present some policy implications and recommendations. In Shanghai’s current master plan (2017–2035), the cost–benefit of the strategy results in a high NPV of US$ 33.75 billion, US$ 17.73 billion, US$ 24.81 billion, and US$ 22.80 billion for storm surge barriers, storage tank, dry-floodproofing, and elevation, respectively. The storm surge barriers, coastal wetlands, wet-floodproofing, and storage tanks have a high BCR. The construction of a storage tank in the central city of Shanghai was approved by the Shanghai Municipal People’s Government in 2022 and is currently being implemented, with a high NPV and BCR. Wet-floodproofing has been applied in some areas, and the cost–benefit results of this measure show that it has a high BCR. The deep tunnel has the lowest NPV and BCR from the trial construction in 2019 to the formal investment and construction. The NPV and BCR of green roofs and drainage enhancement are only higher than deep tunnels.
Our results further suggest that a storm surge barrier at the Huangpu Estuary in Shanghai, similar to the Thames barrier in London and the Maeslant barrier in Rotterdam, should be considered. This is due to the fact that in the absence of storm surge barriers, the flood control walls on both sides of the Huangpu River need to be raised every 10 years due to sea level rise. In terms of long-term flood risk adaptation, building a storm surge barrier may be more cost-beneficial. While hard strategies such as storm surge barriers can reduce flood risk to lower levels under current and future conditions, there is still residual flood risk that needs to be addressed. For example, the probability of storm surge caused by Hurricane Sandy in New York in 2012 was extremely low, but the impacts of the catastrophic event were high. The Hybrid Strategy 1 constructed in this study, combining a storm surge barrier and a coastal wetland strategy, can further reduce residual flood risk. In addition, the flood control strategy based on building codes is consistent with the recommendations proposed in Rotterdam, and New York. These suggest improving building flood control standards in dangerous areas, adding flood control measures for old buildings, and raising the elevation threshold according to the predicted flood water level. Temporary or permanent water retaining facilities should be added to old buildings. Further, attention should also be paid to the construction of coastal wetlands, which can improve social welfare by providing a variety of ecosystem services, such as climate regulation value, flood regulation, and water storage value. Decision-makers can take into account these results on the service functions of various ecosystems in the region when formulating planning schemes, and fully tap the ecological service function value of wetlands in preventing seawater intrusion, regulating floods, and regulating climate. Moreover, it is beneficial to upgrade the low-level seawalls of the Baoshan and Chongming coasts and to regularly maintain the high-level seawalls of Pudong and Changxing. The DAPP in this study can provide decision-makers with a basis for long-term flood adaptation decisions on how to implement the above adaptation strategies for coastal cities. Nevertheless, our analysis has some limitations: we ignore the nonlinear interaction between sea level rise and extreme water levels, which are mainly caused by tide‐surge‐wave, pluvial flooding caused by intense rainfall, and river flooding in deltas and estuaries13. We lack a comprehensive consideration of insurance strategies and related factors. Insurance policies may contribute to preventing and reducing losses by providing incentives (e.g. premium reduction) to household adaptation.
Methods
General approach
We adopt a modeling framework (Fig. 7) that follows the DMDU framework for flood risk adaptation; compound hydrodynamic modeling (including pluvial, fluvial, coastal floods) (section 1); flood risk analysis (section 2); future scenarios (section 3); adaptation strategies (section 4); three different CBA methods (section 5); robust metric and trade-off analysis (section 6) and, finally, DAPP (section 7). We have implemented these parts as follows. Firstly, we follow the Decision Making under Deep Uncertainties (DMDU) framework consisting of six dimensions. Secondly, following the DMDU framework, we produce current and future coastal flood hazard maps for different return periods. Thirdly, we calculate the total exposed assets by superimposing the flood hazard depth maps with the elements at risk. From this, by applying vulnerability curves, we obtain flood impact estimates by simulating probabilistic direct- and indirect expected annual damages (EAD) and expected potential casualties (EAC). In parallel, we simulate the implementation of adaptation measures in the flood hazard and flood impact models. We therefore obtain flood extent and depth, and EAD and EAC with and without the implementation of adaptation measures. Subsequently, we combine the nine single measures into ten hybrid strategies: existing urban adaptation (EUA), urban planning enhancement I (UPE-I), and urban planning enhancement II (UPE-II). We carry out a comparative CBA of all the adaptation strategies. Then, we construct a multi-objective function and use satisfaction metrics to evaluate the comprehensive performance of the different adaptation strategies. Finally, we combine the results of the tradeoff analysis with the DAPP method to generate long-term robust dynamic adaptation pathways. See Supplementary Notes 2 and 3 for background information.
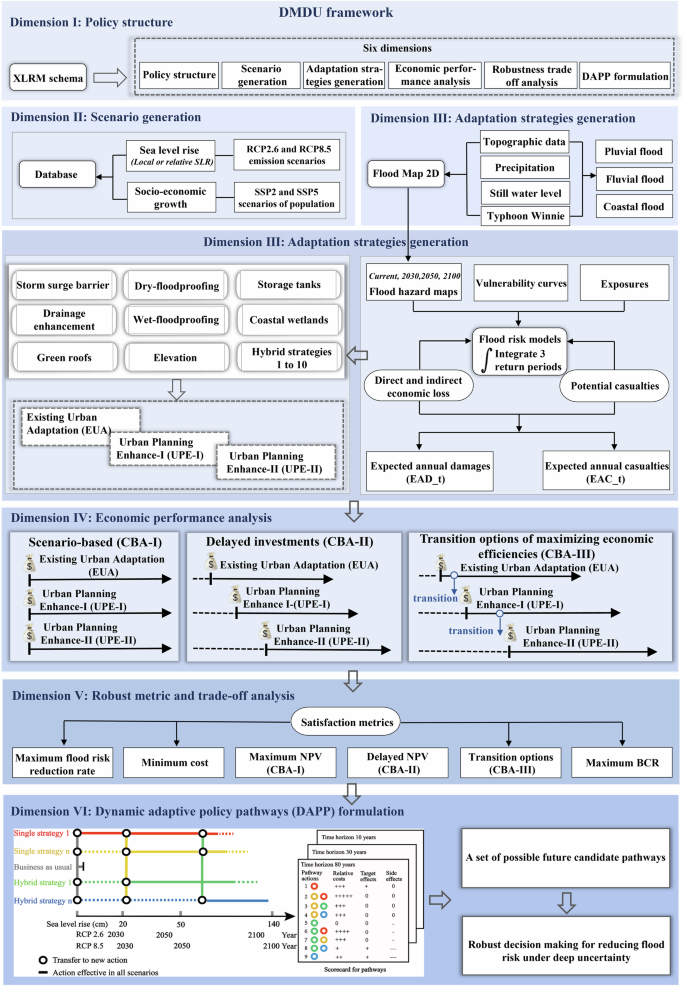
Dimension I focuses on policy structure, Dimension II on scenario generation, Dimension III on adaptation strategies generation, Dimension IV on economic performance analysis, Dimension V on robust metric and trade-off analysis, and Dimension VI on DAPP formulation (Dimension VI panel source modified from Haasnoot et al.30).
We use the XLRM schema (Fig. 8). Our framework defines the adaptation strategy performance metrics (M), the system relationships (called relationships, R), the uncertainties (called externalities, X), and possible policy actions (called policy levers, L), M = R (X, L)42, to structure the DMDU framework. The DMDU framework is reflected in six dimensions (Fig. 7): policy structure, scenario generation, adaptation strategies generation, economic performance analysis, robustness trade-off analysis, and DAPP formulation31,43:
-
(1)
Policy structure. Following Walker et al.44, Haasnoot et al.23, and Kwakkel and Haasnoot45, the policy structure developed in this study is structured as an adaptive process. Policies are flexible over time and can be adapted to long-term flood risk decisions-making.
-
(2)
For the scenario generation, climate uncertainty factors are clarified through enumeration (Supplementary Note 2), screening and quantitative analysis, while socioeconomic uncertainty factors are reflected in the impact on future flood risks (Supplementary Note 2). We adopt the method of Yin et al.38 and Shan et al.35 to model flooding by assuming a scenario of breach of embankments caused by the increase of river or coastal water levels. We use the projections of future sea level rise, land subsidence, tidal cycle, floodplain topography, and river flow boundary conditions as in the study by Yin et al.38 as simulation inputs. We produce current and future coastal flood hazard maps for different return periods.
-
(3)
For the adaptation strategies generation, we aggregate the nine single adaptation measures into 10 hybrid strategies: existing urban adaptation (EUA), urban planning enhancement I (UPE-I), and urban planning enhancement II (UPE-II) (Tables 2 and 3). We simulate flood distributions under various climate scenarios for each adaptation measures and strategies to assess their flood risk, which is expected annual damages (EAD) and expected potential casualties (EAC) (Supplementary Note 2). We calculated the EAD of Shanghai’s elements at risk, including different land uses, household properties, different industrial output values, and transportation delays.
Table 3 An overview of Shanghai’s EUA, UPE-I and UPE-II adaptation strategies -
(4)
For the economic performance analysis, we carry out the CBA-I, CBA-II, and CBA-III analysis for all the single adaptation measures and hybrid strategies (Supplementary Note 2). In parallel, we assess the co-benefits of ecosystem service from nature-based strategies (Supplementary Note 2). Three different and compared CBA approaches provide insights for robust decision-making. CBA-I, CBA based on standard scenarios; CBA-II, different investment timings to adapt to the strategy; CBA-III, “switch options to maximize economic efficiency”, allowing flexibility of adaptation over time.
-
(5)
For the robustness trade-off analysis, we construct the multi-objective robust decision functions, including maximum flood risk reduction rate, minimum cost, maximum NPV scenario-based, delayed NPVd and the transition options to maximize economic efficiency NPVa, to evaluate optimal performance using the threshold-based satisfaction metrics method. Satisficing-based robust metrics emphasize maximizing “the number of plausible futures in which some criteria are met,” seeking to maximize the performance45,46 (Supplementary Note 2).
-
(6)
For the DAPP formulation, we generate a set of possible future candidate pathways from a multi-objective, multi-dimensional, and multi-stage perspective that adjusts over time to respond to deep uncertainty in the future (Supplementary Note 2). We explore combinations of candidate pathways, taking into account both adaptability and flexibility, ensuring adaptive decision-making processes that are designed from the outset to adjust over time in response to future deep uncertainties. Given the pathways and signposts that indicate options for moving from one pathway to another, decision-makers can make informed decisions30,47.
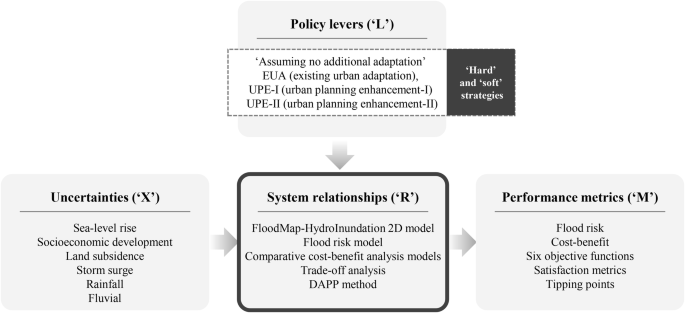
It defines adaptation strategy performance metrics (M) based on system relationships (R), uncertainties (X), and policy levers (L), following the equation M = R (X, L).
Flood hazard modeling
Compound flood modeling was conducted using the FloodMap-HydroInundation 2D model48, which integrates hydrological processes with surface flood inundation and supports multiple boundary conditions, including pluvial, fluvial, and coastal sources. The model’s effectiveness has been validated in Shanghai38 and other cities49. We adopted and refined the methods of Yin et al.38 and16,35 using projections of sea level rise, land subsidence, and river flow conditions. Improvements included updated 2020 urban drainage data and new simulations of fluvial and coastal flooding (Supplementary Fig. 15). For pluvial flooding, the intensity–duration–frequency (IDF) method and the Chicago Design Storm were used, with a peak-to-total time ratio of 0.4. A high floodplain roughness coefficient (Manning’s n = 0.06) was applied to represent urban overland flood routing.
Flood risk assessment
Direct economic losses from flooding include damage to residential, commercial, and industrial land, as well as household property. Land use data from 2010 and projections for 2030, 2050, and 2100 were used to estimate total asset values based on costs per land-use class16. Vulnerability curves linking inundation depth to loss rates were developed using historical flood data, field surveys, and insurance records50, and direct economic losses were assessed using these curves and asset valuation methods. Indirect economic losses from agriculture, industry, commerce, and transportation disruptions were also evaluated using sector-specific vulnerability and depth-disruption curves51. Potential casualties were estimated using depth–casualty ratio curves52 combined with population distribution data from WorldPop and Coastal Population Projections53. The expected annual damage (EAD) and expected annual casualties (EAC) were determined by assessing losses and casualties across various return periods. Risk reduction is measured as the difference in EAD between the “assuming no additional adaptation” scenario and the EAD after implementing a single measure or hybrid strategy.
Adaptation strategies
This study evaluates adaptation strategies, including “assuming no additional adaptation,” nine single measures, and ten hybrid strategies (EUA, UPE-I, and UPE-II) (Table 3). The “no additional adaptation” scenario represents current flood protection measures, such as floodwalls, sea dikes, drainage systems, green areas, and coastal wetlands. Hybrid strategies were designed based on Shanghai’s master plans and integrated hard measures (e.g., storm surge barriers, storage tanks, deep tunnel, drainage enhancement) with soft measures (e.g., dry-floodproofing, wet-floodproofing, elevation, green roofs, and coastal wetlands) to address sea level rise and socio-economic changes. UPE-I focuses on enhancing flood protection by 2050 through additional investments, while UPE-II adapts to land-use changes by 2100, incorporating measures like storm surge barriers and drainage enhancements. Dynamic investment is applied based on terrain and land-use type, tailoring strategies for residential, commercial, and industrial areas. These combined approaches coalesce urban planning and decision-maker input to form robust, flexible flood adaptation strategies.
Cost–benefits analysis
The analysis began with the static cost–benefit evaluation of single adaptation measures and hybrid strategies using the cost-benefit analysis-I (CBA-I) method. Next, the net present value (NPV) and benefit-cost ratio (BCR) of delayed investments and the transition between adaptation strategies were assessed using the cost–benefit analysis-II (CBA-II) and cost-benefit analysis-III (CBA-III) methods. Additionally, the co-benefits of ecosystem services provided by nature-based coastal wetlands were evaluated.
Robust metric and trade-off analysis
Robustness trade-off analysis can support long-term planning and design of future flood risk adaptation in coastal cities confronting deeply uncertain futures. In this study, we determine appropriate statistical thresholds to define robustness and select potentially robust candidate solutions based on how well each strategy performs under deep uncertainty.
Dynamic adaptive policy pathways
This study employs the dynamic adaptive policy pathways (DAPP) method to develop flexible strategies for minimizing future flood risks. The DAPP map (Fig. 6) identifies adaptation tipping points (ATPs), where strategies no longer meet performance thresholds, and outlines alternative pathways with post-ATP options. These maps provide stakeholders with clear insights into costs, benefits, and performance, supporting decisions on timing, no-regret actions, and flexible adaptations. The DAPP approach and the use of ATP offer significant advantages: it broadens assessments beyond physical thresholds to evaluate economic, social, and environmental feasibility; highlights the multiple benefits of strategies (including economic, social, and environmental benefits); and enhances flexibility by addressing complex scenarios. This comprehensive framework supports robust decision-making under deep uncertainty, ensuring strategies remain effective across diverse and changing conditions.
Uncertainty analysis
Uncertainties are addressed in seven steps of the modeling framework. The study incorporates multiple future scenarios using RCP-based sea level rise (SLR) estimates and SSP-based socioeconomic projections. These scenarios represent various emissions trajectories and socioeconomic pathways, offering a range of possible future conditions to account for uncertainty in long-term projections13. To address variability in SLR projections, the study employs 5%, 50%, and 95% probability estimates for each RCP scenario. This approach captures a wide range of potential outcomes, from optimistic to high-end scenarios, ensuring that the analysis remains robust under diverse SLR conditions4. To address the uncertainty in combining adaptation strategies for decision-making, this study developed a variety of potential hybrid strategies52. The analysis incorporates uncertainty in economic factors, particularly discount rates, which significantly influence cost–benefit evaluations. Three discount rates (8%, 6%, and 4%) are used to reflect different perspectives on the opportunity cost of investments, thereby accommodating variations in economic assumptions14. To comprehensively assess the cost–benefit of adaptation measures, we evaluated both their economic benefits and the social and environmental contributions of nature-based coastal wetlands1. To enhance the robustness of our analysis against unquantified uncertainties in the modeling process, we utilized a function within the robust metric and multi-objective trade-off analysis that represents flood risk as relative changes across different scenarios, rather than relying on absolute values15. To address uncertainties in decision-making outcomes, this study establishes multi-objective robust decision-making goals, integrated across all modules of the modeling chain in Fig. 7. Robustness metrics are applied to perform trade-off analyses for single measures and hybrid strategies, identifying a series of dynamic, adaptive implementation pathways that are practical and actionable.


Responses