Dynamics of vibrationally coupled intersystem crossing in state-of-the-art organic optoelectronic materials

Introduction
The fine control of triplet and singlet states populations in many optoelectronic applications using molecular semiconductors is crucial for the further development of organic electronics. For instance, the problem of triplet harvesting is essential for the fabrication of more efficient all-organic light emitting diodes (OLEDs)1,2. Likewise, the triplet state induces a significant non-radiative decay channel of photo-generated excitons in organic photovoltaics (OPVs)3,4. For both applications, the prevailing mechanism of triplet deactivation is charge recombination. This issue is significant because, in organic semiconductors, spin statistics dictate that only 25% of the excitons are singlet states while the remaining 75% are triplet states5. Yet it is becoming evident that the direct conversion of singlets to triplets (intersystem crossing, ISC) or vice-versa (reverse intersystem crossing, rISC) is crucial mechanisms in the processes of charge or light generation using organic semiconductors6.
In OLEDs, it would be desirable to favor the rISC process to convert dark triplet excitons into emitting singlet states which tend to increase the electroluminescence efficiency through thermally activated delayed fluorescence (TADF)7. Equally important is the control over geometrical differences driven by different electronic structures of those states, since they profoundly impact the reorganization energies for ISC (rISC) processes8.
In OPVs, the transition from fullerene to non-fullerene acceptors (NFAs, see Fig. 1) significantly improved the photovoltaic efficiency, reaching a record high of 19.3%9,10. Promising photovoltaic performance has been obtained by applying NFAs belonging to the so-called Y-series of acceptors11,12. The exciton diffusion length is significantly longer in these molecules due to optimized energy transfer parameters, which increases the time for charge generation13,14,15,16,17,18. Hence, the ISC process may have a significant impact on efficiency, since singlet excitons can be converted to triplet by ISC before reaching the donor (D)/acceptor (A) heterojunction (where they undergo charge transfer)3. Once converted to molecular triplet excitons, those states might non-radioactively recombine, which tends to reduce the open-circuit voltage2,19,20. Moreover, exchange energy makes molecular triplet states to be energetically below the triplet charge transfer (CT) state formed at the D/A heterojunction. Hence, a considerable fraction of CT states can relax to molecular triplet states and be deactivated by non-radiative pathways21. As pointed out in Grüne et al., every process that favors triplet formation in NFA-based OPVs (including ISC) might end up in low-lying molecular triplets and increase non-radiative recombination3.

Representation of chemical structures of the four groups of NFAs used in this work.
A deeper understanding of ISC is also important to access other non-linear processes involving triplets that depends on the ISC rate. Among them, one can highlight singlet fission and photon up conversion. Singlet fission produces two triplet excitons from single-photon absorption, which could be a possible strategy to overcome the efficiency limit for solar cells, derived from the detailed-balance principle (also known as the Shockley-Queisser limit)22. Photon upconversion can be achieved by triplet-triplet annihilation to produce singlet excitons23,24, paving the way for a better use of the near infrared range (NIR) either for charge generation or efficient NIR to vis sensors.
The above considerations called attention to the influence that ISC processes might have in many applications involving organic semiconductors. For instance, the general rule of thumb in OLEDs emitters with enhanced rISC rates is to favor a strong intramolecular charge transfer by synthesizing molecules with a combination of donor and acceptor moieties25. This architecture tends to produce an efficient TADF8. No coincident this is the same strategy followed to fabricate the state-of-art NFAs since it induces a significative intramolecular separation of the highest occupied molecular orbital (HOMO) and lowest unoccupied molecular orbital (LUMO) decreasing the electron-hole overlap. As a consequence, there is a decrease in the S0 − S1 gap, which enhances the photon harvest at long wavelengths. This feature also facilitates charge generation by reducing the S1 binding energy. In addition, it decreases the exchange interaction, which also narrows the S1 − T1 gap ((Delta {E}_{{S}_{1}{T}_{1}})), a factor that tends to strengthen ISC (rISC) transitions26. Yet other factors besides (Delta {E}_{{S}_{1}{T}_{1}}) can decisively influence the ISC (rISC) rates and must be considered to set design principles for tune these processes. According to El-Sayed’s rule27, significant spin-orbit coupling (SOC) to the singlet-triplet transition is achieved when the states involved in the transition have a different orbital nature. For instance, since the S1 state tends to have a CT character promoted by the D-A intramolecular architecture, the SOC is weaker if the triplet state also possesses a pronounced CT character, whereas it is stronger when the triplet state has a more localized nature, confined to the donor or acceptor moieties. This selection rule unveils the crucial role that might be played in ISC (rISC) process by a third additional triplet state (T2) with an energy intermediary between S1 and T1, see Fig. 2. Currently, it is believed that ISC (rISC) can be mediated by this additional state once it has a different nature compared to S1. Following this picture, the lower value of the S1 − T2 gap ((Delta {E}_{{S}_{1}{T}_{2}})) would increase the ISC rate (kISC) from S1 to T2. Depending on the intensity of the respective rates, the system could then relax to T1 by internal conversion or return to S1 by rISC.
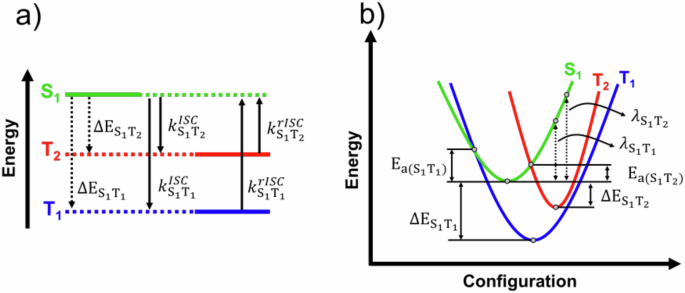
a Highlighted are the first singlet excited state (S1), the first triplet (T1), the second triplet excited states (T2), the energy differences between states, and the (r)ISC rates between states. b The harmonic curves represent the adiabatic potential energy variation for each excited state. The points and energies differences necessary to calculated the ({k}_{(r)ISC,{S}_{1}{T}_{1(2)}}) rates using eq. (1) and (2) are indicated in the curves. The activation energies are represented by Ea.
Figure 2b illustrates the main parameters of the Marcus-Hush semiclassical electron transfer formalism7,8,28,29,30 for a three state model involving S1, T1, and T3. It is well-know that this formalism gives reasonable estimates of the ISC (rISC) rates in TADF emitters8. Under this approach, k(r)ISC is given by,
with ℏ the reduced Planck constant, HSO the spin-orbit coupling, λ(r)ISC the reorganization energy, and Ea(ST) is the activation energy. In the special case where the harmonic curves corresponding to the excited states have the same angular coefficient relative to the configuration coordinate, then,
where T is the temperature, kB is the Boltzmann constant, and ΔEST is the singlet-triplet energy gap.
Under the Marcus-Hush framework, the distinct electronic nature of the three states involved in the ISC (and rISC) processes significantly impacts their geometrical configurations, leading to substantial changes in the reorganization energy (λ(r)ISC) required for spin-flip transitions. Since the activation energy for the transition depends on a combination of ΔEST and λST, the relationship between these parameters can be decisive in eventually compensating for the low SOC of states of similar nature. Yet molecular vibrations affecting the electronic coupling between the D-A groups within the molecule can significantly change the ISC (rISC) rates (kISC and krISC). Those vibrations can either modify the triplet-gap and/or the nature of the excited states (from CT to local and vice-versa), significantly altering SOC. For example, vibrationally driven variations in the dihedral angle between the donor and acceptor moieties of TADF emitters were found to enhance ISC rates8. Nevertheless, these kinds of effect are poorly understood in NFAs despite the fact that those acceptors are synthesized following chemical structures similar to those of TADF emitters.
In face of this lack of knowledge, the present work details ISC (rISC) processes in state-of-the-art non-fullerene acceptors. These molecules offer several advantages over traditional fullerene acceptors, including better light absorption, adjustable frontier molecular orbital energy levels, improved chemical stability, and lower singlet exciton binding energy for the fabrication of efficient OPVs31,32,33. These features enable the generation of free charges with lower driving force, resulting in an increased open-circuit voltage of the device19,34. The Group I, II, and III molecules in Fig. 1 have an acceptor-donor-acceptor (A-D-A) fused linear structure35. The molecules in group III differ from the ones in groups I and II by a single carbon bond linking two thiophene rings. The molecules of groups I, II and III have variations in their chemical structure with the addition of Fluorine (F) or Chlorine (Cl) at their ends. Finally, group IV molecule has A-DA’D-A structure that, like the other groups, has the addition of F atoms at its ends. Currently, the series of molecules belonging to this group (Y-series) are reaching better OPV performance in blends with donor polymers36.
Some general features of triplet states in Group I, II, and III molecules were already studied in a previous work26 but here we developed a much deeper analysis by directly calculating the kISC and krISC rates for those acceptors and also for the canonical NFA of the Y-family (Y6). We demonstrate that the formalism based on Fig. 2b and eqs. (1) and (2) is insufficient to account for the ISC quantum yields observed in NFAs. We also investigated the possibility that higher excited states might be involved in the ISC phenomena. However, we found that the energies of the S2, T3 and T4 states are too high. In addition, the S2 state has a low oscillator strength compared to S1 (for details, see Fig. S9 in supplementary information (SI)). This work, therefore, provides alternative explanations for the photophysical behavior of these molecules by employing the theory of quantum walks and highlighting how intrinsic features of the chemical structure of conjugated D-A molecules can influence subtle aspects of these phenomena, which are crucial for technological applications.
Results and discussions
The behavior of the spin-orbit coupling for ϕ = 0o
This section discusses the results obtained from geometries derived after TD-DFT optimizations of the excited states using the S0 conformation as input, which is equivalent to ϕ = 0∘. This discussion will be important to reveal the main physical aspects of the ISC induced by the SOC in NFAs.
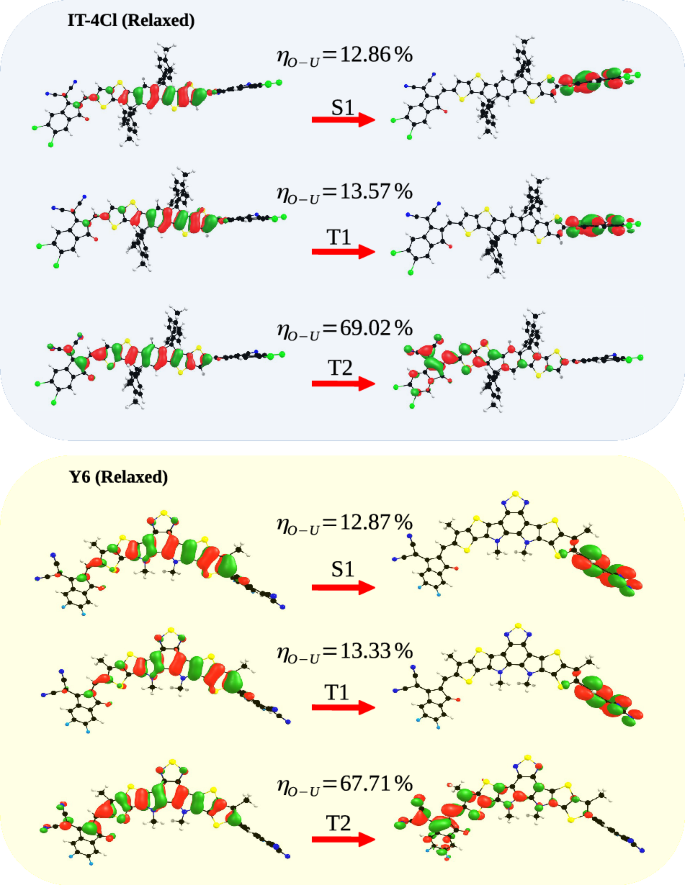
Table 1 summarizes the values of the main parameters involved in the SOC for the NFAs of Fig. 2, i.e.HSO and ΔEST. Since the behavior of ΔEST with fluorination or chlorination substitutions was already extensively discussed in a previous work26,37, here the focus will be on broad tendencies followed by HSO. Hence, with regard to ΔEST, we only highlight that the singlet-triplet gap tends to decrease with F or Cl substitutions and that chlorination is more effective in reducing it. Among the F-substituted molecules, Y6 has the smallest (Delta {E}_{{S}_{1}{T}_{1}}). This may be associated with the fact that the central chemical structure of the Y6 molecule is different compared to the other NFAs of groups I, II, and III. The value of the electron-hole superposition (η) together with the spatial distribution of NTOs of states S1, T1 and T2 are shown in Fig. 3 for each group of NFAs. Those results are essential to understand the variations of the parameters involved in the SOC.
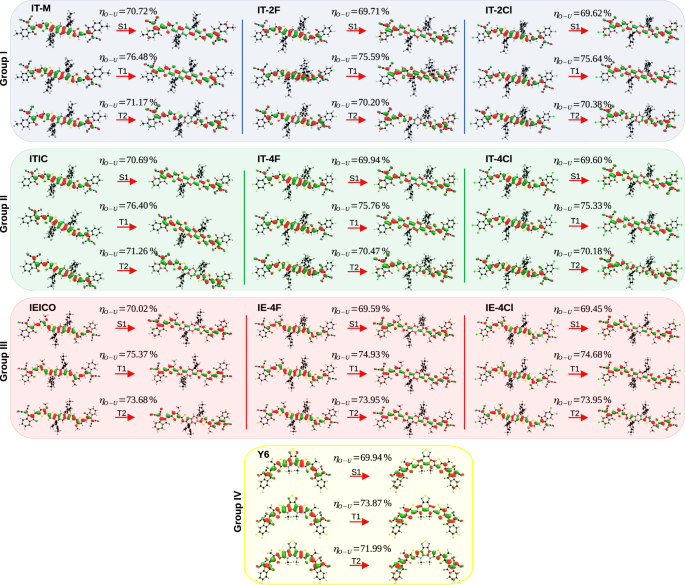
The values of the electron-hole superposition (η) are presented for each state. The respective NTO weights are reported in Tables S3 to S6 of the SI.
The main results of Table 1 are discussed below, always referring to Fig. 3. The values of the parameters ({lambda }_{{S}_{1}{T}_{1}}) and ({E}_{a({S}_{1}{T}_{1})}) are given in Table S2 of the SI. It is clear from this figure that the molecular orbitals involved in the S1 and T2 transitions shows comparable electron-hole (e-h) overlaps whereas the T1 state tends to have a higher η. This tendency is specially followed for the molecules of groups I, II and IV. For the molecules of group III, the e-h overlap between states T1 and T2 becomes similar but the general trend is the same for all molecular groups, where ({eta }_{{T}_{1}} > , {eta }_{{T}_{2}} > ,{eta }_{{S}_{1}}).
According to El-Sayed’s rule27, the angular momentum operator of the spin-orbit coupling induces an orbital torque, which decreases the overlap of the orbitals. This result implies a correlation between orbital overlap and spin-orbit coupling, in which a greater spin-orbit coupling also generates a smaller overlap between molecular orbitals due to symmetry changes. Hence, first-order approximations indicate that HSO is zero between singlet and triplet states of the same character, for instance, when both excitations are derived from π − π* CT transitions38. Rapid inspection of the results in Fig. 3 clearly indicates that S1, T1, and T2 all have a strong π − π* component. Yet, the values of HSO in Table 1 are very small (in the range of tenths of cm−1 for S1 → T1 and hundredth of cm−1 for S1 → T2) but not zero. Following Caldwell et al.38, the non-vanishing HSO occurs when the excited states relevant for ISC (rISC) do not have a pure CT or locally excited (LE) character, but they are a mixture of these two characteristics (CT-LE character). Here we will verify this hypothesis by assuming η as a parameter that quantifies the degree of CT-LE mixing so that η = 100% corresponds to a pure localized state transition whereas η = 0% corresponds to a pure CT-like transition. Following the reasoning behind El-Sayed’s rule, HSO would increase with increasing difference ({chi }_{{T}_{n}}={eta }_{{T}_{n}}-{eta }_{{S}_{1}}), where ({eta }_{{T}_{n}}) is the e-h overlap of the triplet states (T1 or T2) and ({eta }_{{S}_{1}}) is the overlap of the singlet state S1.
Again, for all the acceptors studied (except group III), the values of η in Fig. 3 are similar for states S1 and T2 but higher for state T1. Consequently, states S1 and T2 tend to have a similar degree of CT-LE mixing, while T1 has a more pronounced LE character (the spatial distribution of NTOs in Fig. 3 indicates that T1 is essentially localized in the central donor core of the NFAs molecules). For instance, ({chi }_{{T}_{1}}) is 5.7% for the ITIC molecule while ({chi }_{{T}_{2}}) is only 0.6%. This trend is followed for by the other molecules of groups I, III and IV and explains why HSO between S1 and T1 is higher compared to the SO coupling between S1 and T23. The remarkable exception to this trend are the molecules in group III that have a lower HSO for both triplet states. In this group, the variation of ({chi }_{{T}_{n}}) between T1 and T2 is smaller which indicates that the triplet states have similar degrees of CT-LE mixing. Figure 4 shows this relationship between SOC, χ and (Delta {E}_{{S}_{1}{T}_{n}}).
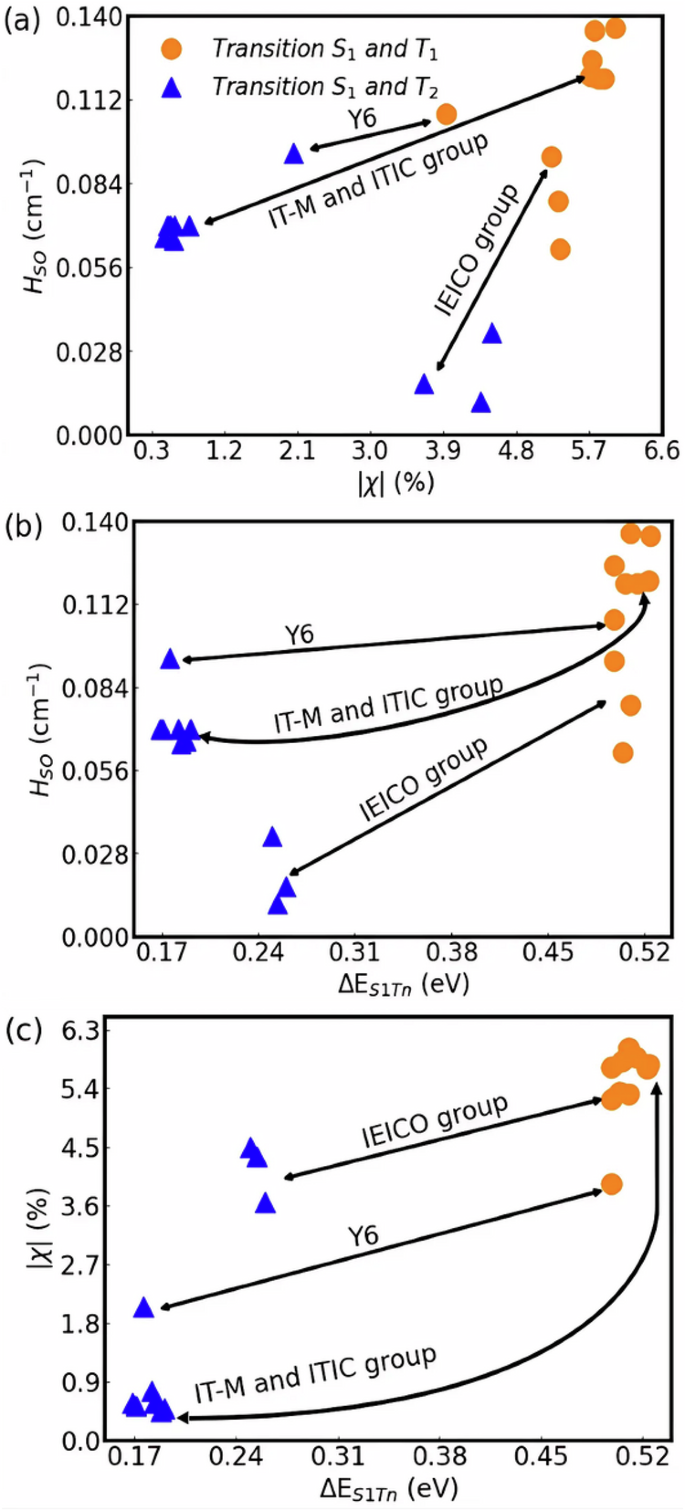
The Figure (a) is relationship between HSO and (Delta {E}_{{S}_{1}{T}_{n}}), (b) HSO and χ and (c) χ and (Delta {E}_{{S}_{1}{T}_{n}}).
Figure 4 a shows the SOC between states S1 and Tn (n = 1 or 2) as a function of ({chi }_{{T}_{n}}) for all the NFA families considered. It is clear that HSO tends to increase with ({chi }_{{T}_{n}}). This trend reveals the role played by variation of CT-LE character between singlet and triplet states as an important factor in determining the ISC (rISC) processes in those molecules. If, indeed, HSO depends on the degree of CT-LE mixing, then the spin orbit coupling must increase with increasing gap between S1 and the triplet states. All these tendencies are demonstrated in Fig. 4b that plots HSO as a function of (Delta {E}_{{S}_{1}{T}_{n}}). Figure 4c further clarifies the results of Fig. 4a by indicating that larger differences in ({chi }_{{T}_{n}}) are associated with an increase in (Delta {E}_{{S}_{1}{T}_{n}}) gap.
Table S2 in SI provides additional parameters (({lambda }_{{S}_{1}{T}_{n}}) and ({E}_{a({S}_{1}{T}_{n})})) required for the calculation of ISC rates using eq. (1) and (2), along with a comprehensive discussion of these results. The resulting ISC rates are shown in the last column of Table 1. Here we will only highlight the point that is important for the following analysis developed in this work. Note in Table S2 that ({E}_{a({S}_{1}{T}_{1})} , > > ,{E}_{a({S}_{1}{T}_{2})}) simply because (Delta {E}_{{S}_{1}{T}_{1}} > Delta {E}_{{S}_{1}{T}_{2}}). Consequently, the S1 → T1 rate (({k}_{{S}_{1}{T}_{1}})) is vanishingly small, despite the lower energy of this triplet state and its higher spin-orbit constant. These results based on Marcus-Hush formalism and a “frozen” molecular geometry thus indicate that the direct intersystem crossing from state S1 to T1 is unlikely and that the ISC (rISC) in NFAs is a three-state process mediated by T2. Three-state models involving triplet states with different nature were proposed to explain thermally activated delayed fluorescence (TADF) of molecular emitters dispersed in OLEDs hosts8.
Hence, in accordance with these conclusions, Table 1 reports only the S1 → T2 transition rates since ({k}_{{S}_{1}{T}_{1}}approx 0). For acceptors belonging to groups I, II and IV, the ISC rate is around 105 s−1. The molecule with the fastest k’s belongs to group II, IT-4F, but molecules with Cl and the Y6 molecule also have high kISC rates as well. This is due to a combination of small (Delta {E}_{{S}_{1}{T}_{2}}) gaps and reorganization energies with stronger HSO. On the other hand, as expected from the parameters in Table 1, the molecules of group III have the lowest rates produced by the unfavorable combination of lower SO coupling constants and higher activation energies ({E}_{a({S}_{1}{T}_{2})}).
The magnitude of the ISC rates calculated in this section is in relative agreement with other estimates developed for the Y-series NFAs3. However, given the average magnitude of the S1 lifetime in those molecules (around 225 ps39), those rates imply very small ISC quantum yield (Φ), around 0.001%. There is then a contradiction with the experiments that measured Φ between 3% (for Y63) and 5% (for IEICO-derivatives4) in solid-state. This result suggests that the ISC rates obtained in this section considerably underestimate the intersystem crossing in NFAs. However, in the next section, it is shown that molecular distortions between the donor (D) and acceptor (A) moieties of the NFA play a major role in enhancing spin-flip processes, thereby helping to reconcile the theoretical estimates with the experimental data. In addition, quantum chemistry calculations of the relaxed potential energy curves for excited states will reveal that the three-state model with uncorrelated transitions and the Marcus-Hush formalism is no longer adequate to access the ISC rates.
Intersystem crossing in the presence of distortions: dependence on dihedral angle ϕ
General features of the excited state’s PECs
The photophysical behavior of the TADF emitters showed the key role of molecular vibrations for the ISC process8. It was found that singlet-to-triplet transitions can be activated by molecular vibrations that change the dihedral angle between the D and A regions. Following these variations, a reasonable SO coupling was achieved with low reorganization energy and a small energy gap, so that the ISC rate is considerably enhanced. Here these effects were investigated in NFAs. For this study, the IT-4Cl and Y6 molecules were selected since they were found to have the lowest activation energies for the ISC processes.
First, it is important to call attention to the fact that the chemical complexity of NFAs is considerably higher than that of TADF emitters for OLEDs applications. Those molecules usually have only one dihedral angle ϕ that separates the A and D moieties of their chemical structure. On the other hand, NFAs have two angles that link the donor core to the edged acceptors. The study of the ISC (rISC) process was then developed here considering a simplified approach that calculates the relaxed potential energy curve (PEC) of excited states upon rotation of only one ϕ (of the two angles) that are present in these symmetric molecules. The angle ϕ under consideration here is highlighted in Fig. 5a.
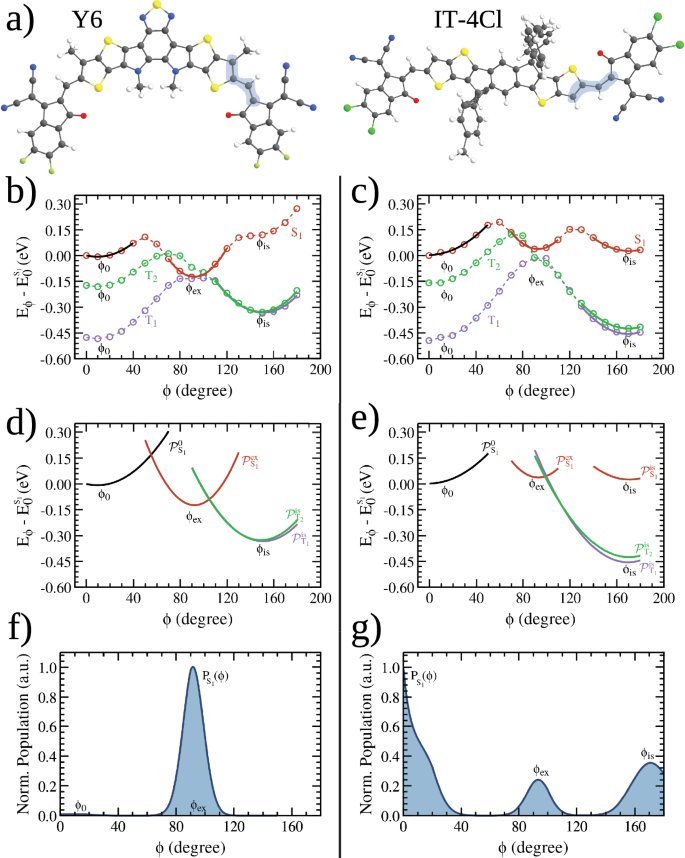
a Molecular structures in which the dihedral angle between the central fused-ring core and the acceptor end group (ϕ) was highlighted. The conformation shown in the picture corresponds to the optimized geometry of the ground state, assumed to be ϕ = 0o. Relaxed potential energy curve (PEC) of the S1, T1 and T2 states as function of ϕ (dashed lines) for the Y6 (b) and IT-4Cl (c) molecules. The PEC was performed with a step of 10 degrees. The characteristic angles of the PEC’s minima are indicated, together with the harmonic curves (parabolas) fitted around those angles. The curves resulting from the parabolic fitting at the minimum angles of curves are presented in (d) for Y6 and in (e) for IT-4Cl. Normalized relative population of conformers derived from PEC of the S1 state are presented in (f) for Y6 and in (g) for IT-4Cl.
All discussions in this section will be based on the PEC’s curves of the three excited states (S1, T1, and T2) calculated for the Y6 and IT-4Cl molecules. The PECs are depicted in Fig. 5b for Y6 and Fig. 5c for IT-4Cl. In these figures, the energy axis is discounted by the energy of the relaxed molecule in the S1 state with ϕ = 0o (detailed numerical results of the PECs can be found in Tables S4 and S5). Also important for the assessment of the average ISC rates is the population distribution calculated using the partition function defined in eq. (4) and the energies of the PECs. Figure 5f, g plots the normalized S1 population for Y6 (IT-4Cl).
Before discussing how the PECs features influence the ISC process, it is extremely important to analyze the general properties of those curves. By highlighting the similarities and differences of the PECs for singlet (({E}_{{S}_{1}}(phi ))) and triplet (({E}_{{T}_{n}}(phi ))) states, one can identify characteristic angles that determine the most probable excited states configuration of these NFAs. Besides the minima at ϕ = ϕ0 ≈ 0 (that corresponds to the configuration of section 2.1) all PECs tend to have another structural minimum at ϕis (in the range ϕ > 120∘). This minimum is produced by the attractive interaction between the oxygen of carbonyl in the acceptor (dicyanomethylene indanone) and the central carbon in the aliphatic side chain of Y6, see Fig. S7. In the case of IT-4Cl, the interaction is between this oxygen and the central carbon in the bond that links the D and A moieties as shown in Fig. S8. There is a positive polarization of these C atoms due to the close proximity of the negatively charged O when ϕ ≈ ϕis (Figs. S7 and S8). The ϕis for the excited states PECs of each molecule are shown in Table 2. The presence of a longer aliphatic chain shifts ϕis to a smaller angle in Y6 compared to IT-4Cl. The combination of this effect and some aspects related to exchange interactions in Y6 masks the presence of ϕis in the ES1(ϕ) curve of Y6. Yet, this minimum is clearly present in the other PECs of Fig. 5b, c. In the range ϕ > ϕis the PEC rises due to steric interactions between the D-A groups (see again Fig. 5b, c).
It is well known that spatial delocalization tends to stabilize the total energy of the conjugated systems. As ϕ± → 90∘ there is a decreased of the overlap among the π orbitals of the central chemical structure with the π orbital of the rotated acceptor group (discontinuities in the bond length alternation (BLA) along the bonds connecting the two rotating parts of the molecular structure further supports the fact that the conjugation breaks with ϕ rotation, see Figs. S5 and S6). The PEC of the triplet states T1 and T2 have a maximum at ϕ ~ 90∘ (as well as the state S0, see Figs. S1 and S2 in SI) due to conjugation breaking. In clear contrast to the triplet curves, the PEC of S1 have an additional minimum in the range between ϕ0 < ϕ < ϕis at the angle ϕex. This minimum is related to two competing factors associated with the coupling between variations in the electronic structure of the S1 excited states. Despite conjugation breaking when ϕ± → 90∘, the S1 state has an additional contribution that relaxes the total energy, overcompensating the destabilization of the energy associated with more localized orbitals. The increased average distance between unpaired electrons (one in the central core of the molecule and the other in the rotated A edge) minimizes the electrostatic repulsion between them, resulting in a decrease of exchange interactions. The net result of these two effects is not a maximum but a minimum in the S1’s PEC at an angle ϕ = ϕex (close to 90∘). Figure 6 helps clarify this effect by showing the excited states NTOs and the corresponding values of the electron-hole overlap at ϕ ~ ϕex. The reduction of η is clear in relation to the values reported in Fig. 3 (a deeper analysis of other key aspects of Fig. 6 will be developed below).
NTOs of the Y6 and IT-4Cl molecules for the molecular configuration at ϕ = ϕex as extrated from the PEC curves of Fig. 5.
Consequently, unlike the triplet curves, the PEC of S1 has three minima at ϕ0, ϕex and ϕis (these angles are marked in the S1 and T2 curves for the Y6 and IT-4Cl plotted in Fig. 5b and c). Their values for Y6 and IT-4Cl PECs can be found in Table 2. Interestingly, the combination of a reduction of ES1(ϕ) with an increase of ({E}_{{T}_{n}}(phi )) at ϕex narrows the gap between the S1 and T1 PECs which tends to enhance the S1 → Tn intersystem crossing.
An examination of Figs. 3 and 6 reveals a key distinction between Y6 and IT-4Cl. From these figures, the decrease of the S1 electron-hole overlap between the points ϕ = ϕ0 and ϕ = ϕex is higher for Y6 ((Delta {eta }_{{S}_{1}}={eta }_{{S}_{1}}({phi }_{0})-{eta }_{{S}_{1}}(9{0}^{circ })=57.1 %)) compared to IT-4Cl ((Delta {eta }_{{S}_{1}}=56.7 %)). Hence, the reduction of the exchange interaction better compensates the energy increase associated to conjugation breaking in Y6. Indeed, the minimum ES1(ϕex) is lower than ({E}_{{S}_{1}}({phi }_{0})) for this NFA. This means that the most stable configuration of the first singlet excited state of Y6 is the distorted molecule (by the angle ϕex). In contrast, the lowest energy configuration of the S1 state of IT-4Cl remains around ϕ = ϕ0.
The separation between the electron wave function (mainly localized in the edged acceptor moiety) from the hole wave function (mainly localized in central core) for states S1 and T1 is clearly illustrated in Fig. 6. Nevertheless, considering the T2 state, the electron and hole densities share a considerable overlap mainly along non-distorted part of the molecule. This wave function distribution impact the CT-LE character of those states with consequent variations in the spin-orbit coupling. Table 3 reports the HSO calculated for the molecular configurations of Fig. 6 which evidences the correlation between HSO and χTn. It is interesting to note that there is an inversion in the spin-orbit coupling at ϕex relative to ϕ0 for both molecules (it is now stronger for T2 than for T1).
Finally, for smaller systems, it has been reported that second-order corrections to spin-orbit coupling (SOC) around the Franck-Condon (FC) point, induced by molecular vibrations (Herzberg-Teller (HT) corrections), can enhance ISC rates40,41. To investigate this, we evaluated HSO as a function of ϕ for variations around the FC point at ϕ ≈ 0∘. The SOC constants were obtained using the geometries derived from the relaxed scan calculations shown in Fig. 5, with the results presented in Fig. S10. From these calculations, we determined the function that best fits the data points and used it to derive the HT correction term (∂HSO/∂ϕ). We found that ∂HSO/∂ϕ < 10−3 cm−1/o for the two transitions considered (Y6 and IT-4Cl), indicating that this correction is insufficient to account for the observed increase in the ISC rate. Therefore, a large molecular distortion of ϕ emerges as the primary factor contributing to ISC.
The ISC rate for a distorted molecular configuration: theory
In this section, the PECs computed in Fig. 5b, c are used to derive a simple method to access the ISC (rISC) rates. This method is based on a well-established principle of molecular photochemistry which states that the minimum energy of the PEC represents the instantaneous molecular configuration in which the system persists for a relatively long period of time. Hence, the chances to activate a radiationless transition are higher in these points42. Following this principle, it is assumed that the highest probability of ISC for the distorted molecule (ϕ > ϕ0) will occur from S1 (with configuration around ϕex) to states T1 or T2 (with configurations around ϕis). In this model, the transitions from the singlet with configurations around ϕis are ignored because ({E}_{{S}_{1}}({phi }_{is}),gg ,{k}_{B}T). This implies that the population PS1(ϕis) ~ 0 (Fig. 5f, g) in such a way that the net rate from this configuration is negligible.
Before trying to access the ISC rates, it is important to highlight four key points of the PECs calculated in Fig. 5. Those points will help us develop a simplified order-of-magnitude model to estimate kISC:
-
(i)
The PEC of the S1 state is significantly anharmonic between ϕex and ϕis, the local minima of the S1 and Tn PECs for ϕ > ϕ0, respectively;
-
(ii)
There is a small energy gap between S1 and T1 at ϕex ((Delta {E}_{{S}_{1}{T}_{1}}({phi }_{ex})approx) 0.008 (0.045) eV for Y6 (IT-4Cl)) so that ({E}_{{S}_{1}}(phi )) and ({E}_{{T}_{1}}(phi )) avoid crossing43 near this point;
-
(iii)
The T2 curve crosses the PEC of S1 in some point ({phi }^{{prime} }) near ϕex. The activation energy to reach this point is ({E}_{a({S}_{1}{T}_{2})}={E}_{{S}_{1}}({phi }_{ex})-{E}_{{S}_{1}}({phi }^{{prime} })approx) 0.022 (0.014) eV for Y6 (IT-4Cl). These energies are compatible with low frequency vibrational modes that induce variations of ϕ (see Figs. S3 and S4);
-
(iv)
The transitions S1 → T1 and S1 → T2 are coupled by the nuclear vibrations of the S1 state around the minimum at ϕex. Consequently, the probability of the first conversion (S1 → T1) influences the probability of the second conversion (S1 → T2) and vice-versa.
The item (i) suggests that the Marcus-Hush formalism is no longer suitable to calculate the ISC rates, since the extrapolation of the harmonic approximation to nonharmonic regions of the PEC would overestimate the reorganization energy (see the parabolas of Figs. 5d and e). From item (ii), the S1 → T1 transition essentially depends on a tunneling through the (Delta {E}_{{S}_{1}{T}_{1}}({phi }_{ex})) gap, while from item (iii), the S1 → T2 spin-flip depends on a thermal excitation to reach the energy ({E}_{a({S}_{1}{T}_{2})}). Finally, the item (iv) indicates that the transition rates for S1 → T1 and S1 → T2 cannot be calculated independently but are deeply correlated.
In summary, items (i), (ii), (iii) and (iv) above indicate the necessity of an alternative model to estimate the ISC rates beyond the Marcus-Hush approach. Therefore, inspired by the features of the PECs in Fig. 5, an alternative model is proposed to access the ISC rate. Due to the complexity of the phenomena involved, this model is a simplified (order of magnitude) approximation. Thus, we hope that our approach will inspire the development of a more rigorous theory in the future.
Firstly, it is noteworthy that even the highest values of the spin-orbit coupling in Table 3 are still lower than the other characteristic energies of the system. This feature justifies the use of perturbative approaches like the golden rule to estimate the basic frequency of spin conversion. In addition, quantum chemistry calculations indicate that variations of the spin-orbit constant near ϕex are small (see Tables S7 and S8 of the SI). It is then possible to decouple the nuclear oscillation from the spin-orbit effect and assume that HSO is essentially constant when ϕ ≈ ϕex1. In order to consider uphill processes (important for the S1 → T2 conversion), temperature effects are introduced by considering a Boltzmann-populated density of vibrational modes.
After those assumptions, the ISC rate can be rewritten as follows
where Γ is an averaged transmission probability that takes into account the fact that the S1 → T1 and S1 → T2 transitions are coupled by nuclear oscillations of S1. In eq. (3), υ is the quantum number of the vibrational states, υf is the number of quanta necessary to activate the transition, and Pvib(υ) is the relative population of the υth phonons given by,
where Eυ is the energy of the υth vibrational mode. For transitions crossing the singlet-triplet energy gap at ϕex, υf = 0 so that Pvib is determined by zero-point oscillations (with frequency ω). In contrast, for transitions that are thermally activated to reach the S1 − T2 crossing point, υf is the lowest value of υ that satisfies ({E}_{{upsilon }_{f}}=aleph ({upsilon }_{f})hslash omega approx {E}_{a({S}_{1}{T}_{2})}), where ℵ is a quantum number that depends on υ. Under the harmonic approximation, ℵ = υ + 1/2.
One key issue in eq. (3) is the determination of Γ. Under the Condon approximation1, spin-orbit can be considered constant so that the ISC transition is due to an instantaneous “mixing” of the singlet and triplet wavefunctions promoted by HSO. When ϕ = ϕex, the S1 → T1 transition is favored with a probability that depends on the “static” total energy gap (Δ) created by the SO interaction and exchange interactions, (Delta =Delta {E}_{{S}_{1}{T}_{1}}+{H}_{SO,{S}_{1}{T}_{1}}). On the other hand, the singlet-triplet mixing created by the spin-orbit Hamiltonian opens a smaller gap (({Delta }^{{prime} }={H}_{SO,{S}_{1}{T}_{2}})) at ({phi }^{{prime} }) that favors the S1 → T2 conversion. Figure 7 schematically illustrates the basic physics behind this modeling of the PEC curves in Fig. 5 (other characteristics of the model in Fig. 7 will be clarified below).
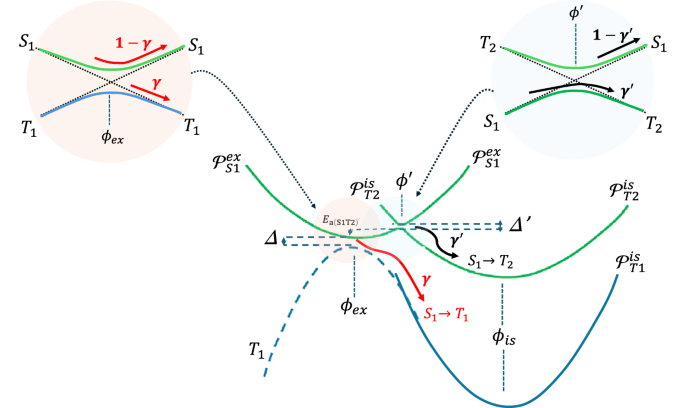
The figure illustrates the effects of the spin-orbit coupling mixing on the adiabatic curves. γ and ({gamma }^{{prime} }) are, respectively, the probabilities of the S1 → T1 and S1 → T2 conversions for the first passage along the coordinates ϕex or ({phi }^{{prime} }) of the system that oscillates following the ({{{{mathcal{P}}}}}_{{S}_{1}}^{ex}(phi )) curve. ({{{{mathcal{P}}}}}_{{S}_{1}}^{ex}), ({{{{mathcal{P}}}}}_{{S}_{1}}^{is}) and ({{{{mathcal{P}}}}}_{{T}_{2}}^{is}) are the harmonic curves that approximate the S1, T1 and T2 potential energy of Fig. 5 curves in the vicinities of ϕex (singlet) and ϕis triplets, respectively.
As schematically pictured in Fig. 7, S1 → T1 transition (process 1) depends on a non-adiabatic tunneling across Δ whereas the S1 → T2 conversion (process 2) depends on relaxing across the ({Delta }^{{prime} }) gap. Consequently, Γ is determined by an average of multiple scattering processes resulting from sequential passages near the points ϕex and ({phi }^{{prime} }) promoted by vibrational oscillations. Assume that γ is the initial probability of S1 → T1 transition at ϕ = ϕex and ({gamma }^{{prime} }) the corresponding probability of S1 → T2 conversion at (phi ={phi }^{{prime} }) (the initial state of the system is a superposition of these two configurations). In principle we suppose, that Γ can be computed using a simple multiplication scheme followed by statistically independent processes (represented by the probabilities γ and ({gamma }^{{prime} })). Using a graphical representation described in Fig. S5 (and averaging the two possible initial conditions), it is possible to demonstrate that (Gamma =(gamma /2){C}_{gamma gamma }^{N}) for process 1 while the corresponding probability for process 2 is (Gamma =({gamma }^{{prime} }/2){C}_{{gamma }^{{prime} }gamma }^{N}), where N is the number of oscillations. The coefficients ({C}_{gamma {gamma }^{{prime} }({gamma }^{{prime} }gamma )}^{N}) are formed by a convergent series of ((1-gamma )times (1-{gamma }^{{prime} })) powers. They essentially compute the probability that the system will remain in state S1 after N oscillations (see SI). Those coefficients converge to ({C}_{gamma {gamma }^{{prime} }}^{N}=(2-{gamma }^{{prime} }){[1-(1-gamma )(1-{gamma }^{{prime} })]}^{-1}) when N > 1 (({C}_{{gamma }^{{prime} }gamma }^{N}) is obtained simply by replacing ({gamma }^{{prime} }(gamma )) by (gamma ({gamma }^{{prime} })). The number of oscillations in those expressions is essentially limited by the S1 lifetime (({tau }_{{S}_{1}})), so that (N={tau }_{{S}_{1}}omega). For the molecules and frequencies considered here, N > 100. The above approximation for ({C}_{gamma {gamma }^{{prime} }({gamma }^{{prime} }gamma )}^{N}) is then very reasonable. In section S9 of SI, we prove that the above results are compatible with a more rigorous quantum walk formalism (at least for N = 1) based on the scattering matrix44,45,46. The idea is that the transitions between the singlet and the triplet states can be mapped by a one-dimensional quantum walk graph where two scattering points (that represent the coordinates ϕex and ({phi }^{{prime} })) have matrices elements given by (sqrt{gamma }(sqrt{{gamma }^{{prime} }})) for transmission and (sqrt{1-gamma }(sqrt{1-{gamma }^{{prime} }})) for reflection.
Once Γ is quantified, the ultimate calculation of kISC (using eq. (3) depends on the determination of the probabilities γ and ({gamma }^{{prime} }). At this point, it will be assumed that they are reasonably given by the Landau-Zener (LZ) tunneling theory, or43,47
In eq. (5), w is the Landau-Zener velocity and (s=| partial ({E}_{{S}_{1}}(phi )-{E}_{{T}_{n}}(phi ))/partial phi {| }_{phi = {phi }^{* }}). (,{mbox{w}}({{mbox{w}}}^{{prime} })) and (s({s}^{{prime} })) can be calculated taking ({phi }^{* }={phi }_{ex}({phi }^{* }={phi }^{{prime} })), respectively. In a classical interpretation, s and w can be viewed as the net “force” and the velocity (kinetic energy), respectively, associated with the vibration that drives the tunneling process. The exponentials arguments in eq. (5), (delta ={Delta }^{2}/4hslash ,{mbox{w}}s({delta }^{{prime} }={Delta }^{{prime} 2}/4hslash {{mbox{w}}}^{{prime} }{s}^{{prime} })), are called the adiabaticity parameter48. They control the nature (adiabatic or non-adiabatic) of the processes at the critical coordinates ϕex and ({phi }^{{prime} }). For instance, consider the S1 → T1 process at ϕex in Fig. 7. When δ ≫ 1, the nuclear motion is not able to activate the non-adiabatic transition to T1 at ϕex and the system remains in the adiabatic curve of the S1 state because γ ≈ 0 (adiabatic regime). On the other hand, when δ ≪ 1, there is a considerable chance that the system will non-adiabatically jump to T1 since γ ≈ 1. Interestingly, this logic is reversed for the S1 → T2 transition (controlled by the parameter ({delta }^{{prime} })). This is due to the inversion in the sequential variation between the adiabatic levels when comparing the transitions at ϕex and ({phi }^{{prime} }) (as illustrated in the upper left and right corners of Fig. 7). The intermediary regime, when (delta ({delta }^{{prime} }),lesssim, 1), is called a slow-driven regime in the literature of the LZ transition47,48. In order to maximize the ISC process, it is necessary that δ ≪ 1 and ({delta }^{{prime} },gg, 1) which means that the S1 → T1(2) transitions must have a strong non-adiabatic nature. This condition is observed when ({delta }_{T}backsim {delta }^{{prime} }), where ({delta }_{T}=delta +{delta }^{{prime} }).
In order to calculate the parameters in eq. (3), we assume the harmonic approximation and fit four parabolas (represented by ({{{mathcal{P}}}})), two in the PEC of S1 (at ϕ0, ({{{{mathcal{P}}}}}_{{S}_{1}}^{0}) and ϕex, ({{{{mathcal{P}}}}}_{{S}_{1}}^{ex})) and one in the respective PEC of the triplet states at ϕis (({{{{mathcal{P}}}}}_{{T}_{n}}^{is})). Figure 5d, e plot these parabolas derived from the PEC of Y6 (IT-4Cl) molecule (Figs. 5b(c)). The curves used to calculate the ISC rate are ({{{{mathcal{P}}}}}_{{S}_{1}}^{ex}), ({{{{mathcal{P}}}}}_{{T}_{1}}^{is}) and ({{{{mathcal{P}}}}}_{{T}_{2}}^{is}) whereas ({{{{mathcal{P}}}}}_{{S}_{1}}^{0}) will be applied to estimate the phonon-driven rate ϕ0→ ϕex (see section 2.4). Following this approximation, Eυ in eq. (4) is the eigenvalues of the harmonic oscillator with frequency ω. As mentioned before, the parameter w in eq. (5) is related to the nuclear kinetic energy, or (,{mbox{w}},=sqrt{2{omega }^{2}[aleph ({upsilon }_{f})hslash omega +{E}_{{S}_{1}}({phi }_{ex})-{E}_{{S}_{1}}({phi }^{* })]/{c}_{{S}_{1}}}), where ({c}_{{S}_{1}}) is the “spring” coefficient of the ({{{{mathcal{P}}}}}_{{S}_{1}}^{ex}(phi )={c}_{{S}_{1}}{(phi -{phi }_{ex})}^{2}+{E}_{{S}_{1}}({phi }_{ex})) curve in Table S6 of the SI. We are going to assume ω ≈ 100 cm−1, typical nuclear vibrational frequency47, see Figs. S3 and S4 of the SI. In the same way, under those approximations, (s=| 2({c}_{{S}_{1}}-{c}_{{T}_{n}}){phi }^{* }+2{c}_{{T}_{n}}{phi }_{is}+2{c}_{{S}_{1}}{phi }_{ex}), where are the respective “spring” coefficient of the triplet parabolas is taken ({{{{mathcal{P}}}}}_{{T}_{n}}^{is}(phi )={c}_{{T}_{n}}{(phi -{phi }_{is})}^{2}+{E}_{{T}_{n}}({phi }_{is})). Finally, under those assumptions, the coordinate ({phi }^{{prime} }) is found by solving ({{{{mathcal{P}}}}}_{{S}_{1}}^{ex}({phi }^{{prime} })={{{{mathcal{P}}}}}_{{T}_{2}}^{is}({phi }^{{prime} })). Figure 7 summarizes the basic assumption of the model by illustrating the tunneling processes considered in eq. (5) and the role of the parabolas ({{{{mathcal{P}}}}}_{{S}_{1}}^{ex},{{{{mathcal{P}}}}}_{{T}_{1}}^{is}) and ({{{{mathcal{P}}}}}_{{T}_{2}}^{is}) to approximate the potential energy curves. To avoid further expensive calculations, we assume the values of HSO from Table 3. The coefficients of the parabolas ({{{{mathcal{P}}}}}_{{S}_{1}}^{ex},{{{{mathcal{P}}}}}_{{T}_{1}}^{is}) and ({{{{mathcal{P}}}}}_{{T}_{2}}^{is}) for both NFAs are shown in Table S6.
Fortunately, a particular feature of the system under consideration further simplifies the calculation of the ISC rates using the above formalism. For both NFAs studied, the activation energy ({E}_{a({S}_{1}{T}_{2})}={E}_{{S}_{1}}({phi }^{{prime} })-{E}_{{S}_{1}}({phi }_{ex}) sim aleph ({upsilon }_{f})hslash omega). This makes ({{mbox{w}}}^{{prime} }approx 0) so that ({delta }^{{prime} },gg, 1) and ({gamma }^{{prime} }approx 1) in eq. (5). The physical interpretation of this condition is straightforward: after dissipating the activation energy (({E}_{a({S}_{1}{T}_{2})})) at ({phi }^{{prime} }), the system does not have enough momentum to perform an “upward” tunnel across the ({Delta }^{{prime} }) gap in direction of the S1 adiabatic state. Hence, the system then naturally relaxes to follow the ({E}_{{T}_{2}}(phi )({{{{mathcal{P}}}}}_{{T}_{2}}^{ex}(phi ))) curve. This effect further simplifies the probability Γ in eq. (3) to
In other words, the ISC rate is essentially limited by the probability of non-adiabatic transition expressed by the factor γ in eq. (5). Hence kISC of the S1 → T1 conversion is found using eq. 6a in eq. (3) whereas kISC of S1 → T2 is evaluated using eq. 6b in eq. (3). These rates are shown in Table 4 together with the value of other relevant parameters to calculate them.
Lastly, it is important to note that the 1D approach proposed here is based on the assumption that vibrations altering ϕ dominate over other coordinate variations in determining the ISC rate. This assumption simplifies the analysis by avoiding the inherently complex problem of identifying the ensemble of normal modes (and their coordinate variations) that contribute most significantly to the process–a major challenge in state-of-the-art research in the field of molecular photophysics49,50. Despite these simplifications, our method provides reasonable results and helps to develop a clear physical understanding of the primary effects influencing the ISC phenomenon in NFAs.
The ISC rate for a distorted molecular configuration: Application to Y6 and IT-4Cl
Before considering ({bar{k}}_{ISC}), let us analyze the reasons (besides the changes of HSO) behind the enhance ISC rates when ϕ oscillates around ϕex. As discussed above, the role played by exchange interactions decreases the energy gap between the singlet and the triplet states. This reduction mostly impacts the S1 → T1 gap, which becomes considerably lower compared to the molecule in the undistorted configuration. The reduction in the gap is more notable for the (Delta {E}_{{S}_{1}{T}_{1}}) of Y6 that drops from 0.470 to 0.008 eV. For the IT-4Cl, (Delta {E}_{{S}_{1}{T}_{1}}) shrinks from ~ 0.500 eV to 0.045 eV. For both NFAs, ({E}_{a({S}_{1}{T}_{2})}) decreases significantly when compared to values in Table 2 (obtained from the Marcus-Hush theory) as can be verified by an inspection to Table 4.
It is interesting to note that ({k}_{{S}_{1}{T}_{2}}) is around three orders of magnitude higher than ({k}_{{S}_{1}{T}_{1}}) for both molecules. The reason is the stronger influence of the SOC in the ISC rate when the activation energy approaches kBT. In the distorted configuration states S1 and T1 becomes almost degenerated so that they share a strong CT character. As a consequence, ({H}_{SO,{S}_{1}{T}_{1}}) decreases while ({H}_{SO,{S}_{1}{T}_{2}}) increases since the character of the T2 almost does not change with the variation of ϕ. Therefore, in principle the S1 → T2 transition remains the main channel for the ISC process even in the presence of vibrations that change ϕ. For IT-4Cl molecule, there is a higher energy gap between the S1 and T1 PECs at ϕ = ϕex (see Fig. 5c and Table 4). Hence the triplet state preserves its character which enhances ({H}_{SO,{S}_{1}{T}_{1}}) compared to Y6 (see Table 3). It is important to note that this molecule has a (Delta {E}_{{S}_{1}{T}_{2}}) gap of 0.06 eV at ϕ = ϕex. Therefore, in principle, the total S1 → T2 rate for IT-4Cl comes from tunneling through the gaps at ϕex and ({phi }^{{prime} }). However, the rate resulting from the former process is one order of magnitude lower than the rate coming from the latter tunneling. Hence the tunneling through ({Delta }^{{prime} }) remains prevalent for the S1 → T2 spin-flip of IT-4Cl. To briefly summarize the discussion above, large variations of the angle ϕ may greatly enhances the ISC rate due to a combination of stronger HSO together with lower (Delta {E}_{{S}_{1}{T}_{1}}) and ({E}_{a({S}_{1}{T}_{2})}) energies.
At this point, we finish our considerations about the ISC rates by referring to the adiabaticity parameter δ in Table 4. It indicates that the overall ISC process in Y6 is more “optimized” compared to IT-4Cl, since non-adiabatically nature of the S1 → T1 conversion is greater in this molecule because δY6 ≪ δIT−4Cl (in the ITIC derivative the S1 → T1 transition is closer to the “slow” driving limit). This result is essentially a consequence of the very low (Delta {E}_{{S}_{1}{T}_{1}}) gap of the Y6 at ϕ = ϕex.
As discussed above, the final ISC rate is an average weighted by the relative population (P) of conformers as determined in eq. (2) (see Fig. 5f, g). A very fast ({k}_{{S}_{1}{T}_{2}}) would only influence ({bar{k}}_{ISC}) if ({P}_{{S}_{1}}({phi }_{ex})) is relevant. In the case of Y6, the total minimum of the S1 PEC is exactly at ϕex. As a result, this configuration has the highest fraction of conformers (0.536) compared to the minimum at ϕ0 (0.0055). Therefore, the average ({bar{k}}_{ISC}) of Y6 calculated from eq. (2) is dominated by the value of the ISC rate for the S1 → T2 transition in Table 4 (in opposition to the lower value of the equivalent rate in Table 2). This gives ({bar{k}}_{ISC}=1.26times 1{0}^{8}) s−1. The S1 → T1 transition at ϕex was also considered in eq. (2) to find ({bar{k}}_{ISC}) but its contribution is minor due to the lower value of the respective ({k}_{{S}_{1}{T}_{1}}) rate. Assuming an average S1 lifetime (({tau }_{{S}_{1}})) in Y6 of 225 ps39 and writing the ISC quantum yield as (Phi ={bar{k}}_{ISC}{tau }_{{S}_{1}}), one obtains Φ = 2.83% which is in good agreement with the experimental value (3%15).
Turning now to the IT-4Cl, the population of conformers is more distributed compared to Y6 (see Fig. 5) with the highest fraction at ϕ0 (0.242). Yet a considerable fraction of conformers is also found at ϕex (0.070) and ϕis (0.103) which increases the average ISC rate to ({bar{k}}_{ISC}=2.37times 1{0}^{7}) s−1. This rate is essentially dominated by ({P}_{{S}_{1}}({phi }_{ex})) population since ({k}_{{S}_{1}{T}_{2}}) is higher when ϕ = ϕex (see Table 4). Here it is important to mention that we did consider the possibility of a ISC transition between the ({{{{mathcal{P}}}}}_{{S}_{1}}^{is}) and ({{{{mathcal{P}}}}}_{{T}_{1}}^{is}) parabolas (indeed ({{{{mathcal{P}}}}}_{{S}_{1}}^{is}) is also shown in Fig. 5) but this process is improbable since they do not have a crossing point in the range 0∘ < ϕ < 180∘. Given the ({bar{k}}_{ISC}), an assuming an exciton lifetime close to the IT-2Cl (({tau }_{{S}_{1}}approx 400) ps)15, one gets (Phi ={bar{k}}_{ISC}{tau }_{{S}_{1}} sim 0.93 %).
Those results suggests that Y6 molecule is more efficient to generate triplet excitons by ISC than the IT-4Cl molecule. Measurements employing the sensitization procedure in chloroform solution indicated a higher initial population of triplet excitons in Y6 compared to three other NFAs belonging to the ITIC family (including IT-2F)51. The initial population of triplet excitons in Y6 is the double of the ITIC population. In essence the improved capacity of the Y6 to generate triplet states is linked to a stronger reduction of the positive exchange interaction between unpaired electrons promoted by the geometrical distortion of the molecule52. This vibrational-driven distortion overcompensates the energy destabilization associated to a break in the π conjugation.
The calculations to estimate Φ ignored the possible limitations imposed by the capacity of the system to relax to ϕ = ϕex after light absorption (the great majority of the molecules populates the ϕ = ϕ0 conformer in the S0 state, see Figs. S1 and S2). If the chain dynamics is fast relative to ISC rates, then the slower process is rate limiting; if chain dynamics is slow compared to ISC, then the former is rate limiting. Therefore, a reliable picture of ISC phenomena can only be achieved after addressing this contribution (section 2.4).
Closing this section by inspecting again Fig. 5b, c. In those PECs the energy gaps for rISC, although lower compared to the undisturbed molecule, are still considerably high. In fact, (Delta {E}_{S1Tn}={E}_{{S}_{1}}({phi }_{ex})-{E}_{Tn}({phi }_{is}),gg, {k}_{B}T) which tends to increase the rISC activation energy. For instance, using the results in Fig. 5 and assuming a fast internal conversion T2 → T1, (Delta {E}_{{S}_{1}{T}_{1}}={E}_{{S}_{1}}({phi }_{ex})-{E}_{{T}_{1}}({phi }_{is})approx) 0.21(0.49) eV for Y6 (IT-4Cl). Therefore, the rISC rate remains low despite the distortions of ϕ considered here. This result suggests that (spin-orbit driven) TADF effects are unlikely in those NFAs42.
Influence of ϕ
0 → ϕ
ex chain dynamics on ISC
Figures S1 and S2 shows the relaxed PEC and the relative conformer population (calculated assuming a partition function as in eq. (2)) of the ground state (S0) for Y6 (IT-4Cl), respectively. These figures indicate that the great majority of the rotational conformers are near ϕ0 in the S0 state. Taking into consideration the Frank-Condon Principle53, the S0 → S1 excitation upon light absorption occurs with a nuclear configuration around ϕ0, the angle of lowest energy of the fundamental state. However, a key assumption behind eq. (2) is the derivation of a canonical partition function for the molecular system in the S1 excited state (with a thermal equilibrium between the configurations around ϕ0 and ϕex). As a consequence, eq. (2) is justified only if the phonon-induced distortion ϕ0 → ϕex (represented by kex) is fast enough to populate the vibrational states around ϕex before S1 decays to S0. Here we will develop this discussion by referring to the S1 PECs of Y6 and IT-4Cl molecules in Fig. 5b and c, respectively. Details of these curves, together with the parabolas ({{{{mathcal{P}}}}}_{{S}_{1}}^{0}) and ({{{{mathcal{P}}}}}_{{S}_{1}}^{ex}), are illustrated in Fig. 8 ((a) for Y6 and (b) for IT-4Cl) where the potential barrier (φ) for the ϕ0 → ϕex transition is also shown.
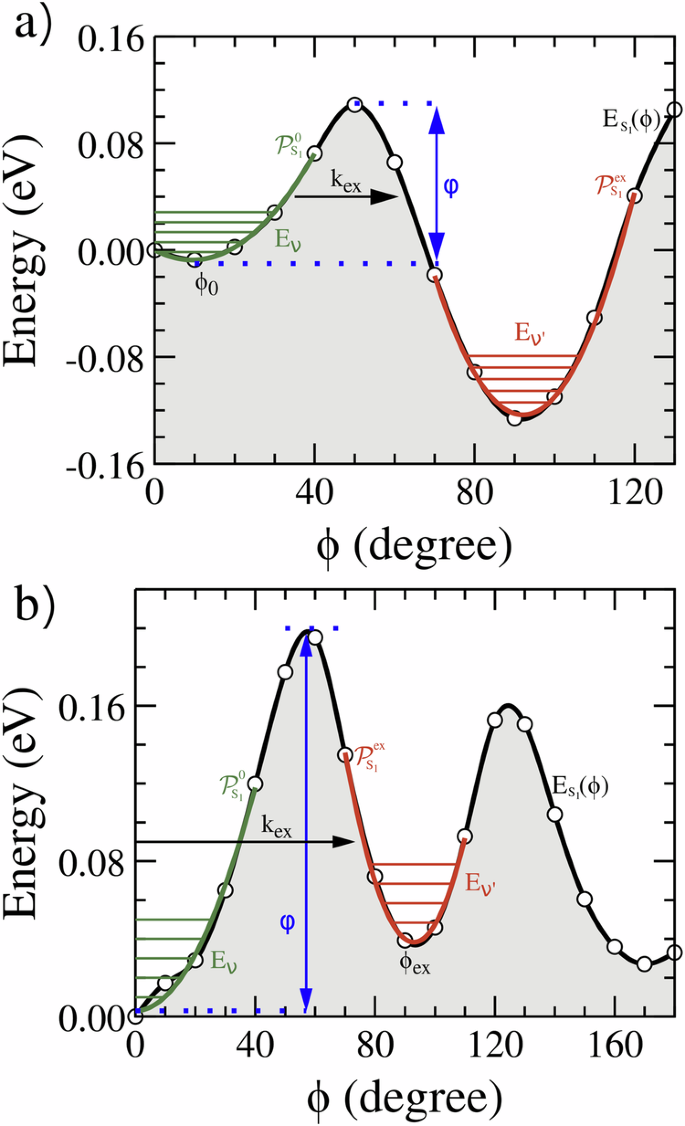
Details of S1 PEC curves from Fig. 5 for Y6 (a) and IT-4Cl (b), together with the respective parabolas ({{{{mathcal{P}}}}}_{{S}_{1}}^{0}) and ({{{{mathcal{P}}}}}_{{S}_{1}}^{ex}), and the potential barrier (φ) for the ϕ0 → ϕex conversion. The horizontal lines plotted at the minima of the PEC illustrate the harmonic oscillator’s eigenvalues.
In the sequence, kex will be derived by considering that the ϕ0 → ϕex transition is driven only by vibrations populated assuming a thermal equilibrium between the molecule and the environment at room temperature. Therefore, it neglects the possibility that photon absorption (that produce the S0 → S1 electronic transition) can excite higher vibrational levels. Below, it is estimated the kex by considering the tunneling probability (Tυ) of the υth vibrational mode in ({{{{mathcal{P}}}}}_{{S}_{1}}^{0}) to cross the classical forbidden region (with a barrier height φ, see Fig. 8) that separates the two minima at ϕ0 and ϕex. In the following we will assess Tυ by using the Wentzel-Kramers-Brillouin (WKB) approximation15 that is more convenient to access the transmission coefficient across potential energy barriers with profiles similar to those in Fig. 8. Hence,
where ω is the frequency of the vibrational mode that changes ϕ, υf is the number of quanta with energy below φ, or υf = [(φ/ℏω) − 1/2] and Pvib(υ) is given by eq. (4) with Eυ = [(2φ + 1)(ℏω/2)]. The tunneling probability under the WKB approximation is,
where ϕ1 and ϕ2 are the left and right potential barrier limits for the energy ({E}_{{S}_{1}}({phi }_{0})+{E}_{upsilon }), respectively. meff is the effective mass evaluated by considering an idealized mass-spring harmonic oscillator so that meff = c1/ω2 where c1 is the “spring” coefficient of ({{{{mathcal{P}}}}}_{{S}_{1}}^{0}(phi )={c}_{1}{(phi -{phi }_{0})}^{2}+{E}_{{S}_{1}}({phi }_{0})) in Table S6. Finally, a further simplification to access the relaxation rate (that is useful to check the results given by eq. (7) is,
where ({P}_{vib}^{0}) is relative population of the fundamental vibrational state with υ = 0 in eq. (3). From the ES1(ϕ) curve in Fig. 8a, b, φ = 0.116(0.191) eV for the Y6 (IT-4Cl) molecules.
The vibrational analysis of the S1 state for Y6 (IT-4Cl) (the level of theory is detailed in section 2.4) indicates that the lowest energy vibrational mode that produces a significant variation of ϕ has the frequency around 107.93 (109.36) cm−1 (the atomic displacement associated to this mode are illustrated in Figs. S3 and S4). Using the results in section 2.3 for the Y6 molecule and eq. (7), one finds kex = 2.3 × 10¹⁰ s−1. The simplified theory from eq. (7) gives kex = 1.5 × 10¹⁰ s−1. Focusing now on the IT-4Cl molecule, the higher value of φ substantially decreases the relaxation rate to kex = 6.0 × 10⁸ (8.36 × 10⁸) s−1 using eq. (7) and (9).
Since ({k}_{ex},gg, {bar{k}}_{ISC}) for Y6 while ({k}_{ex} , > , {bar{k}}_{ISC}) for IT-4Cl, both molecules are able to pump a relevant fraction of molecules to the distorted conformation prior to exciton recombination. This result indicates that ({bar{k}}_{ISC}) is indeed the slower process (rate limiting), so (Phi ={bar{k}}_{ISC}{tau }_{{S}_{1}}) is a reasonable expression to quantify the ISC quantum yield.
However, a fast kex chain relaxation has consequences for the photoluminescence properties of the molecules. Since photoluminescence is a key process that is intrinsic related to the photovoltaic effect, it is important to conclude our work by briefly discussing the correlation between ISC and photoluminescence.
Discussion: some consequences to the photoluminescence
One of the most striking results of our calculations is the fact that the stable configuration of the Y6 first excited state is the distorted structure that tends to have a weak emission (lower oscillator strength) for the S1 → S0 transition. The lower oscillator strength is due to the break of the conjugation length induced by the molecular distortion that tend to localize the electronic states (see Fig. 6). On the other hand, the stable S1 configuration of IT-4Cl is the undistorted molecule which preserves a strong S1 → S0 emission. Hence, a direct consequence of our analysis is that the IT-4Cl molecule might have a higher photoluminescence (PL) efficiency compared to the Y6 molecule.
In addition, the theory proposed here implies that the photoluminescence of Y6 must have a strong dependence on the temperature derived from eq. (9). As T decreases, the total probability of the ϕ0 → ϕex distortion decreases, which increases the fraction of emitting undistorted conformers. Hence, the total PL increases as the system cools down. Assuming (PLpropto {P}_{{S}_{1}}({phi }_{0})) and a simple balance equation to relate the population ({P}_{{S}_{1}}({phi }_{0})) with the characteristic rates in the form ({P}_{S1}({phi }_{0})=I-({tau }_{{S}_{1}}^{-1}+{k}_{ex}){P}_{{S}_{1}}({phi }_{0})), the steady-state PL would be,
where I is the rate of exciton generation upon light absorption. Neglecting variations of ({tau }_{S1}^{-1}) and I with T, eq. (10) suggests that the PL dependence on the temperature is essentially given by kex calculated from eq. (7). We check this idea by comparing the experimental PL dependence on temperature of Y6 with the behavior predicted by those equations. This analysis is plotted in Fig. 9 where the experimental data were taken from Fig. 4d of ref. 54. One can see that (except for deviations at higher temperatures) the theory well describes the PL dependence on T, once the theoretical results in Fig. 9 have a mean absolute error of 0.07 in relation to the experimental data. This result further supports the theory and results discussed above. The model’s limitations at higher temperatures are expected because eq. (10) ignores the variation of the exciton lifetime with temperature. Additionally, kex is calculated assuming a tunneling transition thought the potential barrier between the configurations, a process that ignores other possible thermally assisted distortions (the errors associated to tunneling transmission coefficient estimated by the WKB tends to increase when the vibrational modes have energies comparable to φ. Since those modes are only populated at higher temperatures, a deviation of the theoretical curve is expected with increasing T).
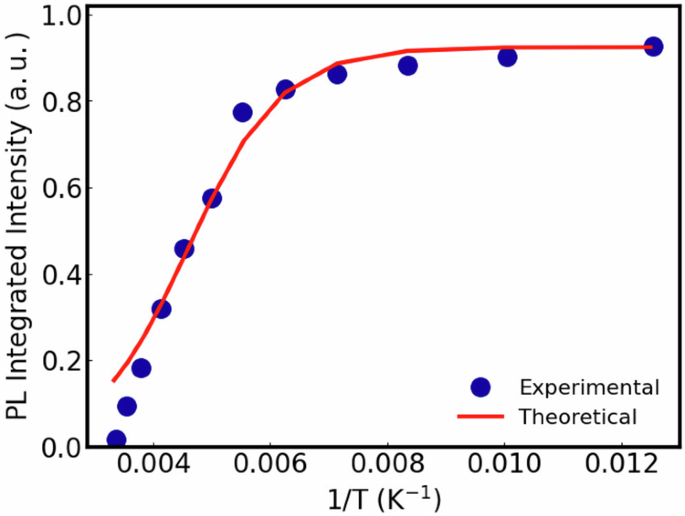
The parameters used to calculate the theoretical curve are the same used in sections 2.2 and 2.4 for the Y6. The experimental data were taken from Fig. 4d of ref. 54.
Conclusion
An extensive analysis of the ISC (and rISC) processes induced by spin-orbit coupling (SOC) in 10 NFAs was developed. We observe a correlation between the SOC and the reorganization energy, where higher spin-orbit coupling results in lower reorganization energy, and vice versa. Additionally, there is a relationship between the degree of mixing of local and non-local charge transfer character in singlet and triplet states with SOC. We define this parameter as χ, where a higher value of χ reflects a greater SOC. Another important factor is the activation energy, which is higher for the S1 → T1 transition, indicating that a transition to the T2 state occurs first, followed by a possible non-radiative transition to the T1 state. However, the calculated rates suggest a low quantum yield of ISC compared to experimental data, indicating the need to consider the influence of conformational distortions of the molecule for a deeper understanding of ISC.
In the second part, we then focused solely on the Y6 and IT-4Cl molecules. For these two NFAs, we calculated the potential energy curve (PEC) of the excited states as a function of the dihedral angle ϕ, which connects the donor and acceptor regions of the molecule. Additionally, we identified the specific characteristics of the PEC for singlet and triplet states that are crucial for the ISC process. In particular, we found that the presence of an additional minima in the PEC of S1 at ϕ = ϕex ≈ 90o is essential to enhance SOC. This minimum derives from a reduced exchange interaction that overcompensates the destabilization associated with more localized orbitals. We observed that these distortions in ϕ can significantly improve the ISC process due to a combination of stronger SOC and reduced “local” singlet-triplet gap. In the presence of ϕ vibrations, the S1 → T1 and S1 → T2 transitions become coupled. A simple method to calculate the coupled probabilities to determine the ISC rates is then proposed. We show that these probabilities can be alternatively calculated using a quantum walk in a one-dimensional graph. Pondering the resulting rates by population of conformers, the values of the averaged ISC rate becomes consonant with the measured ISC quantum yield.
Comparing Y6 and IT-4Cl, we find that the Y6 molecule demonstrates superior efficiency in generating triplet excitons, whereas the IT-4Cl molecule exhibits more limited efficiency. This result is confirmed by measurements employing the sensitization procedure in chloroform solution. Additionally, the Wentzel-Kramers-Brillouin approximation method was employed to estimate the rate of vibration-induced relaxation (kex), allowing for a quantitative assessment of the efficacy of molecular vibrations to promote the chain distortion necessary for ISC. Since this phenomena is intrinsic linked to photoluminecesce, the theory was tested against measurements of the Y6’s PL with the temperature. We show that it is in agreement with those data in the low T range.
These findings not only contribute to a deeper understanding of the fundamental mechanisms involved in photophysics but also provide valuable insights for the development of new materials for optoelectronic applications, with enhancements in triplet generation. Our analysis also underscores the importance of non-adiabatic phenomena in ISC, evidencing the complexity of spin transfer processes in organic semiconductors. It ultimately emphasizes the importance of further investigations into the role of molecular vibrations in modulating these processes.
Calculation details
The calculations necessary to access the ISC (rISC) processes in the NFAs of Fig. 2 were performed using the density functional theory (DFT)55,56 and its time-dependent version (TD-DFT)57 as implemented in the Gaussian 16 package58. The calculation of the SOC constant (HSO) was performed using Gaussian16 and PySOC package in python359.
The ground state geometry of the NFAs were obtained using the Becke three-parameter Lee-yang-Parr (B3LYP) hybrid functional60, along with a split-valence double-zeta polarized (6-31G (d,p)) basis set based in Gaussian type orbitals (GTOs)61. After finding the ground state geometry, a fine tuning is made using the same basis set with the range-separation parameter (ω) from Becke’s 97 empirical-corrected dispersion (ωB97XD) functional62, which is capable of capturing short- and long-range interactions. Simultaneously with the ω tuning, the continuous polarizable model63 (PCM) was used to simulate the molecule immersed in continuous dielectric medium, in order to stabilize the molecular energies64. It was verified that the simultaneous application of these gives molecular energies in better agreement with experimental data64,65. The dielectric constants required for PCM of hypothetical continuous media formed by each molecule were taken from the references13,66 and are available in Table S1 in support information (SI). The ω tuning can be easily obtained by minimizing J(ω)67:
where EHOMO (ω) and ELUMO (ω) are the energies of HOMO and LUMO while, IP(ω) is the vertical ionization potential and EA(ω) is the electronic affinity of the material, obtained from the total energies of the cationic (E+), anionic (E−) and neutral (E0) states by the expressions IP = E+ − E0 and EA = E0 − E−.68,69
All geometry optimizations of the excited singlet (S1) and triplet (T1, T2) electronic state were performed using the ω-tuned TD-DFT, ωB97XD/6-31G (d,p) method described above. These optimizations followed a sequential procedure, starting from the lowest-energy geometry of the ground state (S0). This geometry corresponds to the orientation of the molecule’s central fused-ring core relative to the acceptor groups at the edges as shown in Fig. 1. The minimum energy of the S1 state is then found using the S0 geometry as input. In the sequence, the lowest energy structure of T1 is obtained running an optimization of the S1 geometry as starting configuration. Finally, the T2 minimum is determined beginning the optimization using the minimum of S1 as initial geometry. The same method was used to obtain (lambda {prime} s). As indicated in Fig. 2, the reorganization energies were evaluated by directly calculating the energies of the initial excited states at a specific geometry corresponding to the minimum of the final state (see the caption of Fig. 2). The spin-orbit coupling constants were evaluated at the TD-DFT optimized geometries of the excited sates (the points of minimum in the curves of Fig. 2b).
In the second part of our work, Y6 and IT-4Cl were selected to study the influence of modifications on the dihedral angle (ϕ) between the donor core and one of the acceptor moieties at the edge of the molecule. Those were the NFAs with the lowest ISC (rISC) activation energies calculated in the first part of the study.
First, a relaxed potential energy curve (PEC) scan was performed to compute the total energy of the ground state and the excited states S1, T1 and T2 as a function of ϕ. A relaxed PEC allows the other degrees of freedom in the molecule to adjust, minimizing the total energy after a rigid modification of the dihedral angle. Typically, in the literature on NFAs, due to the high computational cost, this procedure is only performed for the ground state, with the geometry of the excited states being overlooked70,71. The PEC (E(ϕ)) of the excited states was computed using TD-DFT for ϕ ranging from 0 to 180 degrees in 10-degree increments. The optimized geometries obtained in the previous calculations were assumed to be ϕ = 0∘. These geometries essentially preserves the orientation between the donor core and acceptor moieties of Fig. 1. Again, the PCM method with the same dielectric constants (4.88 for IT-4Cl and 3.36 for the Y6, see refs. 1366) was applied in the PEC scan.
A continuous function for the PEC profile is generated and the total and local minima of these curves are identified (corresponding to the angles ({phi }_{i}^{{prime} }s)). Assuming a harmonic approximation, a set of parabolas corresponding to the states S1, T1, and T2 are then fitted to the region around ϕi. Based on the PECs curves, calculated by quantum chemistry methods, we will propose a model used to estimate the ISC (rISC). This approach will be detailed in section 2.2 since it is part of this work’s results. The HSO values required to calculate the rates are estimated following the same approach described above. After computing the parameters, the corresponding ISC (rISC) rates (k(ϕi)) in the range (ϕ > 0∘) are obtained. The rates at (ϕ = 0∘) were the ones found the initial optimized geometry. After obtaining k(ϕi), the final rate (({bar{k}}_{(r)ISC})), is accessed by weighting the “local” rates by the relative population P(ϕi) of the rotational isomers at room temperature or,
where E(ϕi) is the PEC of the initial state (S1 for ISC), E0 is the energy reference taken as the lowest minimum of the S1 PEC, N is the number of local (total) minima (in general there are two relevant points so that N = 2) in the PEC, and (Z={sum }_{j}{e}^{left[frac{E({phi }_{i})-{E}_{0}}{{k}_{B}T}right]}) is the partition function of the initial state. The function Z was build using the 19 points obtained from the TD-DFT relaxed energy scan.
Finally, a vibrational analysis of the S1 excited state of Y6 and IT-4Cl was conducted, where the excited states were obtained through optimizations performed via TD-DFT. These calculations were performed to map vibrational modes that produce variations in angle ϕ, as will be seen in section 2.2.
Responses