Dysregulated autoantibodies targeting AGTR1 are associated with the accumulation of COVID-19 symptoms

Introduction
The dysregulation of neutralizing autoantibodies (AABs) is associated with the clinical severity of severe coronavirus disease 2019 (COVID-19). Bastard et al. 1,2 characterized the presence of high titers of neutralizing AABs against interferons (IFNs), which are essential molecules for the immune response against viruses3, including severe acute respiratory syndrome virus 2 (SARS-CoV-2), and found that these high titers were associated with an increased susceptibility to COVID-19-associated pneumonia and death. A subsequent study revealed that diverse functional AABs, including those targeting cytokines (e.g., IL-1B and IL-6), chemokines (e.g., CCL11 and CXCL26), complement components (e.g., C5A and C9) and chemokine receptors (e.g., CCR2 and CCRL2), were associated with severe COVID-194. These studies demonstrated the contribution of AABs to immunity against COVID-19.
We5,6 and other research groups7,8,9 reported that COVID-19 severity is also associated with the dysregulation of AABs associated with autoimmune diseases (e.g., antiphospholipid, antiplatelet glycoprotein, and antinuclear AABs). In particular, non-HLA10 AABs against G protein-coupled receptors (GPCRs)10,11 and renin-angiotensin system (RAS)-related molecules are associated with the symptoms of severe COVID-19, defined as the need for supplemental oxygen therapy12. These two groups of molecules are expressed by several human cell populations and modulate a myriad of intracellular signaling pathways and biological processes, such as cell trafficking, proliferation, survival, and differentiation, as well as neurotransmission and vasoconstriction13,14,15,16,17.
Notably, several AABs act as functional agents, binding to GPCRs and modulating intracellular pathways18, including those against angiotensin receptor type 1 (AGT1R), which causes COVID-19-related symptoms19,20, such as skin and lung inflammation21. Anti-AGT1R AABs have been implicated in various autoimmune conditions, such as systemic sclerosis (SSc)22. There is evidence highlighting the pivotal role of endothelial dysfunction and injury in both SSc and COVID-1923. This endothelial cell activation and dysfunction represent crucial and evolving steps in the pathogenesis of these diseases24,25. However, while the mechanism underlying anti-AGTR1 AAB-induced pathology is better understood in SSc, in the context of COVID-19, the associations of these AABs with disease development have not yet been fully elucidated.
COVID-19 has a diverse range of manifestations. Symptoms can vary widely among individuals and include fever, diarrhea, headache, depression, and amnesia26. The underlying causes of this variability remain unclear, particularly the potential role of AABs. This study was performed with the aim of determining whether individuals with specific symptoms have increased levels of certain AABs. Elucidating these associations could provide new insights into the pathophysiology of SARS-CoV-2 infection, a deeper understanding of which remains crucial despite advancements in controlling the COVID-19 pandemic through prior infections, vaccinations27, and the increasing availability of treatments such as antivirals and immunomodulators28.
Results
Serum AAB signatures associated with COVID-19 symptomatology
Initially, enrichment analysis was carried out with 10 AABs against GPCRs alone (CHRM3, CHRM4, CHRM5, CHRNA1, CXCR3, C5AR1, F2R, BDKRB1, and STAB1), 5 against both GPCRs and RAS (ADRB1, ADRB2, AGTR1, AGTR2, and ADRA1A), and 2 against RAS alone (ACE2 and MAS1). This analysis revealed enrichment in inflammatory biological processes (BPs) and the regulation of leukocyte migration, supporting the hypothesis of an association with COVID-19 symptoms (Fig. 1a). The AAB targets are expressed in various body tissues, including those of the nervous, circulatory, and immune systems29. They are associated with BPs relevant to COVID-19 pathophysiological mechanisms, including vasculopathy, cognitive dysfunction, and hyperinflammation (Fig. 1b).

a Venn diagram showing the AAB targets belonging to either the GPCR or RAS group. Only gene sets present in significant pathways according to the FDR are shown. Additionally, the graphic on the left shows the enriched BPs associated with these AAB targets and b) the different systems to which these BPs are linked.
To investigate the levels of the aforementioned AABs, we compared a control group consisting of healthy individuals or SARS-CoV-2-negative participants exhibiting at least one symptom of gastrointestinal or respiratory disease with COVID-19 patients classified as having mild, moderate, or severe disease. This analysis revealed a dysregulation of AAB levels, with specific AABs, such as anti-CHRM5, anti-CHRM3, anti-BDKRB1, and anti-AGTR1, showing trends toward associations with COVID-19 severity. (Fig. 2a, b). Hierarchical cluster analysis revealed a distinct pattern in the serum levels of AABs between the control group and the groups with different levels of COVID-19 severity, suggesting an association of a possible deregulation of certain AABs with disease progression (Fig. 2c). This observation was reinforced by the statistically significant differences in AAB levels among the groups. We observed that as the severity of COVID-19 increased, the prevalence of symptoms also increased, which may be associated with AAB levels. For example, symptoms such as muscle pain and fever were more likely to be clustered in patients with moderate and severe COVID-19 than other symptoms, such as diarrhea and dysgeusia (Supplementary Fig. 1).
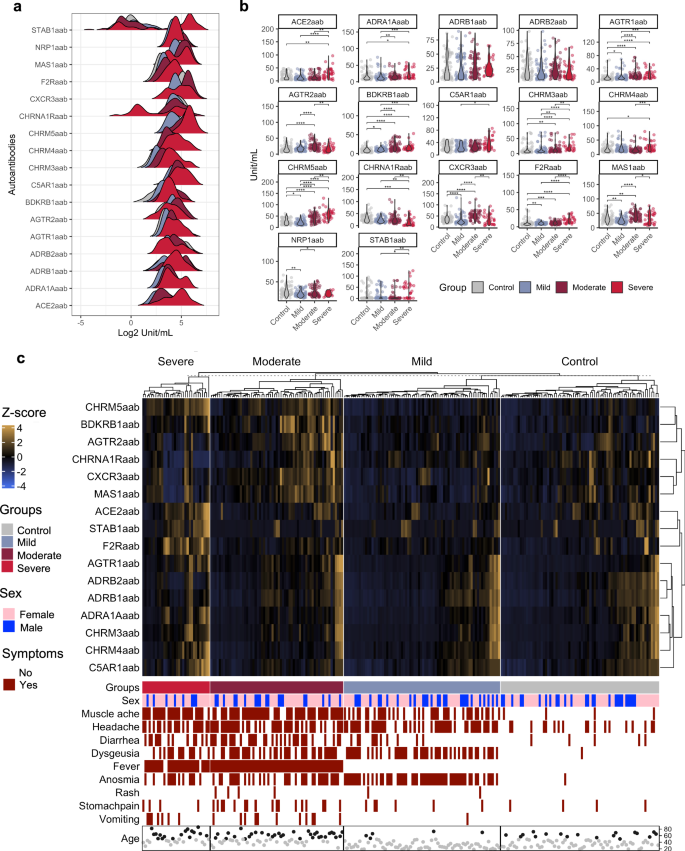
a Density plot showing the levels of AABs (x-axis) in log2 in the control, mild, moderate and severe groups. b Violin plots showing the significant difference in the levels of AABs between the control, mild, moderate and severe groups. c A hierarchical cluster heatmap displays the levels of AABs (after transformation of the z score), indicated by the scale bar. The categories of the presence or absence of symptoms, sex and age group ( < 50 and ≥50 years, represented by gray and black circles) are shown below the heatmap.
Identification of key COVID-19 symptoms and their associations with AABs
To identify the most relevant symptoms associated with the COVID-19 phenotype in our cohort (Fig. 3a) and to examine the correlation between AAB concentrations and these symptoms, we applied a random forest analysis. This method can be used to identify the most significant predictors of a given phenotype30. Our analysis indicated that anosmia, muscle ache, fever, and dysgeusia were the most relevant symptoms defining our COVID-19 cohort (Fig. 3b). To demonstrate the usefulness of each symptom for classifying the control and COVID-19 groups and on the basis of the predictions obtained via random forest analysis, we generated a receiver operating characteristic (ROC) curve, which revealed a false positive rate (FPR; specificity) and true positive rate (TPR; sensitivity) greater than 70% for each symptom (Fig. 3c). That is, together with the number of symptoms in each group, we assume that these symptoms are strong candidates for use in the classification of the COVID-19 groups.
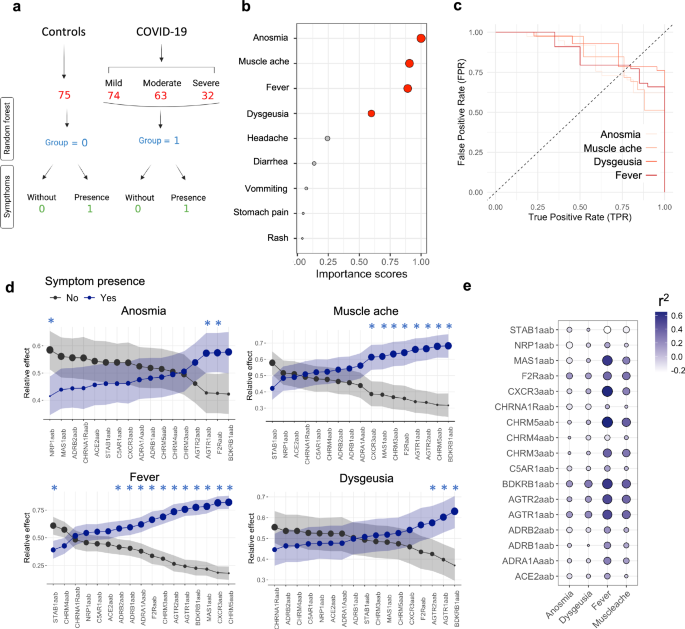
a A flowchart of COVID-19 severity and healthy groups labeled for random forest analysis. The control group consisted of healthy individuals or SARS-CoV-2-negative controls who presented with at least one symptom of gastrointestinal or respiratory disease. They were classified as individuals without (0) or with symptoms (1). b A dot plot showing the importance score from random forest analysis of COVID-19 symptoms. Red dots represent symptoms with an importance score above 0.5 (50%). The circle size increases according to the importance score. c ROC curves illustrating the relationship between the TPR and FPR for the prediction of the presence of specific COVID-19 symptoms in the study cohort. This comparison involves the control and COVID-19 groups identified in the random forest analysis. The curve highlights the symptoms deemed most relevant on the basis of their importance scores (Fig. 3b), which are calculated using the mean decrease Gini coefficient during the model training phase. d The relative effects were calculated using MANOVA. The circle size indicates the probability measure (relative effect size). Confidence intervals are shown by shadows. The black and blue lines/dots represent individuals with and without symptoms, respectively. Furthermore, the significance interval is identified by blue asterisks. e Bubble heatmap illustrating the CCA results, with the size and color gradient of each bubble representing the r2 value between symptoms and AAB (autoantibody) levels. The bubble size scales with the magnitude of the r2 values, expanding for both positive and negative deviations from zero.
Next, we investigated which AABs could be associated with the development of the four most relevant symptoms that predicted the phenotype in our COVID-19 cohort. This determination was based on our analysis of the correlation strength between these AABs and the specific symptoms, alongside other relevant factors considered in our study methodology. We conducted a relative effector analysis using bootstrapping and multivariate analysis of variance (MANOVA), which serves as a probabilistic measure to assess the likelihood of AABs influencing COVID-19 symptoms. This approach revealed distinct patterns of AAB behavior and AAB associations with each symptom (Fig. 3d). Specifically, AABs targeting F2R, AGTR1, and NRP1 presented the strongest association with anosmia, whereas those against BDKRB1, CHRM5, AGTR2, and AGTR1 were most closely linked to muscle aches. Additionally, anti-CHRM5, anti-CXCR3, anti-MAS1, and anti-CHRM5 displayed the strongest correlations with fever, and anti-BDKRB1, anti-AGTR1, anti-AGTR2, and anti-F2R were most strongly associated with dysgeusia. Similarly, mixed canonical correlation analysis (CCA) revealed that AABs targeting AGTR1, AGTR2, BDKRB1, CHRM3, CHRM5, CXCR3, F2R, and MAS1 were highly positively correlated with at least one symptom (Fig. 3e).
Stratifying COVID-19 patients by symptom accumulation and AAB profiles
To further investigate the relationships between AABs and the four primary symptoms that characterized our COVID-19 cohort, we analyzed the stratification potential of AAB levels in relation to the cumulative presence of COVID-19 symptoms. We conducted principal component analysis (PCA) with spectral decomposition, using AAB levels from both controls and COVID-19 patients, and categorized individuals into five groups on the basis of symptom number. Group 0 included healthy controls, non-COVID-19 controls with mild respiratory symptoms, and one patient with severe COVID-19 who, at the time of sample collection, did not display any of the primary symptoms (anosmia, muscle ache, fever, and dysgeusia) or other analyzed symptoms due to extreme illness. As the hierarchical clustering pattern of AABs remained consistent even when non-COVID-19 controls with mild symptoms and this unique severe case were excluded (Supplementary Fig. 2), we assumed that these cases did not impact the overall pattern of results.
COVID-19 patients presenting with one to four symptoms were categorized into groups 1, 2, 3, or 4, respectively (Supplementary Fig. 3). Using the Kaiser criterion and cumulative variance of the principal components (PCs), we selected the first four PCs, which account for 80% of the data variability (Fig. 4a and Supplementary Fig. 4a). These four dimensions suggest that the variability in AABs can be used to help stratify COVID-19 patients according to symptom group (Fig. 4b, c; Supplementary Fig. 4b). Specifically, as the number of symptoms (anosmia, dysgeusia, muscle pain, and fever) increased, there was a trend toward higher AAB levels in our patients. We observed that symptom group stratification was most prominent in PCs 1 and 2 (Fig. 4c and Supplementary Fig. 4c). The key contributors within each dimension were ACE2aab, ADRA1Aaab, ADRB1aab, ADRB2aab, AGTR1aab, C5AR1aab, CHRM3aab and CHRM5aab for PC1, whereas AGTR2aab, BDKRB1aab, CXCR3aab, CHRM5aab, MAS1aab, and F2Raab contributed to PC2.
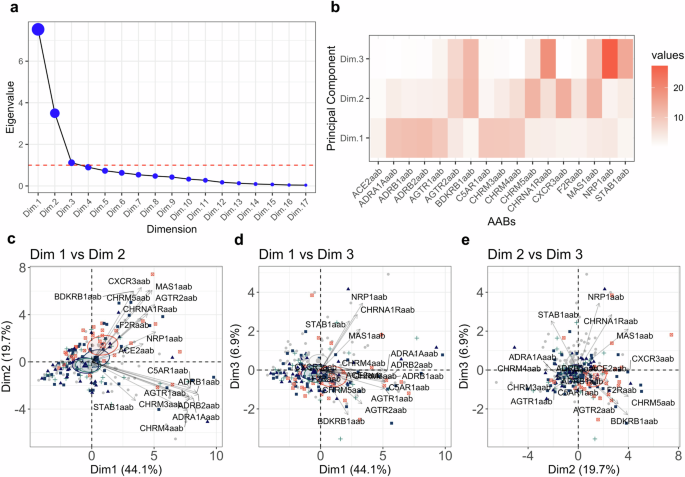
a Elbow graph showing the eigenvalues for the PCA dimensions. The red dashed line indicates the criteria established for selecting the dimensions. b Heatmap showing the contribution values of each AAB for dimensions 1, 2, and 3. Biplots showing PCs 1, 2, and 3. Dimension 1 with dimension 2 (c), dimension 1 with dimension 3 (d) and dimension 2 with dimension 3 (e). The colors gray, dark blue, blue, green and orange represented the groups 0 = no symptoms; 1 = one symptom; 2 = two symptoms; 3 = three symptoms; 4 = four symptoms, respectively.
Association of dysregulated AABs with the accumulation of COVID-19 symptoms
The stratification results described above suggest that the levels of AABs are dysregulated as the COVID-19 symptoms accumulate. To investigate this, we conducted a multiple comparison analysis between patients without symptoms and those presenting with one, two, three, or all four symptoms (anosmia, dysgeusia, muscle aches, and fever). This approach revealed significant alterations in several AABs associated with the accumulation of COVID-19 symptoms, namely, AABs targeting ACE2, AGTR1, AGTR2, BDKRB1, CHRM3, CHRM5, CXCR3, F2R, and MAS1 (Fig. 5a).
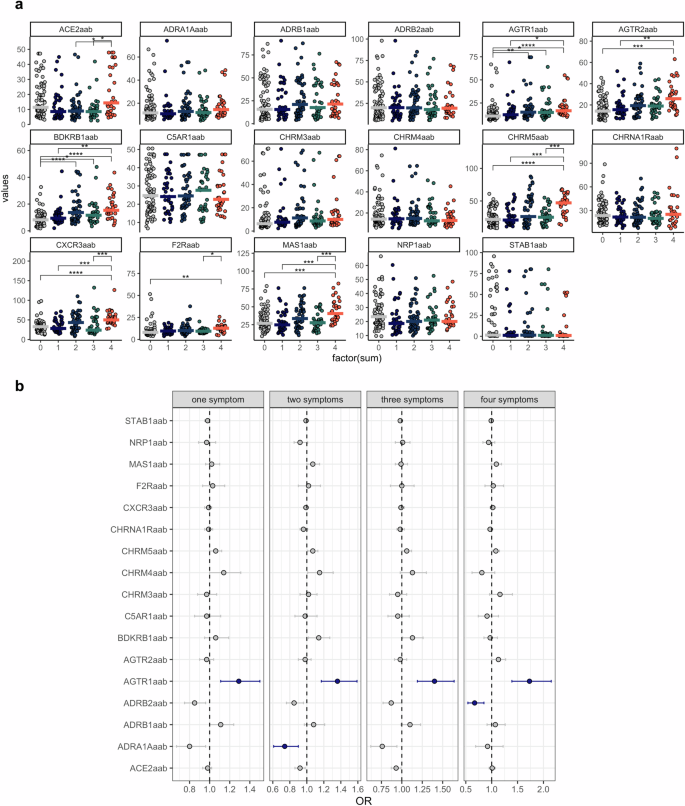
a Violin plots displaying AAB levels for each group on the x-axis (0 = no symptoms; 1 = one symptom; 2 = two symptoms; 3 = three symptoms; 4 = four symptoms). Asterisks indicate the Kruskal‒Wallis test with post hoc Dunn test significance levels (* = p < 0.01; **p < 0.001; ***p < 0.0001; ****p < 0.00001). Adjusted p values (FDRs) are also shown. b Forest plots depict ORs and their corresponding 95% confidence intervals (whiskers) for various AABs across COVID-19 symptoms. The blue dots and lines indicate significantly increased or decreased AAB levels, respectively, compared with those in healthy controls. This significance is based on the FDR and confidence intervals. The dashed line represents the intercept.
Given that multiple comparisons, such as the Wilcoxon test, increase the risk of Type I error (false positives), we further conducted multinomial logistic regression analysis. This analysis inherently adjusts for multiple comparisons, potentially providing a more conservative estimate of significance. This approach was used to more rigorously evaluate the association between AAB levels and the accumulation of COVID-19 symptoms. The results revealed that anti-AGTR1 AAB was the only strongly associated AAB, with significant odds ratio (OR)- and false discovery rate (FDR)- adjusted p values with the development of one, two, three, or all four of the assessed symptoms (Fig. 5b). Notably, the association between anti-AGTR1 and COVID-19 symptom accumulation was independent of age. In contrast, age appeared to influence the levels of other AABs, including those targeting ACE2 (Supplementary Fig. 5 and Supplementary Fig. 6).
Functional effects of anti-AGTR1 on glycocalyx height and stiffness
Inflammation-induced degradation of the endothelial glycocalyx (eGC), a key component in maintaining endothelial function, has been implicated in the pathogenesis of COVID-19-related endothelial dysfunction31,32,33. Using an anti-AGTR1 monoclonal antibody (mAb) at various concentrations (10, 50, and 100 µg/mL), we observed concentration-dependent reductions in eGC height and increases in stiffness compared with those in isotype controls (Fig. 6a). Notably, even at the lowest concentration (10 µg/mL), the anti-AGTR1 mAb significantly reduced the eGC height by approximately 25% and increased the stiffness by more than 50% (p < 0.0001). Higher concentrations further amplified these effects, with the maximum reduction in eGC height and increased stiffness observed at 50 µg/mL.
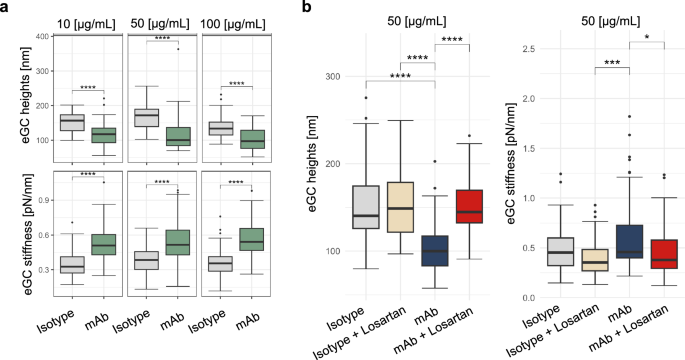
a Dose‒response curve of the effects of anti-AGTR1 antibodies or isotype controls on the height and stiffness of the glycocalyx. b Decreased endothelial glycocalyx (eGC) height and increased stiffness after treatment with anti-AGTR1 antibodies are reversed by losartan.
To evaluate the specificity of the effects of the anti-AGTR1 mAb and investigate potential protective interventions, we coadministered losartan, an AGTR1 antagonist, with the mAb. Compared with anti-AGTR1 mAb alone, treatment with anti-AGTR1 mAb (50 µg/mL) plus losartan restored eGC height by nearly 45% and ameliorated stiffness by approximately 18%, highlighting the protective effect of losartan against eGC degradation (Fig. 6b). Controls treated with losartan alone showed no significant changes, confirming the specificity of the effects of the anti-AGTR1 mAb.
Discussion
Our findings reveal distinct serum AAB signatures associated with COVID-19 symptomatology, suggesting a potential link between AAB dysregulation and symptom severity in infected individuals. Although further studies are warranted to validate these findings and explore the potential therapeutic implications of targeting these AABs in the management of COVID-19, our results provide insight into the immunopathological mechanisms underlying COVID-19 symptom development and severity and highlight the potential role of specific AABs in driving disease progression, indicating that AAB-mediated dysregulation contributes to symptom accumulation in COVID-19 patients.
Notably, AABs that target GPCRs are evolving in autoimmunity34, and their functions have been well characterized18. Anti-AGT1R antibodies, which are strongly associated with the accumulation of COVID-19 symptoms, have been shown to trigger similar in vitro and in vivo effects35,36,37,38, such as lung hyperinflammation, immune cell infiltration, and endothelial damage21,24,39. In addition to its role in the RAS, angiotensin II also exerts proinflammatory effects by stimulating ADAM metallopeptidase domain 17 (ADAM17), leading to the production of inflammatory cytokines such as INF-γ, IL-8 and interleukin-639,40,41.
A recent study demonstrated that anti-AT1R antibodies can act in an agonistic and synergistic manner with angiotensin II21. Hence, these antibodies could enhance the effects of angiotensin II, contributing to the development of COVID-19 symptoms. Nevertheless, since compelling emerging data suggest that anti-AGTR1 antibodies may play a role in the pathophysiology of COVID-1912,40,42,43, we hypothesize that these AABs might contribute to the dysregulation of the RAS, promote hyperinflammation, and be implicated in the endothelial dysfunction presented by COVID-19 patients, as they are involved in the etiopathogenesis of SSc. However, further research is needed to validate these findings and understand the underlying mechanisms by which anti-AGTR1 antibodies contribute to COVID-19 pathophysiology and the precise mechanisms involving and clinical implications of anti-AT1R AABs in COVID-19.
Moreover, decreased eGC height and elevated stiffness after treatment with an anti-AGTR1 mAb were reversed by losartan, indicating a possible new specific pathological effect of anti-AGTR1 antibodies. This result is in agreement with emerging evidence suggesting that the degradation of the eGC44, a key regulator of vascular homeostasis45, plays a critical role in the constellation of COVID-19 symptoms33,42. The impairment of the eGC, as indicated by our findings, could contribute to systemic manifestations such as anosmia and dysgeusia46. These sensory deficits may arise from compromised microvascular integrity within the olfactory and gustatory systems, leading to disrupted cellular function in these regions.
Additionally, the observed increase in stiffness and reduced height of the eGC may impede muscle perfusion, potentially explaining the myalgia experienced by many COVID-19 patients47. Fever, a hallmark of the body’s inflammatory response to infection48, may also be potentiated by eGC damage49. The resulting endothelial dysfunction could amplify cytokine production and release, precipitating the febrile response. Together, these associations underscore the need for further investigation into the impact of eGC degradation on vascular health and its implications for the multisystemic symptoms encountered in patients with COVID-19, potentially offering novel insights into targeted therapeutic interventions.
Moreover, we hypothesize that the degradation of the eGC induced50,51 by anti-AGTR1 mAb may contribute to several additional pathophysiological processes in COVID-19. The resulting endothelial dysfunction could also enhance inflammatory responses, exacerbating fever, a hallmark of the disease52,53. These findings highlight the need for further research to explore the role of eGC degradation in COVID-19 progression and its potential as a therapeutic target for managing multisystemic symptoms.
Anti-AGTR1 antibodies, as proposed in our manuscript, present a unique addition to the landscape of COVID-19 biomarkers by offering insight into the autoimmune component of severe disease. COVID-19 severity has been linked with both dysregulated immune responses and autoimmunity, notably through mechanisms involving the RAS12. AGTR1, which is central to the RAS, modulates inflammatory responses54 and vascular homeostasis55, which are both strongly implicated in severe COVID-19 pathology21,56.
Our findings suggest that anti-AGTR1 antibodies could serve as early markers of severe disease because of their potential to amplify immune dysregulation. This finding aligns with existing data indicating that AAB, such as those targeting interferons, play a significant role in exacerbating COVID-19 symptoms by interfering with viral control and increasing proinflammatory cascades57. Unlike general inflammatory markers, anti-AGTR1 antibodies specifically target a key receptor in the RAS, providing a link between vascular complications and immune dysregulation.
Hence, this study builds on previous observations of the presence of AABs in COVID-19 patients, expanding the scope to include RAS-targeting autoimmunity. By integrating anti-AGTR1 antibodies into COVID-19 biomarker research, we provide a potential tool for stratifying risk and understanding the autoimmune mechanisms that drive severe disease outcomes, thereby contributing a focused predictor within the broader biomarker landscape of COVID-19.
The results for anti-AGTR1 antibodies also suggest potential clinical applications, particularly with regard to identifying patients at greater risk of severe COVID-19 and poor outcomes. Testing for anti-AGTR1 antibodies could serve as a valuable addition to the diagnostic process, especially for patients who may be predisposed to severe disease owing to underlying immune or vascular dysregulation. Given the role of AGTR1 in the RAS and its connection with inflammation and vascular function, routine screening for anti-AGTR1 antibodies could help clinicians stratify patients and prioritize those who might benefit from early interventions or more intensive monitoring. Integrating anti-AGTR1 testing with other biomarkers could increase the predictive accuracy, thereby contributing to a more personalized and proactive approach to COVID-19 management. Further research into how these antibodies interact with other COVID-19 biomarkers may solidify their role in routine diagnostics.
Importantly, we must recognize additional limitations of the study. For example, owing to a lack of available data, we were unable to account for potential confounding variables, such as preexisting conditions, which may influence the relationship between antibody levels and symptom accumulation. This limitation underscores the importance of future studies examining the impact of preexisting conditions on this association.
Another limitation of our study is that we focused exclusively on losartan as a pharmacological agent to counteract the effects of anti-AGTR1 AAB on the eGC structure. While the efficacy of losartan in restoring the height and reducing the stiffness of the eGC was confirmed, we did not examine whether other drugs could produce similar protective effects. Exploring additional pharmacological agents, particularly those with anti-inflammatory or endothelial-protective properties, could provide a more comprehensive understanding of potential interventions to preserve eGC integrity in AGTR1-related pathways. This limitation highlights an area for future research that could expand therapeutic strategies for addressing endothelial dysfunction, such as that observed in COVID-19-associated vascular impairment.
In conclusion, the comprehensive analysis presented in this work provides crucial insights into the nuanced interactions between AABs and specific COVID-19 symptoms, shedding light on the different associations observed across varying symptoms (Fig. 7). The study highlighted the progressive stratification of COVID-19 patients on the basis of AAB levels and the correlation of these levels with the accumulation of symptoms. Importantly, this study is the first to investigate the associations between these AABs and specific COVID-19 symptoms, adding a new dimension to our understanding of COVID-19 pathophysiology.
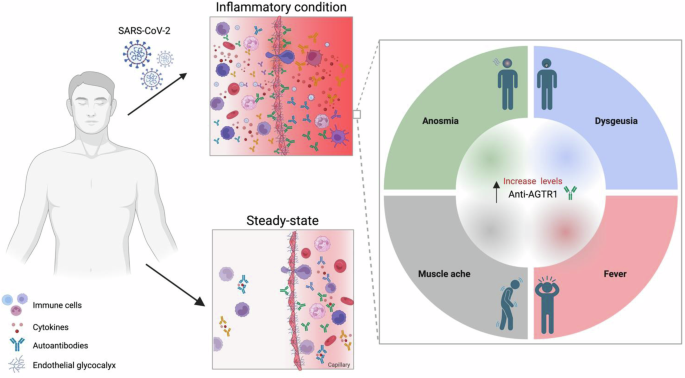
This figure summarizes the relationship between anti-AGTR1 AABs and inflammatory responses associated with COVID-19 symptoms.
Methods
Study cohort
We carried out an investigation involving 244 unvaccinated adults living in the United States whose clinical and laboratory features have been previously reported58,59. This cohort consisted of 169 individuals diagnosed with COVID-19, confirmed by positive tests for SARS-CoV-2 obtained by nasopharyngeal swabs and polymerase chain reaction (PCR). In addition, we included 75 randomly selected patients as a control group. The cohort data included information on age, sex and symptoms for the COVID-19 patients. Negativity for SARS-CoV-2 was confirmed by PCR tests. In addition, COVID-19 patients were stratified according to the severity classification defined by the World Health Organization (WHO). This categorization included mild cases (n = 74), characterized by a fever duration of ≤1 day and a peak temperature of 37.8 °C; moderate cases (n = 63), characterized by a fever duration of ≥ seven days and a peak temperature of ≥38.8 °C; and severe cases (n = 32), characterized by severe symptoms requiring supplemental oxygen therapy. Detailed demographic and clinical data are provided in Supplementary Data 1.
Data collection for COVID-19 symptoms
Every participant, including both healthy controls and patients, provided informed written consent in accordance with the principles set forth by the Declaration of Helsinki. The study received approval from the IntegReview institutional review board (Protocol number and title of study: CAPS-613; “Coronavirus Antibody Prevalence Study [CAPS]”) and adhered to the reporting guidelines outlined by Strengthening the Reporting of Observational Studies in Epidemiology (STROBE).
COVID-19 symptoms were recorded through a two-stage sampling approach. In the first stage, a cross-sectional survey was conducted to capture self-reported symptoms and outcomes of SARS-CoV-2 infection among adults59. An electronic survey was sent to individuals who expressed interest in antibody testing and were willing to share their experiences with COVID-19 symptoms. Before beginning the survey, the participants provided electronic informed consent and were briefed on the study’s objectives.
The questionnaire was specifically designed to identify the most commonly reported symptoms of COVID-19. The questionnaire included questions about demographic information, the presence of symptoms, the symptom onset date, and whether the participant had a positive SARS-CoV-2 nasal swab test. Multiple rounds of feedback from three epidemiologists, more than ten physicians, and five representatives from local community organizations were incorporated to refine the questionnaire before administration. The survey was delivered through REDCap (Research Data Capture), a secure platform that complies with Health Insurance Portability and Accountability Act (HIPAA) requirements.
In the second stage, a subset of participants also underwent antibody testing, which provided additional data on their infection status. COVID-19 symptoms were self-reported by participants, without independent verification by healthcare professionals.
Levels of anti-SARS-CoV-2 antibodies and AABs in the study population
We detected human IgG AABs against 17 different GPCRs (AGTR1, AGTR2, MAS1, BDKRB1, ADRA1A, ADRB1, ADRB2, CHRM3, CHRM4, CHRM5, CXCR3, F2R, C5AR1, CHRNA1R), 2 molecules that allow SARS-CoV-2 to enter cells (ACE2, NRP1), and antibodies against the transmembrane receptor STAB1 from frozen serum using commercial enzyme-linked immunosorbent assay (ELISA) kits (CellTrend, Germany), as previously described12. The assays were conducted according to the manufacturer’s instructions and as previously described. Briefly, duplicate samples of a 1:100 serum dilution were incubated at 4 °C for 2 h, and the AAB concentrations were calculated as arbitrary units (U) on the basis of a standard curve of five standards ranging from 2.5 to 40 U/ml. The ELISA kits were validated following the Food and Drug Administration’s Guidance for Industry: Bioanalytical Method Validation.
AAB target enrichment analysis
To investigate the biological functions associated with the targets of AABs, we conducted a functional enrichment analysis using the ClusterProfiler60,61 package in R62. This analysis allowed us to identify enriched gene sets associated with BPs. We focused on 17 specific AAB targets: ACE2, ADRA1B, ADRB1, ADRB2, AGTR1, AGTR2, BDKRB1, C5AR1, CHRM3, CHRM4, CHRM5, CHRNA1, CXCR3, F2R, MAS1, NRP1, and STAB1. BPs showing significant enrichment were identified on the basis of an adjusted p-value threshold (FDR < 0.05). To visualize these enriched BPs, we used ggplot263 in R62 and Biorender.com.
Multifaceted visualization of AABs: density distributions, violin plots, and hierarchical clustering heatmaps
To explore the distribution of AAB levels across different COVID-19 severity groups, we generated density and violin plots. The density plots provide an overview of the distribution for each group, whereas the violin plots offer a more detailed comparison of AAB levels between groups. Given the nonparametric nature of the data, we employed the Wilcoxon test on the violin plots to identify statistically significant differences between groups. For the Wilcoxon test, we used the R62 package rstatix64. This approach allows us to assess variations in AAB levels linked to COVID-19 severity, highlighting potential patterns or anomalies within the groups. The heatmap illustrates the levels of AABs alongside cohort characteristics, with hierarchical clustering applied to uncover patterns and groupings. Clustering was performed using Euclidean distance to measure similarity via the R62 packages ComplexHeatmap65 and Circlize66. Initially, the analysis included only AABs without any missing values to ensure completeness. In a subsequent analysis, all the AABs were incorporated to provide a broader perspective (Supplementary Fig. 2).
Symptom classification, relative effects, and mixed canonical correlation analysis
A random forest model was used to prioritize COVID-19 symptoms on the basis of their importance in distinguishing between groups. Two distinct groups were defined: 0 for non-COVID-19 patients (healthy donors) and 1 for COVID-19 patients, including mild, moderate, and severe cases. Given the imbalance in group sizes, we applied a weighting adjustment in the RandomForest67 R62 package to ensure balanced representation. To validate the robustness of symptom selection, we conducted 10-fold cross-validation using the training function from the caret68 R62 package. We set a 50% importance score threshold, which helped us focus on symptoms that were more prevalent within each group. The ROC curve was generated using the R62 pROC69 package, and the model performance was evaluated. Finally, we identified the most relevant symptoms and formed subgroups of individuals who exhibited one or more of these key symptoms, allowing us to further analyze the presence of symptoms. Only symptoms with TPR and FPR metrics greater than 70% were considered. The goal of using the random forest model in this context was to select variables while considering the distribution of symptoms in each group. For example, the symptom “rash” was observed in only six patients, whereas “headache” showed a more uniform distribution, even among the control group individuals. As a result, the ROC curve demonstrated that the selected symptoms achieved 70% specificity and sensitivity with regard to classifying the COVID-19 group.
This filtering process was further validated by the robust variable selection capabilities of the random forest model, which aligns with the findings presented in Supplementary Fig. 1 and the heatmap data. Importantly, AAB levels were not used as predictors in this analysis. The predictors consisted solely of the presence or absence of symptoms within each group. Although AAB levels were considered in other parts of the analysis, they were not used in the context of the variables selected by the random forest model.
We evaluated the relative effects of AABs on four specific COVID-19 symptoms using a MANOVA with a bootstrap approach for enhanced reliability, involving 1000 resamplings. This method allowed us to account for variability in the data and to calculate confidence intervals for the relative effects, providing a robust measure of association. Age, sex, and COVID-19 severity group were included as covariates to control for potential confounding effects (Supplementary Data 2). The analysis was conducted using the npmv70 and reshape271 packages in R62. To further explore the relationships between binary variables (four symptoms individually) and continuous variables (AAB levels), we applied mixed CCA with a Kendall correlation between symptoms and AAB levels. This analysis was performed using the mixedCCA72 R62 package.
Principal component analysis
Principal component analysis (PCA) using spectral decomposition was conducted following previously outlined methods5,73. This approach allowed us to evaluate how effectively AABs could be used to differentiate among COVID-19 symptom subgroups. The PCA calculations were implemented using the prcomp function in R, with the get_eig and get_pca_var functions from the factoextra74 package helping to extract and interpret the eigenvalues and variable contributions. To select the dimensions that explain the greatest part of the data variability, we used the Kaiser criterion75 and cumulative explained variance. With the Kaiser criterion75,76, we considered only dimensions with eigenvalues greater than 1. Additionally, we used the cumulative explained variance criterion, selecting dimensions until 80% of the total data variability was captured.
Median plots and multinomial logistic regression analysis
To visually compare the distribution of significant AAB levels in individuals with COVID-19 on the basis of the presence or absence of symptoms, we used median values. Statistical differences in AAB levels between groups were assessed using the Wilcoxon test. An FDR-adjusted p value threshold of <0.05 was used to determine statistical significance. Dot plots were created with the R62 packages rstatix64 and ggplot263 to represent these distributions. Additionally, multinomial regression was applied to identify AAB levels that varied (either increasing or decreasing) across groups, with changes expressed through confidence intervals and ORs. This analysis was conducted using the multinom function from the nnet77 R62 package, and the significance of the AABs was determined on the basis of 95% exponential confidence intervals. This approach allowed us to quantify the likelihood of variations in AAB levels relative to the reference group (0 group) and to capture any significant shifts linked to symptom presence.
Impact of anti-AGTR1 antibodies on glycocalyx height and stiffness
To assess the height and stiffness of the eGC in human umbilical vein endothelial cells (HUVECs), the cells were cultured on coverslips until confluence was reached. They were then treated with an anti-AGTR1 mAb or an isotype control antibody for 24 h21. In some experiments, 1 µM losartan was added to inhibit AGTR1 function. Throughout the treatments, the cells were maintained in a HEPES-buffered solution containing 1% fetal bovine serum.
The structure of the eGC was assessed via atomic force microscopy (AFM) nanoindentation. A gold-coated cantilever with a spherical tip was employed to gently press on the cell surface, applying a maximum force of 0.5 nN. The deflection of a laser beam reflected from the cantilever was captured by a photodiode, enabling the generation of force‒distance curves. These curves were then analyzed with specialized software (PUNIAS3D) to quantify the height and stiffness of the glycocalyx.
Statistical analyses were conducted using R62. The Shapiro‒Wilk test was used to assess data normality, and the Kruskal‒Wallis test was applied to compare mean values across nonparametric groups. Dunn’s post hoc test was performed for multiple comparisons, with the results expressed as the mean ± standard error of the mean (SEM). An FDR threshold of <0.05 was considered statistically significant.
Data sharing statement
The demographic data used in this study are provided in Supplementary Data 1.

Responses