Early detection of Parkinson’s disease through multiplex blood and urine biomarkers prior to clinical diagnosis

Introduction
Parkinson’s disease (PD) is the second most common neurodegenerative disorder, affecting approximately 10 million people worldwide, with an incidence of about 3% among those over 80 years old1. Despite extensive research into the mechanisms underlying PD over the past decade, diagnosis still relies on neurological examinations, primarily identifying motor symptoms such as bradykinesia, resting tremor, and rigidity, along with a range of non-motor symptoms (NMS) including reduced olfaction, constipation, urinary dysfunction, and orthostatic hypotension. Even with the proper application of these criteria, the misdiagnosis rate remains as high as 20% due to clinical overlap with other PD syndromes2,3,4,5. Meanwhile, studies have shown differences in diagnostic accuracy between movement disorder specialists and general clinicians, with an accuracy of 92.5% for the MDS clinically probable PD criteria and 90.3% for general clinicians6,7. Research indicates that by the time most patients are diagnosed with PD, 50% to 70% of dopaminergic neurons in the substantia nigra have already degenerated8. Furthermore, prodromal symptoms of PD, such as rapid eye movement sleep behavior disorder (RBD), may be present years before the disease manifests clinically9,10. Consequently, there is an increasing necessity to identify biomarkers that can detect the initiation of pathology or identify the prodromal stage of the disease. Improving early diagnosis of PD can enhance patient outcomes, however, the challenge of accurately identifying the disease in its early stages remains significant11.
Various biomarkers that facilitate the early diagnosis of disease include imaging, cerebrospinal fluid analysis, oxidative stress markers, neuroprotective factors, and inflammatory indicators. Previous research on biomarkers for diagnosing PD has often concentrated on bodily fluids, particularly cerebrospinal fluid and blood samples. However, there are currently significant shortcomings in this area8,12. Investigations into cerebrospinal fluid have primarily concentrated on α-synuclein13,14. Misfolded alpha-synuclein aggregates are a defining feature of PD and other synucleinopathies.
In patients with PD, cerebrospinal fluid levels of total αSyn are significantly lower compared to healthy controls15,16. Recently, αSyn seed amplification assays have demonstrated significant potential as a diagnostic tool for PD17. Furthermore, Increased concentrations of neurofilament light chains in CSF and blood have been associated with diseases of the central and peripheral nervous systems involving axonal damage or degeneration. NfL is released into extracellular fluid following axonal injury, making it a potential biomarker for such neurodegenerative conditions. Studies by Brit Mollenhauer and colleagues in two independent longitudinal cohorts have shown that baseline serum NfL levels are significantly higher in individuals with Parkinson’s disease compared to control groups18. Although these studies have identified numerous biomarkers relevant to PD diagnosis and monitoring, the invasive nature of lumbar puncture for CSF collection, along with the high cost primarily associated with CSF analysis, limits its widespread use in PD diagnosis.
However, biomarkers based on blood and urine, due to their non-invasive nature, low cost, and capability for frequent monitoring, can be widely applied in clinical settings. Notably, blood biomarkers have demonstrated superior sensitivity and specificity over cerebrospinal fluid in accurately detecting Alzheimer’s disease19,20. For instance, the Neurofilament light chain has been adopted as a biomarker for relapsing multiple sclerosis21. In the AMORIS study conducted in Sweden, Fang et al. explored the relationship between lipid-related biomarkers and PD in roughly 600,000 participants. They found that higher levels of total cholesterol, LDL cholesterol, and triglycerides correlated with a decreased risk of PD22. In a related analysis, Solmaz Yazdani et al. investigated immune-related biomarkers in 812,073 participants, focusing on the hazard ratios for ALS and PD associated with markers such as leukocytes and immunoglobulin G. This comprehensive research, tracking changes in biomarkers up to two decades prior to diagnosis, bolstered these findings23. However, these findings were often limited to a small number of biomarkers and utilized small clinical cohorts. More importantly, it was unclear whether pre-diagnostic levels of blood and urine biomarkers in epidemiological cohorts could predict the future risk of PD. To tackle these challenges, we conducted a comprehensive analysis using a large longitudinal cohort from the UK Biobank to investigate the association between baseline levels of multiple blood and urine biomarkers and the risk of incident PD. Subsequently, we performed extensive genetic analyses to explore the potential causal relationships linking these biomarkers to PD risk.
Results
Demographics
The UK Biobank recruited a total of 502,357 participants. We excluded non-British White participants (N = 59,885), individuals with prevalent PD at baseline (N = 294), and those with other types of neurological disorders at baseline (N = 15,284). To handle missing data, we performed multiple imputations with chained equations. After imputation, all blood and urine biomarkers were standardized. Participants with values exceeding five standard deviations were identified as outliers and removed (N = 34,614). Ultimately, 392,280 participants were included in the analysis. Over a median follow-up period of 9.5 years (Interquartile Range (IQR), 8.65–10.35 years), a total of 3,084 incident PD cases were observed. These cases had an average follow-up period of 7.89 years and comprised 1,931 males and 1,153 females. The mean age at onset was 63.01 years. Baseline characteristics data are shown in Table 1.
Association of Biomarkers with Incident Parkinson’s Disease
Firstly, We used a Lasso-Cox model adjusted for age and sex with the penalty parameter lambda determined by tenfold cross-validation to select biomarkers of predictivity, we preliminarily identified 46 potential blood and urine biomarkers associated with the onset of PD, predominantly related to blood cell count indicators (See Fig. 1).

This figure illustrates the importance and direction of biomarkers selected through Lasso regression analysis. Panel A shows the average coefficients for each biomarker, with the color and length of the bars representing the magnitude and direction of their impact on the predictive outcome. Panel B illustrates the changes in coefficients of biomarkers during the LASSO regression process as a function of the L1 norm. Each colored line represents the coefficient trajectory of a different biomarker across varying levels of L1 norm regularization. The plot visualizes how coefficients are shrunk towards zero, highlighting which biomarkers remain significant as the regularization increases. Panel C illustrates the LASSO coefficient profiles for the 35 variables as the log-transformed regularization parameter λ varies. The vertical axis shows the partial likelihood deviance, indicating the model’s goodness of fit, while the horizontal axis displays the log(λ) values. A vertical line within the graph marks the λ value selected by 10-fold cross-validation, optimized for balancing model complexity and predictive accuracy. As λ decreases, model compression intensifies, which enhances the model’s ability to discern and retain only the most important variables. The sequence of numbers at the top indicates the count of variables retained in the model at each specific λ, helping to visualize how variable selection changes with increasing regularization.
We progressively included stricter covariates in our models to more accurately estimate the relationship between specific biomarkers and the onset of PD, while controlling for potential confounding variables. The detailed results of the 3 models are presented in Table 2. In Model 1, we adjusted for sex, age, smoking consumption, alcohol consumption, physical activity levels, and education. These basic demographic and lifestyle factors are common determinants of health and allowed us to assess the relationship between biomarkers and PD risk in a population with similar lifestyle habits, resulting in the identification of 22 significant biomarkers. In Model 2, we added covariates such as diabetes, hypertension, and stroke, which are critical health conditions closely linked to neurological health. By controlling for these diseases, we could more precisely analyze the impact of biomarkers on PD risk independently of these severe health conditions, eliminating potential interference. This adjustment led to no significant changes in the associations for most biomarkers, except for total protein, which was no longer significantly related. Finally, in Model 3, we conducted a multivariable Cox proportional hazards regression analysis that included all covariates and significantly associated biomarkers identified in Model 2. This comprehensive approach reduced the number of significant biomarkers to 13, highlighting those independently associated with the occurrence of PD events. This step helped minimize the influence of uncontrolled variables, allowing us to identify independent and highly correlated biomarkers potentially associated with PD onset, which may provide valuable insights for better predicting the occurrence of PD. This progression from identifying 22 significant biomarkers in Model 1 to 13 in Model 3 illustrates the importance of rigorous adjustment of covariates in isolating the most robust biomarkers for PD onset.
These biomarkers encompass categories such as enzymes, blood cell parameters, metabolites, and proteins. Among these, the AST/ALT ratio (HR = 1.14, 95% CI: 1.08–1.21, P = 8.53 × 10⁻⁶), NLR (HR = 1.14, 95% CI: 1.08–1.19, P = 6.06 × 10⁻⁷), glucose (HR = 1.13, 95% CI: 1.07–1.19, P = 5.02 × 10⁻⁶), IGF-1 (HR = 1.25, 95% CI: 1.20–1.30, P = 7.46 × 10⁻²⁹), phosphate (HR = 1.08, 95% CI: 1.03–1.12, P = 1.81 × 10⁻³), and total bilirubin (HR = 1.06, 95% CI: 1.02–1.11, P = 5.31 × 10⁻³) were positively associated with PD risk. Conversely, platelet crit (HR = 0.76, 95% CI: 0.70–0.83, P = 5.97 × 10⁻⁹), eosinophil count (HR = 0.92, 95% CI: 0.88–0.96, P = 4.79 × 10⁻⁴), C-reactive protein (CRP) (HR = 0.89, 95% CI: 0.83–0.95, P = 1.43 × 10⁻³), urate (HR = 0.85, 95% CI: 0.81–0.89, P = 1.13 × 10⁻¹⁰), immature reticulocyte fraction (IRF) (HR = 0.75, 95% CI: 0.71–0.79, P = 3.49 × 10⁻²⁰), basophil count (HR = 1.31, 95% CI: 1.25–1.37, P = 2.98 × 10⁻³¹), and platelet count (HR = 1.10, 95% CI: 1.01–1.20, P = 3.91 × 10⁻²) were significantly associated with PD risk.
Among the biomarkers we studied, IRF, phosphate, and the AST/ALT ratio are newly identified concerning PD with minimal prior investigation. Established biomarkers like urate, total bilirubin, NLR, platelet crit, platelet count, eosinophil count, Glucose and basophil count have been examined primarily in experimental settings and are now being analyzed using large-scale longitudinal data from the UK Biobank for the first time24,25,26,27,28. Furthermore, IGF-1 and CRP, known for their roles in systemic inflammation, have demonstrated potential links with PD in clinical and epidemiological studies, though these findings have historically been inconsistent29,30,31. To address these discrepancies and deepen our understanding, our study has conducted extensive genetic analyses to further elucidate the relationships between these biomarkers and PD.
Finally, we conducted stratified analyses by sex and age. In males, NLR, glucose, phosphate, and total bilirubin were no longer significant, while in females, there were no differences (See Supplementary Table 1). In the age-stratified analysis, CRP and phosphate were no longer significant in individuals older than 65 years. After excluding individuals who developed diseases within three years from the baseline measurement, the results remained unchanged, confirming the reliability and stability of our findings. (See Supplementary Table 2).
Genetic correlation analysis
To estimate the genetic correlation between 13 biomarkers and PD, we utilized LD Score Regression (LDSC) and Genome-wide Complex Trait Analysis (GNOVA), employing GWAS summary statistics. Our analysis covered 11 of these biomarkers, identifying significant genetic correlations with PD in six instances. Notably, both CRP and IGF-1 exhibited significant correlations in both LDSC and GNOVA analyses, with CRP showing a negative correlation (genetic correlation: -0.14, P = 6.31 × 10⁻⁵) and IGF-1 a positive correlation (genetic correlation: 0.12, P = 7.52 × 10⁻⁶). This consistent significance across both methodologies underscores their robust association with PD (See Supplementary Table 3).
Additionally, the superior performance of GNOVA in single-trait analyses enabled the detection of four additional fluid biomarkers associated with PD that were not identified in the LDSC analysis. Specifically, eosinophil count (genetic correlation: -0.08, P = 3.34 × 10-03), IRF (genetic correlation: -0.08, P = 3.45 × 10⁻³), glucose (genetic correlation: -0.06, P = 3.51 × 10⁻²), and total bilirubin (genetic correlation: 0.04, P = 3.18 × 10⁻⁶) demonstrated notable correlations only in the GNOVA analysis.
These findings not only validate some of the previously identified biomarkers associated with PD risk but also confirm their genetic correlation with the disease.
Estimation of pleiotropic enrichment
The stratified quantile-quantile (QQ) plots for PD conditioned on the P-values associated with IGF-1, CRP, and IRF reveal a clear pattern of successive enrichment, indicating that the proportion of non-null SNPs in PD increases with higher levels of association with these three biomarkers. This trend of successive enrichment is further supported from the opposite direction of analysis (see Supplementary Fig. 1). This observed enrichment in the QQ plots provides a compelling rationale to explore fold enrichment plots, which offer additional insights into the magnitude of these associations. Fold enrichment plots further quantify these relationships by assessing the degree of upward shift from the expected null line (P = 1), thus providing a clearer measure of the strength of the genetic overlap and the extent of enrichment. In these plots, we observed significant levels of enrichment: CRP-conditioned PD enrichment exceeded 7-fold, IGF-1-conditioned enrichment was approximately 13-fold, and IRF-conditioned enrichment reached 4-fold. In the reverse direction, the enrichment levels were even more pronounced: CRP-conditioned PD enrichment surpassed 20-fold, IGF-1-conditioned enrichment was around 4.5-fold, and IRF-conditioned enrichment approached 20-fold. These results not only confirm the trends indicated in the QQ plots but also highlight the significant pleiotropic effects, illustrating the substantial genetic interplay between these biomarkers and PD, thereby underscoring their potential roles in the pathogenesis and genetic architecture of PD (see Supplementary Fig. 2).
To discover genetic variants associated with biomarkers conditional on PD, we continued to perform conditional false discovery rate (conjFDR) analysis to identify pleiotropic variants between CRP and the risk of PD. We identified four pleiotropic loci with conjFDR values less than 0.01 (Table 3). The most significant locus was rs17573509 (MAPT), The MAPT H1 haplotype is widely recognized as a risk factor for various neurodegenerative diseases, such as PD, progressive supranuclear palsy, and corticobasal degeneration. Other significant loci include HLA-DRB1 and HLA-DQA1 located in the major histocompatibility complex (HLA), as well as SETD1A, which is crucial in hematopoiesis and development.
We leveraged the pleiotropic effects associated with various traits using a genetic pleiotropic condFDR method, employing GWAS summary data to investigate the genetic overlap among polygenic traits. This approach deepens our understanding of genetic pleiotropy and enhances statistical power, thereby elucidating the genetic mechanisms associated with multiple phenotypes. Through this method, we systematically assessed the shared genetic background between biomarkers and PD.
Mendelian randomization analysis
In our study, we aimed to conduct MR analyses on three biomarkers: IRF, IGF-1, and CRP, all of which have been previously identified as having pleiotropic loci associated with PD. This approach helps minimize confounding biases and eliminate potential reverse causality, enabling us to assess the impact of these biomarkers on the risk of developing PD. By using genetic variants as instrumental variables, we can explore potential causal relationships between these biomarkers and PD with greater precision.
We analyzed the causal effects of CRP and IGF-1 on PD risk using MR analyses. For CRP, 179 independent SNPs served as instrumental variables, showing robust instrument strength (median F-statistic of 65.7) and no evidence of weak instrument bias or horizontal pleiotropy (MR-Egger intercept P = 0.78). The inverse variance weighted (IVW) method indicated a negative causal relationship between CRP levels and PD risk, consistent across leave-one-out analysis. In contrast, 289 SNPs were used for IGF-1, also demonstrating strong instrument validity (median F-statistic of 55.3) and no pleiotropic effects (MR-Egger intercept P = 0.74). The IVW results suggested a positive association between IGF-1 levels and PD risk. For IRF, no significant causal association was found in the analysis.
The MR analyses underscore the causal relationships between specific inflammatory biomarkers and PD. Specifically, our findings indicate that CRP may have a protective role against PD, suggesting a possible anti-inflammatory mechanism that mitigates disease progression. Conversely, the positive association between IGF-1 levels and increased PD risk highlights the complex role of inflammatory processes in neurodegeneration (See Fig. 2).
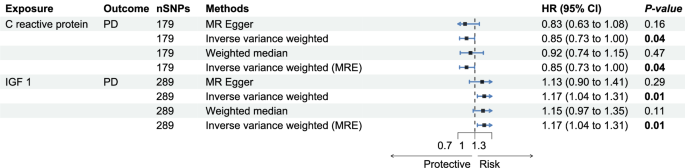
This figure displays MR results for the association between CRP and IGF-1 with PD, focusing on the IVW method. We primarily examine the p-values and hazard ratio ranges from the IVW results.
Discussion
This study leveraged the UK Biobank’s extensive dataset of blood and urine biomarkers to advance our understanding of PD through case-control studies, genetic analysis, and MR. We identified 13 biomarkers associated with PD, including newly explored markers such as the AST/ALT ratio, IRF, and phosphates, alongside IGF-1 and CRP, which had previously shown inconsistent results in research. Genetic correlation analysis revealed significant inverse genome-wide correlations between PD and several biomarkers like eosinophil count, IRF, CRP, glucose, and total bilirubin, while showing a positive correlation with IGF-1. Among these, the relationships with IGF-1 and CRP were the most pronounced. Our pleiotropy analysis confirmed four significant shared genetic loci linked to PD, including three previously reported (HLA-DRB1, HLA-DQA1, MAPT) and one less commonly reported locus, SETD1A. Ultimately, MR studies supported the nature of these associations, indicating potential causal relationships between the immunoinflammatory biomarkers IGF-1 and CRP and PD. These MR findings help resolve inconsistencies reported in earlier studies and provide robust support for these biomarkers’ roles in PD.
Our study identified several biomarkers, including the AST/ALT ratio, which has not been previously confirmed as a significant indicator. Commonly associated with liver damage, the AST/ALT ratio is also linked to various metabolic syndromes. Moreover, research has shown that this ratio has a negative correlation with grip strength and walking speed, both of which are relevant to PD32,33. This suggests that the AST/ALT ratio may serve as a valuable biomarker in understanding the broader physiological impacts associated with PD. Phosphates, typically associated with the musculoskeletal system, can cause metabolic dysregulation, leading to an accumulation of excessive inorganic phosphates. Excessive phosphate levels are thought to impair the function of Complex I in the mitochondrial electron transport chain, a key component in PD pathology34,35. This impairment is associated with the activation of the mitochondrial permeability transition pore, which leads to increased production of reactive oxygen species, heightened inflammation, DNA damage, and depolarization of the mitochondrial membrane36. Consequently, additional research is essential to fully understand the potential impact of phosphate dysregulation in PD. The IRF reflects the erythropoietic activity of the bone marrow and is commonly used in the laboratory diagnosis of anemia37. A follow-up study from the Korean National Screening Program found that anemia was associated with a lower risk of PD, particularly in patients with moderate to severe anemia38. Additionally, some studies have shown that newly diagnosed anemia increases the risk of PD39. Therefore, further research is needed to explore the complex relationship between IRF and PD.
To further explore whether there are pleiotropic risk variants shared between biomarkers and PD, we systematically assessed the shared genetic background between biomarkers and PD. We subsequently utilized summary statistics from genome-wide association studies to analyze the genetic correlations between statistically significant biomarkers and PD. Using the condFDR method, we analyzed their genetic enrichment and successfully identified four common genetic loci. Among these loci, the MAPT identified between IRF and PD encodes the microtubule-associated protein tau. Research indicates that tau protein may influence alpha-synuclein and could be a key target for treating diseases related to tau and alpha-synuclein. Dysfunctions in SETD1A could lead to schizophrenia, and its reduced function may disrupt the normal development of cortical axons, dendrites, and spines, leading to cognitive deficits. Re-expression of SETD1A in adulthood may help reverse these cognitive impairments40,41. The genes HLA-DRB1 and HLA-DQA1, which are shared among IGF-1, CRP, and PD, are implicated in immune regulation. These findings suggest a significant role of these genetic regions in modulating immune responses, which may influence the pathogenesis of PD. PD and Alzheimer’s disease (AD) show genome-wide associations within the HLA class II region, which includes the closely linked HLA-DR and HLA-DQ genes42. The HLA-DRB1*04 subtype can selectively bind the PHF6 sequence of tau protein, influencing the progression of neurodegenerative diseases43.
The significance of IGF-1 and CRP in PD research has been unclear, prompting us to conduct MR analyses to resolve these uncertainties. We explored the causal relationships between these genetically correlated biomarkers and PD, aiming to provide definitive insights into their roles in the disease’s pathogenesis. In previous studies, IGF-1 is known for its neuroprotective functions, playing a crucial role in the development of the nervous system and the survival and differentiation of neurons44. Research indicates that IGF-1 levels decrease with age, correlating with PD, which predominantly affects the elderly45. However, several cohort studies suggest that PD patients exhibit higher levels of IGF-1 compared to healthy controls, potentially as a compensatory mechanism in response to the disease46. Our findings corroborate these cohort studies, indicating that elevated levels of IGF-1 are associated with an increased risk of PD. CRP is a biomarker that reflects the body’s inflammatory state, with plasma CRP levels capable of rising rapidly and significantly in response to acute inflammatory stimuli47. It has been reported to be associated with the risk and progression of PD48. A previous large meta-analysis indicated that peripheral CRP levels were elevated in PD patients, suggesting that inflammation may play a role in the pathogenesis and symptoms of PD49. Additionally, a study based on the Oxford Discovery prospective cohort found that CRP might serve as a blood biomarker for predicting PD prognosis50. However, another study that included 12,642 participants found no significant association between CRP and the risk of developing PD51. These studies are often limited by sample size, highlighting the need for further research to explore the relationship between CRP and PD.
Our findings indicate that elevated levels of IGF-1 are associated with an increased risk of PD, while higher baseline levels of CRP are linked to a reduced risk of PD. This study represents the first demonstration of a causal relationship between IGF-1 and PD using MR analysis. These findings enhance our understanding of the association between these two biomarkers and PD risk, providing partial evidence for further exploration of their underlying pathogenesis.
The main strength of this study is the use of diverse pre-diagnostic blood and urine biomarkers to predict the risk of PD, addressing the limitations of small sample sizes and potential confounding factors in previous studies. Additionally, we utilized the large sample size from the UK Biobank, which enhances the statistical power and robustness of our findings, making the conclusions more reliable and generalizable. In our sensitivity analysis, we strategically excluded patients diagnosed with PD within three years prior to the study to minimize potential reverse causation—a common challenge in longitudinal studies. Furthermore, we employed a robust series of genetic validations that not only effectively addressed reverse causation but also mitigated the impact of residual confounding factors in epidemiological studies. These measures have significantly strengthened the validity of our results, solidly corroborating our epidemiological findings and enhancing our understanding of PD’s pathogenesis. Additionally, our integration of genetic analysis with MR provided a novel perspective on the causal relationships between identified biomarkers and PD, confirming findings that may have otherwise been obscured by biases. This study focused primarily on white British participants, which minimizes potential confounding from ethnic differences in plasma concentrations. However, this limitation reduces the generalizability of the findings to other demographic groups. Notably, white British individuals make up approximately 94.1% of the UK Biobank cohort, providing a sufficiently large sample size to ensure robust statistical power and valid conclusions. Despite this, future research should include more diverse populations to better understand the role of blood and urine biomarkers in PD risk. Using ICD codes to define PD might lead to misdiagnosis or misclassification issues, and as a result latent incident cases of the disease associated with less severe clinical symptoms might not have been captured, further in-depth studies are needed to validate these findings. Furthermore, biomarkers derived from body fluids, notably blood and urine, are vulnerable to fluctuations caused by physiological conditions and pharmacological interventions. Finally, given that our study was observational and the UK Biobank does not provide detailed information on medication use or certain pre-diagnostic characteristics, we recognize that, although MR was used to validate causal associations, the interpretation of the relationship between biomarkers and Parkinson’s disease should still be approached with caution.
Methods
Study Population Data Availability
The UK Biobank, a community-based longitudinal cohort, includes over half a million individuals aged 40–69 years, recruited between 2006 and 2010. Participants attended one of 22 assessment centers across England, Scotland, or Wales, where they completed questionnaires and participated in face-to-face interviews. Trained staff conducted phenotypic measurements and collected biosamples. The process began with self-administered questionnaires on touch screens, followed by computer-assisted personal interviews when necessary. The UK Biobank questionnaire, developed with input from international experts, covered key topics including sociodemographic information, lifestyle factors (such as smoking and alcohol use), early life exposures, psychological state, cognitive function, family and medical history, and overall health52. This rich resource enables us to conduct detailed and extensive research. Utilizing these detailed biomarker profiles, our study seeks to deepen the understanding of the relationship between these biomarkers and the onset of PD, enhancing our capabilities for early detection and better understanding of the disease’s mechanisms53.
Biomarkers Measurement
The UK Biobank collected blood and urine samples during baseline recruitment, measuring pertinent blood biochemistry, blood count, and urine-related biomarkers. The specific Field IDs for the UK Biobank can be found in Supplementary Table 4. For detailed information on missing values, refer to Supplementary Fig. 3. Detailed information regarding the experimental procedures and quality control protocols can be found on the UK Biobank website.
Previous studies have indicated that various lipid trait ratios and immune-related markers are associated with dementia and cognitive function51,54,55,56. we calculated various ratios, including AST/ALT, HDL/ApoA, LDL/ApoB, and ApoB/ApoA ratios, NLR (Neutrophil-to-lymphocyte ratio), PLR (platelet–lymphocyte ratio), LMR (Lymphocyte-to-monocyte ratio), SII (systemic immune inflammation index). Before division, all components of the ratios were converted into the same units. Subsequently, standardization transformations were applied to all fluid biomarkers. Samples deviating more than 5 standard deviations from the mean were considered outliers and were excluded from the analysis involving relevant participants.
Parkinson’s Disease Outcome Definitions
PD diagnoses and onset dates are documented within hospital admission records across the UK, encompassing diagnostic data derived from England’s Hospital Episode Statistics, Scotland’s Morbidity Records, and Wales’s Patient Episode Database, all classified using the 10th Revision of the International Classification of Diseases (ICD-10)52. The G20 code encompasses PD, including conditions such as hemiparkinsonism, paralysis agitans, and parkinsonism that is not otherwise specified (NOS), idiopathic, or primary. Participants were considered at risk for PD from the date of enrollment, with follow-up continuing until either the initial diagnosis or September 2023, whichever came first. To minimize the potential for reverse causality, individuals with prevalent PD were excluded from the study prior to enrollment.
Analytical Cohort
Figure 3 shows the process for constructing the analytical cohort. From the initial 502,357 participants in the UK Biobank, we excluded 59,885 individuals without British white ancestry, 294 individuals with PD at baseline, and 15,284 individuals with pre-existing nervous system diseases. After applying these criteria, we assessed the impact of missing trait values, particularly for the multivariable analysis, by performing multiple imputations using chained equations. This process was carried out over 10 iterations, generating 10 complete datasets for subsequent analys57. Following normalization, we excluded 34,614 outliers exceeding ±5 standard deviations. Consequently, the final sample size for the PD and biomarker analyses was 392,280 participants.
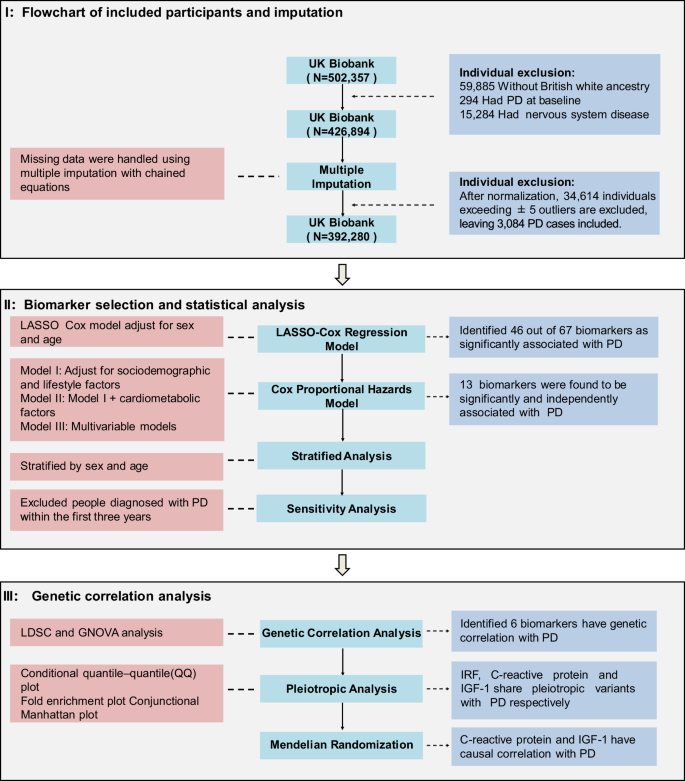
The study involves three main parts: participant selection, biomarker selection and statistical analysis, and genetic correlation analysis. In Part I, we started with 502,357 participants from the UK Biobank, applying exclusion criteria and multiple imputation, resulting in a final sample of 392,280 participants. In Part II, we used LASSO-Cox regression and a progressively stringent covariate-adjusted Cox proportional hazards mode. In Part III, we conducted genetic correlation analysis, identifying genetic links and causal relationships for key biomarkers. PD Parkinson’s disease, CRP C-reactive Protein, QQ quantile–quantile.
Statistical Analyses
LASSO (Least Absolute Shrinkage and Selection Operator) is a form of regularization that reduces coefficients to enhance prediction accuracy. To preliminarily screen blood and urine biomarkers associated with PD onset, we performed gender and age adjusted LASSO Cox regression analysis, using a penalty parameter (λ) optimized through tenfold cross-validation. This approach helped identify biomarkers most strongly associated with PD onset risk while minimizing the risk of overfitting58. The LASSO model was constructed using the “glmnet” package in R. This variable selection process was repeated across each imputed dataset, resulting in ten models. Subsequently, we set a threshold for inclusion in subsequent analytical models, requiring variables to retain nonzero coefficients in at least seven imputations of the LASSO model. Variables maintaining nonzero coefficients in fewer than seven LASSO models were excluded from further analysis57. We used the Rubin rule in all subsequent analyses to generate the final combined effect estimates59.
The confounding factors included in our study are age, sex, BMI, Townsend deprivation index, physical activity, smoking status, drinking status, education level, hypertension, stroke, and diabetes. Age refers to the age at enrollment, while BMI was measured using the Omron HEM-7015IT digital blood pressure monitor as the average of two sitting measurements of systolic blood pressure. BMI was calculated by dividing the individual’s weight (in kilograms), measured using the Tanita BC-418 MA body composition analyzer, by the square of their height (in meters). The Townsend deprivation index assesses area deprivation based on four domains: unemployment, car ownership, household overcrowding, and owner occupation information, with higher scores indicating greater social deprivation. Smoking and drinking statuses were classified as never, previous, or current. Education level was categorized as whether the individual held a college/university degree or other professional qualifications. Stroke, hypertension, and diabetes were defined based on self-reported status and whether participants were taking antihypertensive medication or insulin.
Building upon the preliminary feature selection conducted using LASSO-Cox regression, we employed Cox proportional hazards regression models to further evaluate the relationship between blood and urine biomarkers and the onset of PD. By iteratively refining the models and incorporating progressively stringent covariates, we aimed to minimize potential confounding and obtain more precise estimates of associations. Specifically, we started with Model 1, which included adjustments for key confounders such as gender, age, Townsend deprivation index, smoking, alcohol consumption, BMI, physical activity, and education. Biomarkers with statistical significance (P < 0.05, Bonferroni corrected) in Model 1 were included in Model 2, which further accounted for cardiovascular and metabolic factors, including hypertension, diabetes, and stroke. Ultimately, Model 3 integrated the significant biomarkers identified in Model 2, while adjusting for all potential confounders, allowing us to identify biomarkers with independent associations with PD onset. We regard these findings as a starting point for a more in-depth investigation to explore their further significance and potential implications.
Genetic Correlation
The LDSC sumstats format files used in genetic correlation analysis are derived from the genome-wide association study (GWAS) round 2 data from the Neale Lab and are available for free on their website (https://www.nealelab.is/uk-biobank). We utilized default parameters in the Gnova and LDSC methods to estimate the genetic correlation between significant biomarkers and PD risk within the Cox proportional hazards regression model.
LDSC estimates the correlation between increased genetic susceptibility to diseases and quantitative trait values by analyzing single nucleotide polymorphisms (SNPs). By examining the relationship between test statistics and LDSC, it allows for the quantification of the contribution of each SNP to the overall genetic risk. This method can be used to assess whether different blood biomarkers share a common genetic basis with PD, providing insight into the potential genetic overlap between these biomarkers and PD susceptibility.
In the results of genetic correlation analysis between different phenotype pairs, a positive correlation indicates that the increased risk for one condition or higher values of a continuous trait is associated with increased risk or higher values of another trait. Conversely, a negative correlation means that an increased risk for one condition or higher values of a trait is associated with a decreased risk or lower values of another trait60,61. GNOVA estimates genetic covariance using summary data of shared genetic variations between two GWAS and then calculates genetic correlation based on genetic covariance and variance-based heritability. Both LDSC and GNOVA analyses can statistically explain the possibility of sample overlap between PD and biomarkers.
Pleiotropic Enrichment Analysis
For biomarkers with significant genetic associations with PD, we further investigated whether the genetic overlap between these biomarkers and PD is mediated by shared regulatory mechanisms in gene expression.
To evaluate the pleiotropic enrichment between two traits, stratified Q-Q plots were employed. Such plots typically depict nominal P-values (−log10(p)) on the y-axis against empirical quantiles (−log10(q)) on the x-axis. Pleiotropic enrichment can be discerned by the leftward deviation from the expected null line, as the primary trait successively depends on different significance levels of blood biomarkers. If indeed pleiotropic enrichment exists, an early departure from the null line towards the left will be evident. Larger gaps between the stratified Q-Q curves visually indicate higher levels of pleiotropic enrichment between the two traits.
To confirm these enrichment effects, fold-enrichment plots were generated. These plots illustrate the fold-enrichment of nominal −log10(P) values for PD SNPs below the conventional GWAS threshold of P < 5 × 10⁻⁸, as well as for subsets of SNPs categorized based on the significance of their association with biomarkers and vice versa. Fold-enrichment is evaluated by the extent of upward deviation from the null line.
We employed the conditional false discovery (condFDR) rate method to identify shared risk loci between biomarkers and PD. Specifically, condFDR was used to detect PD-associated SNPs related to the biomarker, and vice versa. The condFDR was utilized to identify SNPs jointly associated with both PD and the biomarker. After applying the condFDR procedure to both traits, the conjFDR analysis reported loci that simultaneously exceeded the significance threshold for condFDR in both traits, where the threshold is defined as the maximum of the condFDR values for the two traits, with a significance level set at 0.0162.
GWAS Summary Statistics
In this study, the exposure and outcome GWAS data were obtained from the open-access database (https://gwas.mrcieu.ac.uk/)63,64. We utilized GWAS data for IGF-1 and CRP from the IEU database (ebi-a-GCST90014008 and ebi-a-GCST90014002, respectively). These data were derived from a genome-wide association study (GWAS) conducted on up to 407,746 participants of White British ancestry from the UK Biobank. Analyses were performed using the REGENIE software, which employed a rank-based inverse normal transformation to convert quantitative phenotypes into Z-scores. Regarding the IRF, we utilized publicly available GWAS results collected by the Neale Lab (ukb-d-30280_irnt), which include summary statistics for both the raw and rank-normalized versions of these biomarker measurements. Additionally, the statistical model adjusted for population stratification by incorporating age, age squared, sex, an age-by-sex interaction term, and the top ten principal components provided by the UK Biobank65. GWAS data for PD outcomes were obtained from the International Parkinson’s Disease Genomics Consortium (IPDGC; ieu-b-7). This analysis integrated data from three previously published studies, 13 new datasets, and UKD. Their case included clinician-identified PD cases and 23andMe self-reported cases and UK Biobank proxy cases66.
The instrumental variables (SNPs) must satisfy three core assumptions: First, relevance: SNPs must be robustly associated with the exposure. Second, independence: SNPs should not be influenced by confounders of the exposure-outcome relationship, such as population stratification or selection bias. Third, exclusion restriction: SNPs should affect the outcome only through the exposure pathway, implying no horizontal pleiotropy.
For Assumption 1, SNPs with P < 5 × 10⁻⁸ served as instrumental variables for MR analysis, and excluded variants with an F-value < 10 to minimize weak instrument bias67. In addition, We excluded SNPs located within a 5000-kb range upstream and downstream of the most significant SNP to minimize linkage disequilibrium and avoid including SNPs that might be correlated (r2 > 0.01 in the 1000 Genomes European data). For hypothesis 2, we excluded the same SNPS in the GWAS data of the covariates in our Cox proportional hazard regression model I to rule out potential mixing and found two SNPS rs11642090 and rs7259070 that existed between BMI and IGF-1. For Assumption 3, We used the MR-egger test to rule out pleiotropy.
Bidirectional Mendelian Randomization
In this study, we employed four methods to investigate the potential causal relationship between biomarkers and PD: inverse-variance weighted (IVW), weighted mode, weighted median, and MR-Egger. When all selected SNPs are valid instruments, the IVW method is considered the most accurate and efficient for estimating causal effects, particularly suitable for using multiple genetic variants as instruments68. The weighted mode method is similar to the IVW method but allows for the consideration of correlation between genetic instruments and is used when employing a set of conservative genetic instruments. The weighted median method is a robust MR approach that estimates causal effects by calculating the median of the ratio estimates from genetic variants and is resilient to outliers. The MR-Egger method accommodates horizontal pleiotropy in the instruments but requires that the pleiotropy is independent of the variant-exposure association.
To test the robustness of the MR results, we conducted additional sensitivity analyses, including using Cochran’s Q statistic to measure heterogeneity, MR-Egger regression to assess potential pleiotropy in the SNPs used as instruments, and leave-one-out analysis by sequentially removing genetic variants from the analysis and re-estimating the causal effect to evaluate the dependence on specific variants.

Responses