Earthquake-based multi-hazard resilience assessment: a case study of Istanbul, Turkey (neighborhood level)
")
Introduction
Earthquakes are among the deadliest natural hazard-induced disasters. They occur suddenly and lead to irreparable damage to the environment and human lives. According to Cred1, only between 2000–2019, ~721,318 death tolls caused by earthquakes have been recorded globally causing $636 billion economic losses. Around the world, many earthquake zones coincide with densely populated areas. The rapid expansion of urban areas, coupled with inadequate planning, and insufficient infrastructure, has significantly heightened seismic risks and vulnerability in Istanbul2,3. Today, more than half the world’s population lives in cities, and this number is expected to grow by 75% by 20504. As the trend of population growth and urbanization continues to accelerate, it is clear that more and more people will be at increased risk of earthquakes. This means that the first priority should be given to risk mitigation and adaptation of the urban environment. Therefore, seismic resilience assessment plays an important role in efficient city management and safety planning. Resilience originates from the Latin word ‘resiliere’, signifying “to rebound” or “to bounce back”5. Resilience denotes a system’s capacity to withstand or assimilate disruption and restore its operations following such disturbance6. The United Nation International Strategy for Disaster Reduction7 explains the term “resilience” as the capacity of a threatened system, community, or society to absorb the full adverse effects of a disaster, resist and recover quickly. This includes efforts to protect and restore essential structures and functions through comprehensive risk management approaches. The resilience assessment framework combines various attributes across multiple dimensions to assess and analyze how the system responds to and recovers from disasters8. Regions with low resilience could be identified using assessment models, and communities’ responses could be estimated based on different scenarios. Such information assists in deploying proactive measures to enhance disaster resistance. Prior awareness of low-resilience regions aids in planning emergency responses during disasters and identifying the needs of impacted residents in the recovery phase.
Numerous methodologies for assessing resilience have been introduced so far. However, before talking about the methods, the scale of the study should be defined as it has impact on the selected methodology9. The assessment scale size can range from a neighborhood to a county. It has a direct impact on the dataset required and the modeling strategies. A worked implemented by Sharifi9 reviewed 36 selected community resilience assessment tools. Of these selected instruments, 15 were developed to assess the resilience of American settlements. A further 8 tools have been developed by various international sponsoring organizations and have been used to assess damage control in other countries around the world. The remaining tools were developed for use in countries such as Canada, South and Southeast Asia, Korea, Japan, Africa, Australia, and Saudi Arabia. It is important to note here that many countries still suffer from a lack of tools developed by national local governments and organizations. Among variety of methods, expert systems such as analytical network process is a category of soft computing techniques which have been suggested by many researchers to perform resilience assessment10,11. The reason is that uncertainty and fuzziness are main challenges in resilience assessment scope which can be overcome using such techniques12.
Earthquake resilience assessment methods can be broadly classified into two categories: indicator-based and functionality-based approaches13,14. Indicator-based methods assess resilience by summarizing a comprehensive set of indicators that influence resilience, across various dimensions. Qualitative or quantitative values are assigned to these indicators based on predefined criteria. The overall resilience indicator is then calculated through integration, providing a holistic measure of resilience14. Functionality-based methods, on the other hand, use functionality curves to represent changes in the performance of critical systems (e.g., hospitals) during and after an earthquake. These curves are used alongside summary metrics to quantify resilience. Interestingly, some measures employed in functionality-based methods align closely with the indicators or domains used in indicator-based methods15.
A notable contribution to functionality-based methods is the approach embedded within Probabilistic Performance-Based Earthquake Engineering proposed by Jiang et al.16. This method incorporates uncertainties throughout the lifecycle of buildings, enabling comprehensive analysis. A case study of a ten-story reinforced concrete (RC) moment-resisting frame building demonstrates the method’s applicability. Results highlight that the building’s resilience index can be effectively and reasonably calculated under varying earthquake intensity levels.
In a separate development, Li et al.17 introduced a probability-based method using the state tree model to evaluate the seismic resilience of substation systems. The state tree method has the distinct advantage of establishing a one-to-one correspondence between the operational states of a system and its components. This enables the application of Monte Carlo simulations to model the dynamic recovery processes of damaged systems. Furthermore, system functionality is quantified using weight coefficients assigned to different components based on user demands, making this method particularly adaptable.
In 2016, Estekanchi et al.18 presented a framework for calculating a quantitative measure of seismic resilience using the Endurance Time (ET) method. This approach involves subjecting structures to gradually intensifying dynamic excitations and assessing their performance at various excitation levels. By reducing computational effort, the ET method offers an efficient alternative for resilience analysis.
To address urban seismic resilience, Pan et al.19 proposed a performance-based method that compares a city’s desired post-earthquake performance with its actual performance. This method incorporates a set of Post-Disaster Quality of Life indicators designed to quantify city performance. The Restored Quality of Life-Based Approach (REQUALIFE) builds on existing knowledge of urban resilience and emphasizes the core performance of urban systems within the context of disaster management. Their findings demonstrate that REQUALIFE is an effective tool for evaluating and enhancing urban seismic resilience. Additionally, it provides a theoretical and methodological foundation for future studies aimed at improving insights into urban seismic resilience.
As it has been discussed above, traditional methods such as analytic hierarchy process (AHP) have been repeatedly used in resilience analysis. Moghadas et al.20 developed a hybrid multi-criteria approach using AHP-TOPSIS to assess district level urban flood resilience in Tehran, Iran across six dimensions: social, economic, institutional, infrastructural, community capital, and environmental resilience. Zhang et al.21 evaluated urban disaster resilience to rainfall-induced landslides across 57 sub-districts of Shenzhen in China, by using Support Vector Machines for physical resilience and Delphi-AHP for social resilience. Mabrouk and Haoying22 employed Fuzzy AHP integrated with VIKOR, TOPSIS, and WSM to assess flood-prone urban districts in Alexandria, Egypt by analyzing 41 flood-related indicators. While these methods have significantly contributed to urban resilience studies, they have notable limitations, such as reliance on extensive data inputs and potential inconsistencies in pairwise comparisons.
The Bayesian BWM addresses these challenges by offering several advantages23. It incorporates probabilistic reasoning, allowing for the integration of uncertainty and variability in decision-making processes. By defining the best and worst criteria beforehand, Bayesian BWM simplifies pairwise comparisons and ensures consistency while reducing the cognitive load on decision-makers23,24,25. Moreover, it balances efficiency with robustness, as it requires fewer comparisons than traditional methods while still enabling consistency checks. Its ability to account for uncertainty and incorporate prior expert knowledge makes it particularly well-suited for complex resilience assessments, such as urban disaster management under uncertain conditions.
Relating the scope of the study, when someone considers the roles and responsibilities of communities in disaster risk reduction, strengthen the resilience at the neighborhood level can be highly effective in reducing risks and increasing preparedness26. There is a clear support for this issue among scholars. According to Cannon and Twigg27, in-depth research on disaster resilience should continue at the local level, especially in developing countries. Aslani et al.28 also shares the same view, insisting that resilience assessment needs to be further developed at neighborhood level. However, it must be understood that urban neighborhoods are complex systems consisting of various interactions, including physical, socioeconomic and environmental subsystems. Besides, densely populated urban areas have further complicated this complex system29. Therefore, it is necessary to study disaster resilience at this level. As also stated by Coulton et al.30, neighborhood is an important scale in resilience research. Overall, resilience is inherently social in nature as it involves the concept of collective and cooperative efforts to withstand natural hazard-induced disasters31.
The primary objective of this study is to develop a comprehensive multi-hazard resilience assessment model for Istanbul at both district and subdistrict (neighborhood) levels, including earthquakes, landslides, and tsunamis. By analyzing 28 resilience indicators across 961 subdistricts in 39 districts, this research aims to evaluate resilience and offer granular insights into urban resilience and disaster risk mitigation. This study is novel in several key aspects: it adopts a multi-hazard approach to resilience assessment, considering earthquakes, landslides, and tsunamis simultaneously in Istanbul, which is a city with a high risk of these devastating disasters, yet remains underprepared with limited disaster planning strategies. It is the first to apply the Bayesian Best Worst Method (Bayesian BWM) in resilience assessment. These unique features make this comprehensive research a novel contribution to the field, offering a robust framework for prioritizing resilience in disaster-prone urban areas. They make the study a valuable contribution to the field, providing actionable insights for governments and municipalities to enhance resilience from the subdistrict to the city level. The proposed framework is not only applicable to Istanbul but also adaptable to other disaster-prone urban areas, offering a robust tool for disaster risk management. The current paper is organized into the remaining sections as follows. The next section introduces the study area and its districts. “Methods” outlines the data used and proposed methodology. “Results” represents the Bayesian BWM results. The conclusion of the study is presented in “Discussion”.
Study area
Located in the northwestern part of Turkey, Istanbul is the unique city that connects the European and Asian parts through the Bosporus Strait, which at the same time provides the only passage from the Black Sea to the Sea of Marmara (Fig. 1). Istanbul is also one of the most populated cities in the country. It is a home to almost 16 million inhabitants and its area is nearly 5461 km232. Istanbul consists of 39 districts, of which 25 and 14 belong to the European and Asian sides, respectively. Consequently, the majority of population lives on the European side making a total of 65%, while the remaining 35% resides on the Asian side. The most populated municipality is located in European part, named as Sultangazi, with population density of nearly 54 thousand people per square kilometer, whereas the smallest region, Sile, located on the Asian side with the population density of 44 people per square kilometer32. Due to the hilly topography and the influence of marine ecosystem, Istanbul has a temperate climate with the highest rainfall occurring between October and February and the least rainfall being recorded between May and August. In the city, the average monthly rainfall is 690.5 mm and the average annual temperature is recorded at 16.2 degrees Celsius33. The overall topography can be described as sloping, with the steepest slopes of almost 20% and 14% for the European and Asian parts, respectively. According to land cover dataset extracted from the Coordination of Information on the Environment (CORINE), the northwestern and northeastern territories are covered with forests, including mixed, broad-leaved and coniferous forests34. The southwestern part of the city is covered with non-irrigated lands, while urban areas are concentrated mainly in the central parts of the city35.
")
The map was produced using QGIS 3.34.
In terms of tectonics, Istanbul is particularly prone to strong earthquakes due to an active dextral strike-slip fault, the North Anatolian Fault (NAF), which is the transform boundary between the Eurasian and the Anatolian plates36. Although the NAF does not physically run through the city itself, its active section under the Sea of Marmara constitutes a seismic gap capable to cause an earthquake with a magnitude over 7.037. During its seismic history, NAF has produced a remarkable series of large earthquakes, including the great Istanbul earthquakes in 1766 and 1894, and the most recent Izmit earthquake in 1999 caused enormous damage to Istanbul, not only in economic terms but also in terms of mortality. As many studies show, the seismic potential of the NAF segment, which is only tens of kilometers from Istanbul, is high enough to hit the city with a magnitude of more than 7.0 within the next decades38. Apart from the natural risks of earthquakes in the city, the potential seismic hazard has significantly increased due to external factors such as population density issue, defective land use planning, faulty constructions, degradation of the environment, etc.39. Therefore, earthquake resilience assessment of Istanbul is of growing importance since such assessment is essential for proper planning and management.
Methods
Data used on the subdistrict level
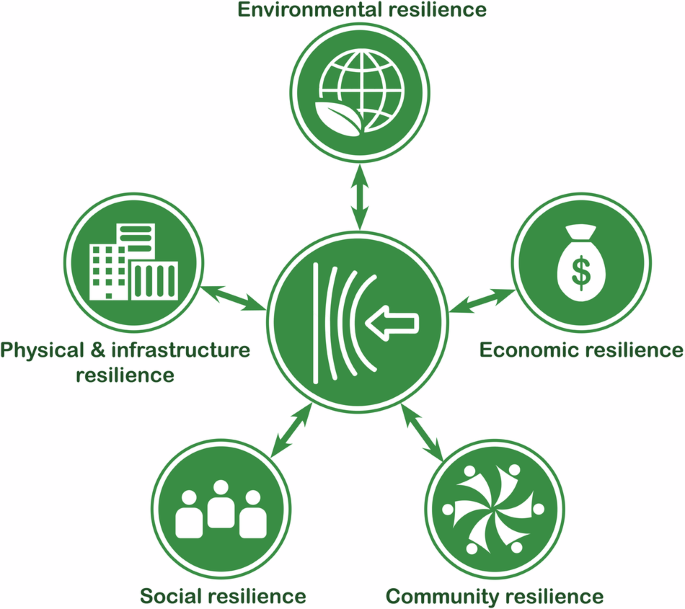
As noted earlier, the choice of data to be collected for resilience analysis is highly dependent on the scale of the area being studied, but data availability is another critical aspect. Within the frame of this study, we aimed to conduct a detailed assessment of earthquake resilience for Istanbul city. For this purpose, we include all subdistricts (neighborhoods) of the city’s 39 districts. Since there is no established methodology in the literature for selecting or collecting the required data, we conducted a literature review and used previous knowledge on the topic. Among the variety of seismic resilience variables, the most commonly used were selected based on data availability for our study area. Figure 2 indicates that the variables were divided into 5 categories including (1) Social resilience indicators, (2) Economic resilience indicators, (3) Physical and infrastructure resilience indicators, (4) Community resilience indicators, and (5) Environmental resilience indicators. These indicators, along with their sources, are shown in Table 1.
The figure was created using Autodesk AutoCAD 2025.
For social resilience indicators, ten factors were chosen: population density, childcare density, children population density, disability density, education level map, proportion of female to male population, families less than five members density, night population density, nursing homes density, and elderly population density. Economic resilience indicator includes income level status. For physical and infrastructure resilience, we selected buildings constructed prior 1980 including commercial and residential buildings density, we used also building construction density, building density, mean building height, fire stations density, police stations density, health services density, schools’ density. Such variables as cultural facilities density, gathering points density, recreational areas density, and religious places density were used for community resilience indicators. Finally, earthquake risk map, landslide risk level, and tsunami risk map were selected as environmental resilience indicators.
The correlation of each variable with earthquake resilience will be discussed as follows. Prior to that, it’s important to note that some factors have positive or negative impacts on earthquake resilience. For example, for some factors, such as hospital density, a higher density means higher resilience, and vice versa.
Childcare density
The availability and density of childcare facilities play a critical role in enhancing disaster resilience both during and immediately after an earthquake40. Childcare centers provide essential services that ensure the safety, care, and well-being of one of the most vulnerable groups in society: children. Research suggests that the established relationships between childcare workers and children contribute to a stronger psychological bond, enabling caregivers to respond more effectively and calmly in crisis situations41.
In resilience assessments, childcare density shows a positive correlation with a neighborhood’s ability to recover from disruptive events. Higher density indicates better preparedness and capacity for organized response during emergencies. Figure 3a highlights that the subdistricts with the highest childcare density scores are concentrated in central, more urbanized areas. For instance, Topkapi (Fatih) leads with a density score of 77.9 childcare services per square kilometer, followed by Esentepe (Sisli) with 38.9, and Atakent (Umraniye) with 21.3. These subdistricts benefit from robust infrastructure, which contributes to their enhanced capacity for emergency response, particularly for vulnerable populations such as children. Conversely, Adalar, an island district, exhibits some of the lowest childcare density scores, with subdistricts such as Nizam, Maden, Kinaliada, and Burgazada reporting zero facilities. This disparity is particularly critical for Adalar, where geographic isolation could further delay disaster response efforts, compounding the challenges faced by families with young children.
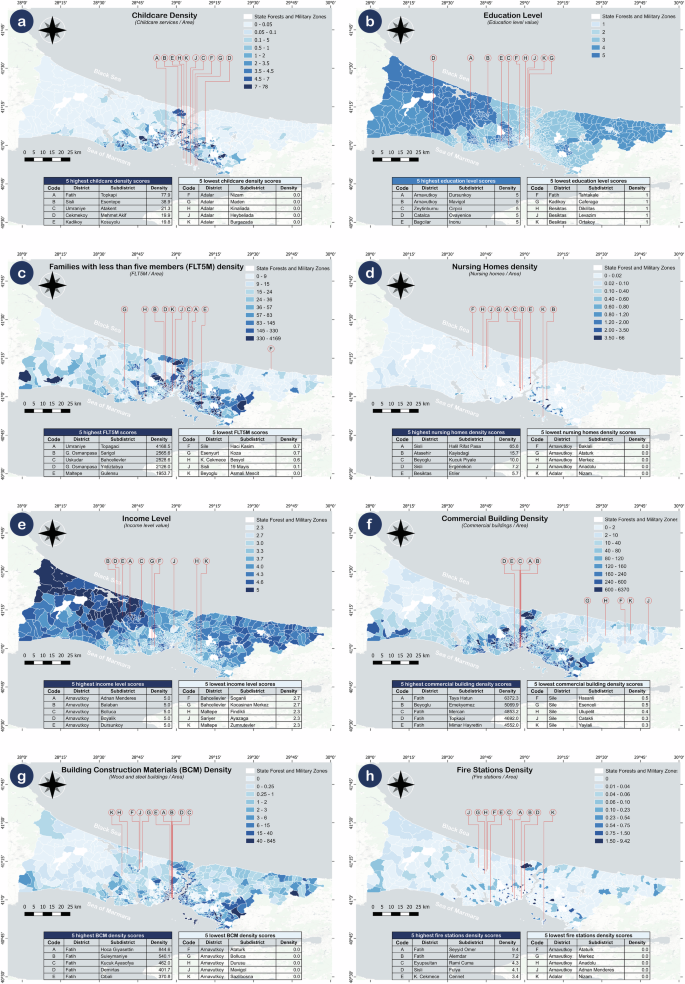
a Childcare density, b education level, c FLT5M density, d nursing homes density, e income level, f commercial building density, g BCM density, h fire stations density. The maps were produced using QGIS 3.34.
Education level
Disaster education and training of local communities play a crucial role in reducing risk and enhancing resilience. Specific disaster-related education ensures that the population is not only physically but also mentally prepared to cope with the immediate impacts and the aftermath of an earthquake. As noted by Muttarak and Pothisiri42, disaster education equips individuals to manage stress and fear during seismic events, while also providing the knowledge needed to recover more effectively post-disaster. Shang et al.43 emphasize that earthquake education significantly improves the understanding and perception of early warning systems, leading to faster and more effective evacuation responses during emergencies.
Figure 3b illustrates the spatial distribution of education levels across Istanbul’s subdistricts. Notably, the highest education level scores are concentrated in districts such as Dursunkoy (Arnavutkoy), Mavigol (Arnavutkoy), Cirpici (Zeytinburnu), Ovayenice (Catalca), and Inonu (Bagcilar), all of which scored the maximum value of 5. These regions, with higher education levels, are expected to exhibit stronger community resilience due to better awareness, preparedness, and response capabilities. Conversely, subdistricts such as Tahtakale (Fatih), Caferaga (Kadikoy), Dikilitas (Besiktas), Levazim (Besiktas), and Ortakoy (Besiktas) have some of the lowest education level scores, with values of 1. These areas may be more vulnerable to the impacts of an earthquake, as lower education levels could limit the effectiveness of disaster preparedness and response strategies.
Families with less than five members (FLT5M) density
The number of family members plays a significant role in influencing a household’s resilience to earthquakes. Smaller households tend to have advantages in resource allocation, both during and after a disaster, as there are fewer individuals to support. Conversely, larger families may face increased challenges, as they have more people at risk and require greater resources for basic needs, such as food, water, and shelter42. Therefore, neighborhoods with a higher density of families with fewer than five members generally demonstrate greater earthquake resilience.
Figure 3c highlights that Topagaci (Umraniye) exhibits the highest density of families with fewer than five members, with a value of 4168.5 families per square kilometer. Other notable subdistricts include Sarigol (G. Osmanpasa) with 2565.6, and Bahcelievler (Uskudar) with 2528.6. These areas are expected to have a comparative advantage in terms of disaster response and recovery due to their demographic structure. Subdistricts such as Asmali Mescit (Beyoglu), 19 Mayis (Sisli), and Besyol (K. Cekmece) exhibit some of the lowest densities, with scores below 1, indicating a higher concentration of larger families, potentially reducing their resilience to earthquake-related risks.
Nursing homes density
As noted by Heppenstall et al.44, nursing home residents often face significant challenges in coping with environmental changes during disasters, making them highly vulnerable. These residents may struggle to comprehend or act upon evacuation procedures, which increases their risk during emergencies such as earthquakes. The greater the density of nursing homes in a given area, the higher the resilience of that population, as these facilities are staffed with trained medical personnel who can provide immediate care and guidance during evacuations. Figure 3d shows that Halil Rifat Pasa (Sisli) has the highest nursing home density, with 65.8 nursing homes per square kilometer. Other subdistricts with relatively high nursing home densities include Kayisdagi (Atasehir) with 15.7, and Kucuk Piyale (Beyoglu) with 10.0. Several subdistricts, particularly in Arnavutkoy and Adalar, such as Baklali (Arnavutkoy), Ataturk (Arnavutkoy), and Nizam (Adalar), report no nursing home facilities, reflecting a potential vulnerability for populations in need in these areas during an earthquake.
Income level
Socioeconomic status is a key determinant of earthquake resilience. According to Febriyanti et al.45, individuals with higher income levels tend to be more resilient to disasters because they have access to more social, economic, and physical resources compared to lower-income populations. These resources enhance not only their ability to prepare for disasters but also their capacity to recover afterward46. Income level plays a particularly important role in the recovery phase. Higher-income populations can invest in earthquake-resistant infrastructure, thereby reducing the risk of structural damage and casualties47. In addition, wealthier communities are better equipped to facilitate mobility during emergencies, including more efficient resource allocation, faster evacuation processes, and reduced traffic congestion48. Conversely, poverty and social inequality exacerbate the impacts of disasters49. Lower-income populations are more vulnerable to natural hazards and often experience more severe economic losses in the aftermath50.
Figure 3e shows that the Adnan Menderes (Arnavutkoy) subdistrict, along with other subdistricts in Arnavutkoy like Balaban, Bolluca, Boyalik, and Dursunkoy, each have the highest income level scores of 5.0. These regions are expected to show stronger earthquake resilience due to the availability of financial resources that can be channeled into both preparedness and recovery efforts. Conversely, subdistricts such as Soganli (Bahcelievler), Kocasinan Merkez (Bahcelievler), and Findikli (Maltepe) report the lowest income levels, with values as low as 2.3. These neighborhoods may face more significant challenges in both the immediate response to and recovery from an earthquake due to limited access to financial resources and infrastructure.
Commercial building density
Commercial institutions play a crucial role in enhancing disaster resilience during both the mitigation and recovery phases. During the mitigation period, the business sector contributes to the local economy’s financial stability, ensuring that communities remain economically secure and prepared for potential disasters. By investing in more resilient infrastructure, the commercial sector can mitigate earthquake risks through improved building quality and safety standards. In the recovery phase, commercial institutions become even more vital by providing essential services, employment opportunities, and ensure the supply and delivery of critical goods51. Figure 3f reveals that the Taya Hatun (Fatih) subdistrict boasts the highest commercial building density with a score of 6372.3 buildings per square kilometer. Other subdistricts with high commercial building density include Emekyemez (Beyoglu) with 5069.9 and Mercan (Fatih) with 4853.2. These areas are well-positioned to contribute to disaster resilience, both in terms of economic stability and infrastructure investment. Hasanli (Sile), Esenceli (Sile), and Ulupelit (Sile) have some of the lowest commercial building densities, with values below 1.0. These subdistricts may face challenges in both mitigation and recovery efforts due to a lack of commercial infrastructure that could support economic resilience and provide essential services post-disaster.
Building construction materials (BCM) density
The types of materials used in the construction of urban buildings are crucial in seismic resilience analysis, as different materials and structural types respond differently to seismic forces. Buildings constructed from wood and steel are widely regarded as safer and more resilient during earthquakes due to their flexibility and ability to absorb seismic energy52. For this study, we focused on wood and steel buildings, as these materials are considered to provide superior protection in earthquake-prone areas. Figure 3g illustrates the distribution of wood and steel structures across various subdistricts in Istanbul. Hoca Giyasettin (Fatih) has the highest density of buildings constructed from wood and steel, with a score of 844.6 buildings per square kilometer, followed by Suleymaniye (Fatih) with 540.1, and Kucuk Ayasofya (Fatih) with 462.0. These subdistricts are expected to have better seismic performance due to the prevalent use of more resilient building materials. Conversely, subdistricts in Arnavutkoy, such as Ataturk, Bolluca, and Durusu, report zero wood and steel buildings, which could indicate a higher vulnerability to seismic damage in these areas. Increasing the use of resilient materials like wood and steel in these neighborhoods could significantly improve their earthquake resilience.
Fire stations density
One of the critical factors that contribute to improving community resilience is the presence and distribution of fire stations53. Fire stations play an essential role in emergency preparedness and response, as their strategic placement allows for a rapid response to fires, preventing their spread and minimizing further damage during and after an earthquake. Additionally, firefighters are trained in search and rescue techniques, which are invaluable during emergencies and disaster recovery efforts54. Figure 3h shows that Seyyid Omer (Fatih) has the highest fire station density, with 9.4 fire stations per square kilometer. Other subdistricts with relatively high fire station densities include Alemdar (Fatih) with 7.2 and Rami Cuma (Eyupsultan) with 4.3. These areas are likely to benefit from quicker emergency responses, contributing to overall community resilience. Several subdistricts in Arnavutkoy, such as Ataturk, Merkez, and Anadolu, report zero fire stations. This lack of fire services infrastructure could hinder timely emergency response and rescue operations, potentially increasing the risk of damage and casualties during a disaster. The Nizam (Adalar) subdistrict also exhibits a lack of fire station facilities, which is concerning given the island’s geographical isolation.
Police stations density
Similar to firefighters, police officers play a crucial role in emergency response during and after disasters. They are often among the first responders, providing immediate assistance, coordinating rescue operations, and distributing essential resources. Additionally, police maintain public order, ensure safety, and oversee the enforcement of laws during emergencies55. Their presence is essential in controlling panic, managing traffic, and securing vulnerable areas, which is critical for effective disaster management. Figure 4a shows that Kuloglu (Beyoglu) has the highest police station density, with 9.4 stations per square kilometer. Other subdistricts with high police station density include Balabanaga (Fatih) with 8.8 and Kemankes K. (Beyoglu) with 7.2. These areas are likely to benefit from a faster and more organized response in the event of an earthquake, contributing to overall community resilience. Subdistricts such as Ataturk (Arnavutkoy), Merkez (Arnavutkoy), and Maden (Adalar) report zero police stations. The absence of law enforcement infrastructure in these areas may lead to slower response times and difficulties in maintaining order during emergencies, reducing the resilience of the population to both the immediate and long-term impacts of a disaster.
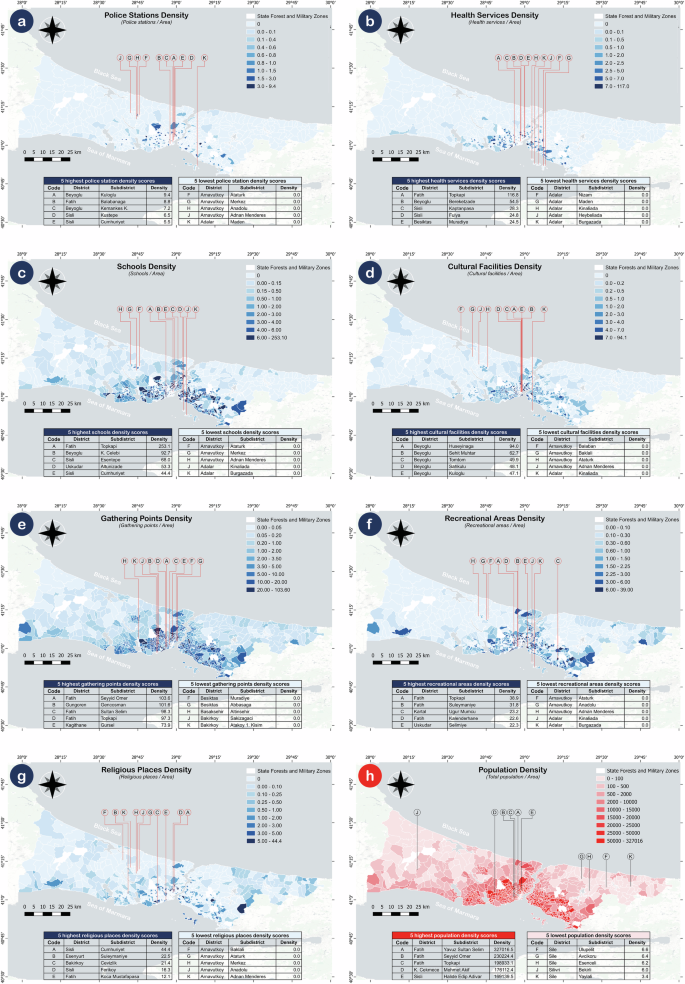
a police stations density, b health services density, c schools density, d cultural facilities density, e gathering points density, f recreational areas density, g religious places density, h population density. The maps were produced using QGIS 3.34.
Health services density
Health care institutions play a critical role in reducing the number of casualties during and after an earthquake. According to Rawat et al.56, providing immediate medical care and assistance is crucial in minimizing fatalities and ensuring timely treatment of injuries. Additionally, health services manage medical supplies, coordinate emergency response efforts, and collaborate with other health centers and community organizations to ensure a comprehensive and effective response19,57. Figure 4b highlights the distribution of health services across Istanbul. Topkapi (Fatih) boasts the highest density of health services with 116.8 per square kilometer, followed by Bereketzade (Beyoglu) with 54.5 and Kaptanpasa (Sisli) with 28.3. These areas are well-positioned to provide immediate medical assistance during a disaster, enhancing their overall earthquake resilience. The island subdistricts of Adalar, such as Nizam, Maden, Kinaliada, and Burgazada, report no health services. This lack of medical infrastructure in these subdistricts presents significant challenges in terms of emergency response and medical care availability during a disaster. Increasing health service density in these areas could significantly improve their resilience to seismic events.
Schools density
Earthquakes, like other natural hazards, significantly threaten the lives, physical health, and psychological well-being of children58. During an earthquake, schools play a vital role as focal points for coordination and communication. They assist emergency workers by providing shelter and resources, while school staff offer both moral and practical support to children, as well as keep parents and local communities informed about the status of their children49. In the aftermath of an earthquake, schools also play an essential role in restoring normalcy to community life. After the 1999 earthquake in Turkey, a special School Reactivation Program was launched to mitigate post-traumatic stress and other psychological disorders suffered by children during the disaster. Remarkably, children participating in this program showed significant improvements within just a few weeks, while those in control groups took up to 3 years to reach similar levels of recovery59.
Figure 4c demonstrates that Topkapi (Fatih) has the highest schools density, with 253.1 schools per square kilometer, followed by K. Celebi (Beyoglu) with 92.7 and Esentepe (Sisli) with 68.0. These areas are likely to benefit from schools acting as critical centers of resilience during and after an earthquake. In contrast, subdistricts in Arnavutkoy and Adalar, such as Ataturk, Merkez, and Kinaliada, report zero school density. This lack of educational infrastructure may limit the community’s ability to recover quickly after a disaster and negatively affect the well-being of children and their families.
Cultural facilities density
Cultural sites often function as important community hubs for public gatherings, events, and various activities. During and after disasters such as earthquakes, these spaces can be repurposed to support early emergency response efforts and provide a base for recovery operations60. In this study, cultural facilities are defined to include libraries, exhibitions, cinemas, and theaters, all of which can serve as valuable resources for both immediate relief and long-term recovery. Figure 4d highlights the distribution of cultural facilities across subdistricts in Istanbul. Huseyinaga (Beyoglu) boasts the highest density of cultural facilities with 94.0 per square kilometer, followed by Sehit Muhtar (Beyoglu) with 62.7 and Tomtom (Beyoglu) with 49.9. These areas are well-positioned to leverage cultural facilities for emergency response and recovery operations due to their high concentration of such spaces. Conversely, several subdistricts in Arnavutkoy and Adalar, such as Balaban, Ataturk, and Kinaliada, report zero cultural facilities, which may limit their capacity to support community gatherings and emergency operations. Addressing the lack of cultural infrastructure in these areas could enhance their disaster resilience.
Gathering points density
A gathering point, or emergency assembly point, refers to a designated area where people are expected to gather in the event of an emergency for further evacuation, temporary shelter, or first aid. These areas are chosen based on specific criteria that ensure the protection and safety of the population during a disaster. The availability of a greater number of these areas is directly linked to enhanced earthquake resilience. In Turkey, earthquake gathering points are selected and established by local municipalities under the overall guidance of the Disaster and Emergency Management Presidency (AFAD)61. Figure 4e shows that Seyyid Omer (Fatih) has the highest density of gathering points with 103.6 per square kilometer, followed by Gencosman (Gungoren) with 101.6 and Sultan Selim (Fatih) with 98.3. These areas are better prepared for large-scale evacuations and emergency responses due to the availability of numerous gathering points. Subdistricts like Muradiye (Besiktas), Abbasaga (Besiktas), and Altinsehir (Basaksehir) have no designated gathering points, which could potentially reduce their resilience during an earthquake due to a lack of formal assembly areas for residents.
Recreational areas density
Recreational areas refer to lands specifically designed, constructed, and dedicated to outdoor activities such as parks, campgrounds, and picnic areas. However, during a disaster or emergency, recreational areas can be repurposed as gathering points where people seek temporary shelter, receive first aid, or await evacuation. Figure 4f shows that Topkapi (Fatih) has the highest density of recreational areas, with 38.9 per square kilometer, followed by Suleymaniye (Fatih) with 31.8 and Ugur Mumcu (Kartal) with 23.2. These subdistricts have a significant amount of open space, which can be utilized during emergencies for shelter and coordination purposes, thereby enhancing the community’s resilience to earthquakes. Subdistricts such as Ataturk (Arnavutkoy), Anadolu (Arnavutkoy), and Kinaliada (Adalar) report zero recreational areas, limiting the availability of outdoor spaces for use during emergencies. Addressing this gap could improve the emergency response capacity of these areas by providing safe, accessible gathering points during disasters.
Religious places density
Religious communities often play a vital role in society, especially in times of crisis. During emergencies, these communities can provide critical social support to populations affected by disasters, offering services such as temporary shelter, psychological assistance, and even socioeconomic support49. The presence of religious places is not only important for spiritual well-being but also for the coordination of relief efforts and offering refuge to those in need. Figure 4g shows that Cumhuriyet (Sisli) has the highest density of religious places, with 44.4 per square kilometer, followed by Suleymaniye (Esenyurt) with 22.5 and Cevizlik (Bakirkoy) with 21.4. These areas are well-positioned to leverage religious spaces for providing shelter and social assistance during and after an earthquake. Several subdistricts in Arnavutkoy, such as Baklali, Ataturk, and Merkez, report no religious places, which could limit the availability of such support services during a disaster.
Population density
Population density refers to the number of people living in a specific area, typically expressed per square kilometer. High population density significantly reduces the resilience of an area to seismic disasters. An earthquake occurring in a densely populated region is more likely to result in greater social consequences, with a higher number of injuries and fatalities compared to less populated areas50. Urban evacuation after an earthquake is complicated by the concentration of people attempting to leave the area, which can lead to congestion and delays in emergency response62. For this reason, population density is a crucial variable in assessing earthquake resilience.
Figure 4h illustrates that Yavuz Sultan Selim (Fatih) has the highest population density with 327,016.5 people per square kilometer, followed by Seyyid Omer (Fatih) with 230,224.4 and Topkapi (Fatih) with 198,933.1. These areas are highly vulnerable due to the large number of residents, making effective evacuation and emergency response more challenging during an earthquake. Subdistricts such as Ulupelit (Sile), Avcikoru (Sile), and Esenceli (Sile) have very low population densities, with values below 10 people per square kilometer, suggesting these areas may experience fewer casualties and less strain on emergency services in the event of a disaster.
Children population density
Children population density is a crucial factor to consider, following overall population density, as children are particularly vulnerable during disasters. Much like the elderly or disabled, children are physically and psychologically dependent on their caregivers, which places them at higher risk in the event of a disaster63. In emergencies, children may require additional assistance, shelter, or urgent evacuation, and their limited mobility can complicate the evacuation process64. The ability to effectively protect and evacuate children during an earthquake is essential to minimize casualties and ensure their safety. Areas with higher children population densities will need more focused disaster preparedness measures, including evacuation planning and temporary shelters that cater to the needs of young children.
Figure 5a demonstrates that Yavuz Sultan Selim (Fatih) has the highest children population density, with 68,116.1 children per square kilometer, followed by Mehmet Akif (K. Cekmece) with 44,920.3 and Seyyid Omer (Fatih) with 42,221.6. These areas will require enhanced evacuation and protection strategies due to their high concentrations of children. Subdistricts such as Ogumce (Beykoz), Gollu (Beykoz), and Bozhane (Beykoz) report zero children population density.
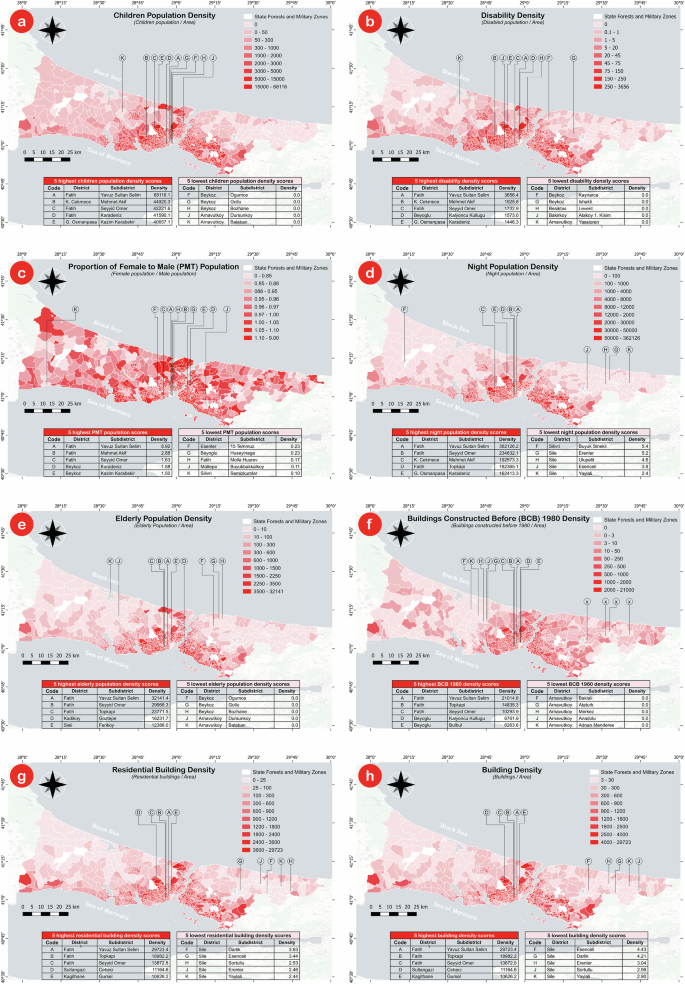
a children population density, b disability density, c PMT population, d night population density, e elderly population density, f BCB 1980 density, g residential building density, h building density. The maps were produced using QGIS 3.34.
Disability density
People with disabilities are particularly vulnerable during natural hazard-induced disasters. This is not only due to the physical challenges they face in evacuating or accessing help, but also because they often experience greater socioeconomic impacts, including increased financial burdens in the years following a disaster40. For instance, after the 1982 Coalinga earthquake in California, 38% of those injured were permanently disabled65. Such disabilities can have lasting effects on a family’s financial status and overall resilience, further exacerbating their social vulnerability66. Therefore, areas with higher disability densities tend to have lower resilience, as communities must contend with the additional challenges of supporting individuals with disabilities in both the short and long term.
Figure 5b shows that Yavuz Sultan Selim (Fatih) has the highest disability density, with 3656.4 people per square kilometer, followed by Mehmet Akif (K. Cekmece) with 1925.8 and Seyyid Omer (Fatih) with 1732.9. These areas are more vulnerable and require focused support and resources to improve their resilience to earthquakes. Subdistricts such as Kaynarca (Beykoz), Ishakli (Beykoz), and Levent (Besiktas) report zero disability density, suggesting they face fewer challenges related to disability in the event of a disaster.
Proportion of female to male (PMT) population
Understanding the roles, responsibilities, and experiences of men and women during an earthquake is critical for assessing how they cope with and recover from disasters. Generally, men have greater physical strength, while women tend to have lower levels of physical resilience, which may reduce their ability to withstand and recover from a disaster as compared to men67. Additionally, gender differences in emotional and physical resilience are evident not only in adults but also in adolescents. According to Stratta et al.67, male adolescents tend to cope with stressful situations more easily, while female adolescents are more sensitive to stress, becoming more vulnerable over time and losing resilience. This factor, therefore, shows an inverse correlation with earthquake resilience, with areas having a higher proportion of females to males likely to experience greater challenges in disaster recovery.
Figure 5c highlights that Yavuz Sultan Selim (Fatih) has the highest proportion of female to male population, with a score of 8.92, followed by Mehmet Akif (Fatih) with 2.88 and Seyyid Omer (Fatih) with 1.63. These areas may require additional resources and support to enhance their resilience to earthquakes, particularly in terms of addressing gender-specific needs. Subdistricts such as 15 Temmuz (Esenler), Huseyinaga (Beyoglu), and Molla Husrev (Fatih) report very low proportions of female to male population, with scores below 0.25, indicating a potential resilience advantage in terms of gender dynamics during disaster recovery.
Night population density
According to ref. 68, the distribution of population among settlements is typically higher at night compared to during the day, as most people are at home and asleep. This makes night population density a critical factor in assessing risk during earthquakes. At night, the level of consciousness and preparedness decreases, leaving individuals more vulnerable to injury and slower response times. As a result, this factor has an inverse relationship with earthquake resilience, as areas with high night population density are more likely to experience higher casualties and challenges in emergency response. Figure 5d shows that the Fatih district overall has the highest night population density, with Yavuz Sultan Selim (Fatih) leading at 362,126.2 people per square kilometer, followed by Seyyid Omer (Fatih) with 234,632.1 and Mehmet Akif (K. Cekmece) with 192,573.3. These areas are at higher risk during nighttime earthquakes due to the concentration of sleeping individuals. Conversely, subdistricts such as Buyuk Sinecli (Silivri), Erenler (Sile), and Ulupelit (Sile) have very low night population densities, with values below 6 people per square kilometer.
Elderly population density
Similar to individuals with disabilities, elderly people are particularly vulnerable during earthquakes due to physical limitations and health concerns69. The elderly population is often more affected not only physically but also socially and economically during disasters. These factors can greatly hinder their ability to adequately prepare for an earthquake and complicate the recovery process70. Figure 5e illustrates that the Fatih district has the highest elderly population density, with Yavuz Sultan Selim (Fatih) leading at 32,141.4 elderly people per square kilometer, followed by Seyyid Omer (Fatih) with 29,968.3 and Topkapi (Fatih) with 23,771.5. These areas may face significant challenges in responding to and recovering from earthquakes due to their large elderly populations. Subdistricts such as Ogumce (Beykoz), Gollu (Beykoz), and Bozhane (Beykoz) report zero elderly population density, suggesting that these areas may not face the same level of resilience challenges related to elderly residents during an earthquake.
Buildings constructed before (BCB) 1980 density
The age of a building is a critical factor in assessing its resilience to earthquakes71. Structures built before 1980 are often less earthquake-resistant compared to modern buildings due to several factors, such as the use of outdated construction technologies, lower-quality materials, and lack of adherence to modern seismic building codes. In contrast, modern buildings benefit from advanced construction regulations that prioritize seismic stability43. Figure 5f demonstrates that Yavuz Sultan Selim (Fatih) has the highest density of buildings constructed before 1980, with 21,014.8 buildings per square kilometer, followed by Topkapi (Fatih) with 14,835.3 and Seyyid Omer (Fatih) with 10,293.9. These areas face resilience challenges during earthquakes due to the presence of older buildings that may not meet current seismic standards. Subdistricts such as Baklali (Arnavutkoy), Ataturk (Arnavutkoy), and Merkez (Arnavutkoy) report no buildings constructed before 1980, indicating potentially higher resilience related to older infrastructure in these areas.
Residential building density
Residential building density is a critical factor in assessing emergency preparedness, as it is inversely related to earthquake resilience28. Higher residential density increases the risks associated with earthquakes, as closely packed buildings have a greater chance of collapsing or causing chain reactions that lead to more casualties. Additionally, overcrowded areas put enormous pressure on infrastructure, such as road networks, electrical systems, and communication channels, all of which are essential for effective emergency and rescue operations. Figure 5g demonstrates that Yavuz Sultan Selim (Fatih) has the highest residential building density, with 29,723.4 buildings per square kilometer, followed by Topkapi (Fatih) with 18,982.2 and Seyyid Omer (Fatih) with 13,872.8. These densely built areas are highly susceptible to structural damage during seismic events and may face significant challenges in terms of rescue and recovery efforts. Subdistricts such as Darlik (Sile), Esenceli (Sile), and Sortullu (Sile) report very low residential building densities, below 4 buildings per square kilometer. While these areas may be less vulnerable in terms of building collapses, they still require adequate emergency preparedness due to other factors, such as infrastructure access and response times.
Building density
As previously highlighted, densely populated and overcrowded areas experience a linear correlation between building density and the potential for structural damage, which significantly increases the risk of fatalities during an earthquake49. Building density also plays a crucial role in the evacuation process; the greater the number of buildings, the more complicated and delayed evacuation efforts can become72. Thus, assessing overall building density is an essential component of evaluating earthquake resilience and disaster preparedness. Figure 5h demonstrates that Yavuz Sultan Selim (Fatih) has the highest building density, with 29,723.4 buildings per square kilometer, followed by Topkapi (Fatih) with 18,982.2 and Seyyid Omer (Fatih) with 13,872.8. These densely constructed areas are highly susceptible to severe structural damage and pose significant challenges in terms of both evacuation and emergency response. Subdistricts like Esenceli (Sile), Darlik (Sile), and Sortullu (Sile) report very low building density scores, with densities below 5 buildings per square kilometer.
Average number of floors
Although modern tall buildings are designed to withstand seismic waves, this does not necessarily mean they are entirely safe and should be included in earthquake resilience analysis. High-rise buildings tend to shake longer than low-rise buildings during an earthquake, which makes them vulnerable to damage and even structural collapse73. Thus, the average number of floors in an area directly influences the level of earthquake risk. Figure 6a highlights that Cumhuriyet (Esenyurt) has the highest average number of floors with 11.13 floors per building, followed by Buyuksehir (Beylikduzu) with 10.26 floors and Mevlana (Esenyurt) with 9.46 floors. These areas may face heightened risks during an earthquake due to their taller buildings, which may experience prolonged shaking. Conversely, subdistricts like Ciftalan (Eyupsultan), Cayirdere (Silivri), and Esenceli (Sile) report the lowest average number of floors, with densities below 1.31 floors per building.
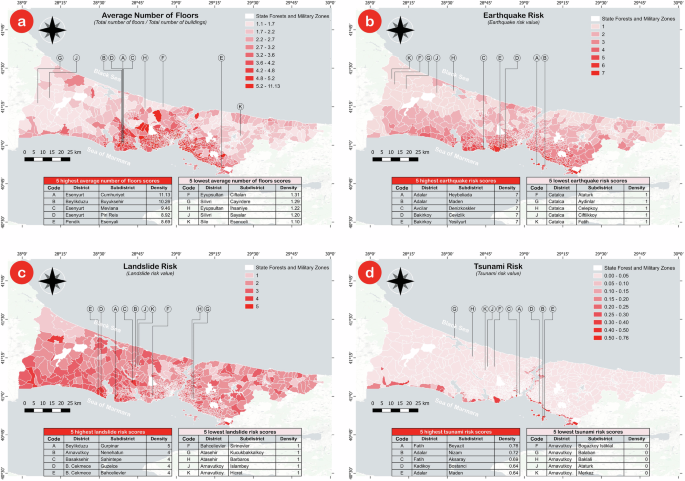
a average number of floors, b earthquake risk, c landslide risk, d tsunami risk. The maps were produced using QGIS 3.34.
Earthquake risk
Earthquake risk map is generated by integrating factors such as field topography, source-to-site distance, soil classification, liquefaction potential, and fault/focal mechanism, ensuring a comprehensive assessment of seismic susceptibility. Earthquake risk maps provide critical information related to seismic resilience. Areas with higher seismic risk are more likely to experience severe damage, both in terms of structural integrity and human lives. Consequently, these territories are considered less resilient and require greater attention for disaster preparedness and risk mitigation efforts74. Figure 6b shows that subdistricts like Heybeliada (Adalar), Maden (Adalar), and Denizkoskler (Avcilar) report the highest earthquake risk scores, all with a value of 7, indicating significant vulnerability in the event of a seismic event. These regions are expected to experience the most substantial damage and require enhanced emergency preparedness. Oppositely, subdistricts such as Ataturk (Catalca), Aydinlar (Catalca), and Celepkoy (Catalca) have the lowest earthquake risk scores, all at 1.
Landslide risk
The earthquake-induced landslide risk map is generated based on physical and environmental factors, including friction angle, saturation level, cohesion, slope, distance to source, earthquake magnitude. Strong seismic activity can trigger landslides, particularly in areas with unstable landscapes. Landslide risk maps provide crucial information for assessing disaster resilience. In regions prone to landslides, urban development is often restricted to minimize potential damage and loss of life during an earthquake75. By identifying high-risk areas, local authorities can enforce construction regulations and mitigate the severe consequences of earthquakes in such regions. Figure 6c highlights that subdistricts like Gurpinar (Beylikduzu), Nenehatun (Arnavutkoy), and Sahintepe (Basaksehir) report the highest landslide risk scores, with values ranging from 4 to 5. These areas are considered highly susceptible to landslides during seismic events and require strict land-use planning and development controls. Subdistricts like Sirinevler (Bahcelievler), Kucukbakkalkoy (Atasehir), and Barbaros (Atasehir) report the lowest landslide risk scores, all at 1.
Tsunami risk
The earthquake-induced tsunami risk map is calculated by integrating key factors such as earthquake source characteristics (magnitude, location, fault geometry, and slip distribution), seafloor deformation, coastal topography, and bathymetry. Tsunami risk maps are critical in understanding vulnerability along coastal areas. Communities in tsunami-prone regions face higher challenges in disaster recovery due to the dual threat of seismic activity and subsequent tsunamis76. Areas with higher tsunami risk are considered less resilient, as recovery efforts in these regions often require more time and resources. Figure 6d illustrates that Beyazit (Fatih), Nizam (Adalar), and Aksaray (Fatih) subdistricts show the highest tsunami risk scores, ranging from 0.69 to 0.76, making these areas particularly less resilient during seismic events that generate tsunamis. Oppositely, subdistricts like Bogazkoy Istiklal (Arnavutkoy), Balaban (Arnavutkoy), and Baklali (Arnavutkoy) report a tsunami risk score of 0, indicating they are not at risk for tsunami damage and can recover more rapidly after an earthquake.
Data used on the district level
The heatmap visualization in Fig. 7 illustrates the relative performance of 39 districts based on a set of 28 resilience-related criteria, standardized between 0 and 1. The criteria are split into two categories: 15 positive criteria, which enhance resilience, and 13 negative criteria, which reduce resilience. This visual representation allows us to identify how well-prepared each district is in terms of disaster resilience, with a specific focus on earthquake preparedness.
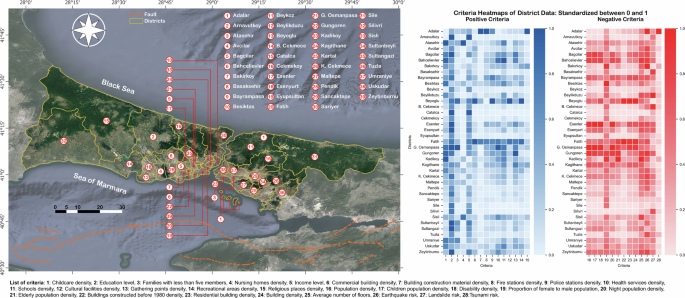
The map was produced using QGIS 3.34.
The left side of the heatmap highlights positive factors that contribute to earthquake resilience. These include variables such as income level, childcare density, access to emergency services (police and fire stations), and the availability of critical infrastructure like schools, healthcare facilities, and gathering points. Districts such as Fatih, Beyoglu, and Adalar exhibit stronger performance in these areas. For example, Fatih demonstrates significant resilience due to the availability of commercial building density, building construction material density, cultural facilities and recreational areas. Similarly, Adalar benefits from a relatively high density of emergency services and religious places, contributing to its preparedness for earthquake response and recovery. In these districts, the higher scores in infrastructure-related criteria suggest better preparedness for immediate disaster response, and their access to key services allows for more efficient coordination during emergencies.
In contrast, the right side of the heatmap displays the negative criteria, reflecting the challenges that reduce earthquake resilience. These include factors such as population density, disaster risks, such as earthquake, landslide, and tsunami, and vulnerable groups, such as disabled, elderly, and children. Districts like G. Osmanpasa, Gungoren, and Esenler are particularly marked by higher scores in these negative criteria, indicating significant vulnerabilities that may compromise their ability to effectively respond to and recover from an earthquake.
For instance, G. Osmanpasa suffers from high population density and an older building stock, both of which contribute to its limited resilience. The combination of densely packed buildings, many of which were constructed before modern seismic codes, and a large residential population places extreme pressure on emergency services and evacuation routes. In the event of a disaster, this district would likely face severe challenges, including delayed evacuation, increased casualties, and difficulty in providing immediate relief to residents.
By comparing these two sets of criteria, the heatmap provides a comprehensive overview of district resilience. Districts like Beyoglu demonstrate strong performance in positive criteria but face risks associated with older building stock and high residential density. These mixed profiles suggest that while they may have robust emergency infrastructure, overcrowding could hinder their disaster recovery efforts.
Bayesian Best-Worst Method (BWM)
The Bayesian BWM is an advanced multi-criteria decision-making approach that combines the traditional BWM with Bayesian inference to incorporate uncertainty and provide more robust weight estimations23. This methodology is particularly suited for evaluating complex systems such as our study for earthquake resilience, where multiple indicators need to be assessed and weighed accurately. The weights for the resilience indicators were collected through a structured survey distributed to a group of carefully selected decision-makers. These decision-makers included 4 academicians from universities specializing in urban planning, civil engineering, and disaster studies, and 2 disaster risk management experts, ensuring a diverse and multidisciplinary perspective. The selection criteria prioritized individuals with extensive experience and expertise in the fields relevant to Istanbul’s resilience challenges, ensuring that the panel was both knowledgeable and representative of the broader stakeholder community. Below are the main steps that we used to calculate the Bayesian BWM weights. Figure 8 shows the main steps that we used to produce the final resilience maps.
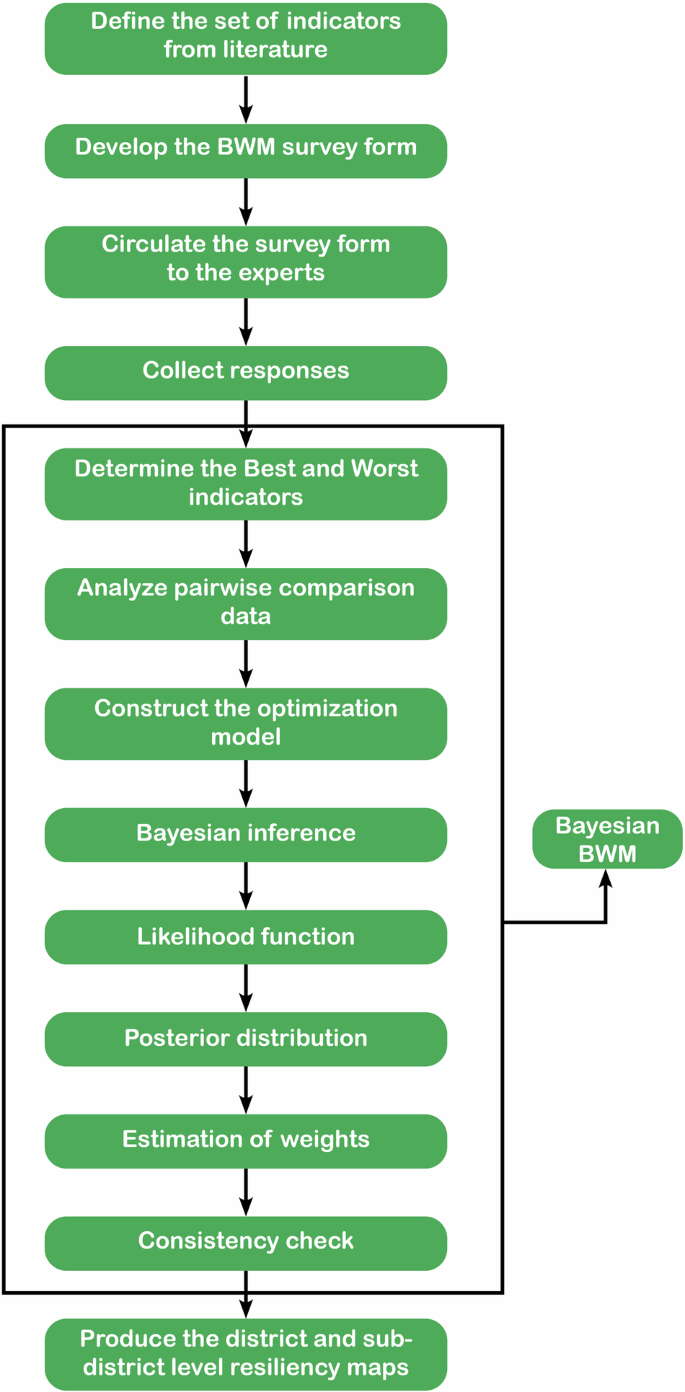
The figure was produced using Microsoft Word.
Step 1: Define the Set of Indicators from Literature
Identify the set of indicators relevant to earthquake resilience. Let C represent the set of n indicators.
Step 2: Collect Responses
Develop the BWM survey form, circulate it to the experts, and collect responses.
Step 3: Determine the Best and Worst Indicators
From the set C, decision-makers select the most important (best) indicator cB and the least important (worst) indicator cW.
Step 4: Collect Pairwise Comparison Data
Obtain pairwise comparison data from the decision-makers regarding the relative importance of the indicators. For each indicator ci, provide the following comparisons:
-
Comparison of cB with ci: aBi
-
Comparison of ci with cW: aiW
These comparisons yield two vectors: ({aB}=[{aB}1,{aB}2,ldots ,{aBn}]), and ({aW}=[a1W,a2W,ldots ,{anW}])
Step 5: Construct the Optimization Model
The aim is to find the weights (w=[w1,w2,ldots ,{wn}]) that best reflect the comparisons. The optimization model in the traditional BWM is formulated as: maximize subject to: ∑i=1, nwi=1, wi≥0, (forall i.)
Step 6: Bayesian Inference
To incorporate uncertainty, we apply Bayesian inference. Assume prior distributions for the weights, often chosen to be uniform or normal distributions. Let P(w) represent the prior distribution of the weights.
Step 7: Likelihood Function
The likelihood function captures the probability of observing the data given the weights. Assuming the pairwise comparison data follows a normal distribution with variance σ2: (P({aB},{aW}| w)propto exp (-12sigma 2sum i=1),n[(wB−aBiwi)2 + (wi−aiWwW)2]).
Step 8: Posterior Distribution
Using Bayes’ theorem, update the prior distribution with the likelihood to obtain the posterior distribution: (P(w| {aB},{aW})propto P({aB},{aW}| w)P(w)).
Step 9: Estimation of Weights
To estimate the weights, we typically use the Maximum A Posteriori (MAP) estimation, which maximizes the posterior distribution: we = argmax(wP(w∣aB,aW)).
Step 10: Consistency Check
Check the consistency of the derived weights. The consistency ratio (CR) can be computed to ensure the reliability of the comparisons. A CR below a certain threshold (e.g., 0.1) indicates acceptable consistency.
Step 11: Produce the Final Map
Using the estimated weights we, compute the aggregate resilience score for each region. Let Rj represent the resilience score for region j: Rj = ∑i = 1,n(wi*xij), where xij is the value of indicator i for region j.
The final resilience map reflects the aggregated scores.
Results
The resilience assessment across both district and subdistrict levels provides a comprehensive analysis of Istanbul’s seismic vulnerability and preparedness. By integrating 28 critical criteria, we calculated the Resilience Score (RS) for Istanbul, which is expressed on a scale from 0 to 1, and has a value of 0.48. This score reflects a moderate resilience level, suggesting that while the city demonstrates notable strengths in several aspects, significant vulnerabilities persist that could impede its ability to recover effectively from a major seismic event77,78.
The criteria, as shown in Table 2, highlight a range of factors influencing resilience. The earthquake risk criterion holds the highest weight (0.064), emphasizing its critical role in determining resilience levels. Other highly weighted criteria include buildings constructed before 1980 density (0.056) and building construction material density (0.056), underscoring the importance of structural integrity and material standards in disaster preparedness as discussed in Sönmez77. On the other hand, criteria like nursing homes density (0.015) and proportion of female to male population (0.016) have lower weights, similar to Seker et al.79, indicating their relatively lesser impact on the overall RS.
At the district level, RS range between 0.34 and 0.58, suggesting significant variation across Istanbul’s districts in their preparedness and resilience to seismic events. The RS for Istanbul as a city (0.48) provides a benchmark, indicating that the city, while moderately resilient, falls short of a higher, more optimal level of preparedness. Achieving a perfect score of 1 would signify that all resilience factors are fully optimized, which is rarely feasible in real-world urban environments due to complex socio-economic and structural challenges. Conversely, a score of 0 would represent a complete lack of preparedness, which is not realistic for any functioning urban area.
The district-level RSs in Fig. 9 reveal that Catalca (0.58) is the highest-performing districts in terms of resilience. Following Catalca, Adalar (0.57), and Arnavutkoy (0.55) are the other two most resilient districts in Istanbul, in the alignment with the findings from Üstün80. These three districts benefit from some factors such as lower population densities and better access to critical infrastructure, making them more resilient in the face of seismic events. For instance, Catalca achieves the highest score, reflecting, such as its relatively low levels of building density, earthquake risk, and population vulnerability, among others. Esenler (0.34) and Gungoren (0.38), are among the least resilient districts as similarly highlighted in Üstün80. These areas exhibit some similarities including higher population densities, older building stock, and greater vulnerability to earthquake damage. The presence of these risk factors suggests that these districts would face considerable challenges in both immediate disaster response and long-term recovery. The negative criteria, such as older buildings and higher vulnerable population densities (e.g., children population density and disability density), are particularly common in these areas, contributing to their lower RSs.
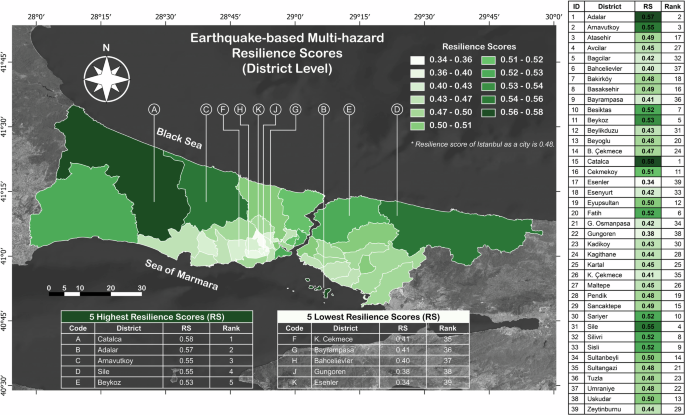
The map was produced using QGIS 3.34.
In the subdistrict-level RS (Fig. 10), we observe that the RSs vary significantly, ranging from 0.22 to 0.59, which highlights the different levels of vulnerability and preparedness across Istanbul’s subdistricts as discussed in previous studies81,82,83. The highest RSs belong to Suleymaniye (Fatih) with 0.59. This subdistrict exhibits higher scores in the positive criteria, which suggests they benefit from factors such as high income and education level, and lower overall vulnerability. Besides, Suleymaniye’s high scores in building construction material density and gathering points density (criteria 7 and 13) indicate robust preparedness for disaster response, complemented by relatively low negative criteria such as population density and building density. Suleymaniye is followed by Balabanaga (Fatih) at 0.58, and Kemankes K. (Beyoglu) also at 0.58. These areas generally showcase effective disaster preparedness, aided by factors including modernized buildings and enhanced social infrastructure.
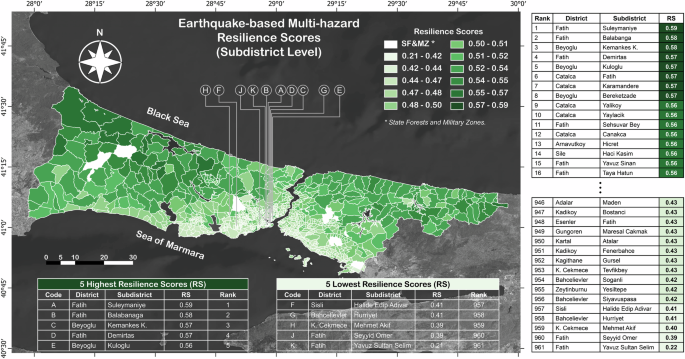
The map was produced using QGIS 3.34.
Figure 11 indicates that the lowest RSs are seen in subdistricts such as Yavuz Sultan Selim (Fatih) with a score of 0.22, followed by Seyyid Omer (Fatih) and Mehmet Akif (K. Cekmece), both at 0.39. Yavuz Sultan Selim shows higher scores in the negative criteria, such as older building stock (criteria 22 and 23), disability density, and high population densities (criteria 16, 18, and 20). It exhibits higher levels of building age, disability density, and population density, which contributes significantly to its low RS. The combination of these factors indicates that these subdistricts might face some severe challenges in the event of an earthquake, particularly due to the factors such as older, structurally weaker buildings and overcrowded conditions that complicate evacuation and emergency response.
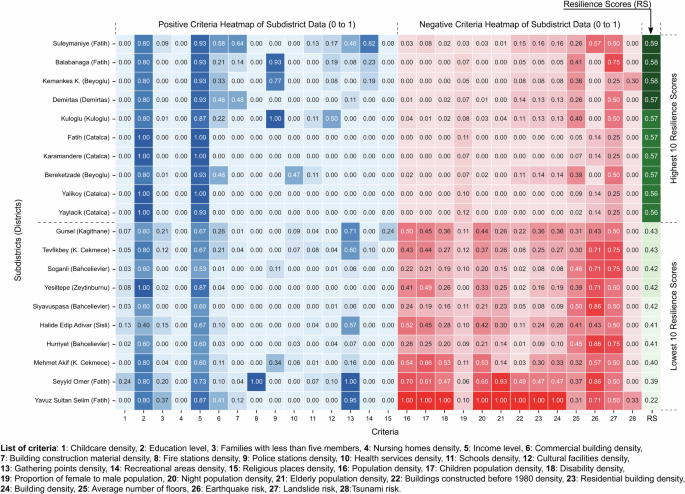
The heatmap was produced using Python 3.9.
Discussion
This study provides a comprehensive earthquake resilience assessment of Istanbul by integrating 28 critical criteria, using the Bayesian BWM to generate RS at both district and subdistrict/neighborhood levels. With Istanbul as a case study, the resilience assessment reveals important insights into the city’s preparedness and vulnerabilities in the face of potential seismic events. The RS for Istanbul, calculated at 0.48, underscores the city’s moderate capacity to withstand and recover from an earthquake relative to the districts analyzed. While this score suggests a balance between strengths such as infrastructure and services, significant weaknesses remain, including older building stock and population density that could hamper recovery. The RS scale, ranging from 0 to 1, indicates that while a perfect score (1) would reflect ideal conditions of complete preparedness, Istanbul’s real-world complexities prevent such an outcome. Similarly, the absence of extreme low scores (0) reflects that no functioning urban area is entirely unprepared.
Through the integration of various indicators, this study highlights critical areas lacking resilience. Districts like Fatih, for example, perform well on positive resilience criteria but face challenges due to factors such as high population density and outdated infrastructure. Conversely, more peripheral districts like Catalca and Arnavutkoy exhibit higher RS due to factors including lower population density and modern infrastructure, yet face challenges related to emergency accessibility.
The RS across Istanbul’s districts and subdistricts provide valuable insights for policymakers and urban planners. The study emphasizes the need for targeted interventions in high-risk areas like Gungoren, G. Osmanpasa, and Esenler, which are marked by high negative criteria scores, indicating their low resilience to seismic events. These districts have some factors in common, such as older building stocks, high population densities, and poor accessibility, and require immediate attention to enhance their disaster resilience.
The broader implications of this work suggest that cities with similar seismic profiles can benefit from employing this framework to identify their vulnerabilities and strengths. By adopting a multi-criteria approach, urban planners can prioritize resource allocation, strengthen infrastructure, and improve emergency services to better prepare for such disasters. In conclusion, this paper contributes to the field by providing a novel application of the Bayesian BWM in earthquake-based multi-hazard resilience assessment at the district and neighborhood levels. It offers a clear and actionable framework for understanding urban resiliencies and enhancing disaster preparedness, which is crucial for the future safety and sustainability of Istanbul and other earthquake-prone cities.
The results of this study provide valuable insights into the resilience of Istanbul’s subdistricts to multiple hazards, including earthquakes, landslides, and tsunamis. Using the Bayesian BWM, we prioritized resilience indicators based on their relative importance, offering a clear framework for understanding disparities across the city’s districts and subdistricts. The findings highlight variations in resilience, with urbanized areas generally exhibiting lower scores. Factors such as higher population densities, infrastructure conditions, and proximity to hazard-prone zones likely play a role in shaping these outcomes. Conversely, suburban and less densely populated regions tended to show relatively higher resilience, emphasizing the need for context-specific interventions to address the diverse challenges faced by different areas. This study is unique in providing actionable insights at the subdistrict level, offering a level of granularity not found in previous resilience assessments. These results can directly inform targeted interventions and resource allocation, enabling policymakers and municipalities to address gaps in resilience with precision and improve overall disaster preparedness.
This study introduces a novel approach to multi-hazard resilience assessment; however, certain limitations should be acknowledged. The Bayesian BWM framework depends on expert input, which may introduce subjective biases despite efforts to ensure diverse representation. The study also relies on static data, which helps establish baseline conditions but does not capture real-time changes in hazard exposure or recovery processes. In this study, we aimed to be as comprehensive as possible by reviewing the literature to identify commonly used indicators, but the selection might not cover all relevant factors. Although the focus on Istanbul provides a detailed case study, the findings may not directly apply to regions with different socio-economic, geographic, or hazard profiles.
This study leverages Bayesian BWM to address some of the limitations of traditional methods like AHP and Delphi-AHP. The Bayesian approach enhances reliability by incorporating probabilistic reasoning, allowing for a more nuanced treatment of uncertainties and expert variability. Unlike simpler methodologies, such as TOPSIS or WSM, Bayesian BWM provides a more systematic framework for evaluating complex multi-criteria problems. However, the computational intensity and the need for advanced technical knowledge may present challenges for practical adoption in some contexts. Despite these considerations, the method’s ability to integrate prior knowledge and reduce biases makes it particularly suitable for assessing resilience in multi-hazard environments.
This study extends previous resilience assessments conducted in Istanbul by adopting a multi-hazard perspective and incorporating detailed analyses at both district and subdistrict levels. Earlier research often focused on single hazards, such as earthquakes and floods, or conducted broader district-level analyses, which may overlook variations within districts79,80,81,82,83. Our findings not only align with prior research in identifying urban centers as areas with significant gaps in resilience but also offer deeper insights into the interplay of various factors, including urban form, socio-economic conditions, and localized hazard exposure. However, this study stands out as the first to evaluate resilience comprehensively using 28 indicators across 961 subdistricts of Istanbul. No prior study for Istanbul has integrated such a diverse range of factors or provided this level of granularity.
The contributions of this comprehensive study lie in its methodology and its potential to guide targeted resilience planning and interventions. Future research could expand this approach to other regions, enabling comparisons that may uncover universal and location-specific resilience patterns. Additionally, integrating dynamic data sources, such as real-time satellite imagery or IoT-enabled monitoring systems, could enhance the accuracy and timeliness of resilience assessments84,85,86. Further exploration of the socio-economic dimensions of resilience and their integration into urban development policies could offer practical pathways for improving disaster preparedness and recovery strategies.


Responses