Effect of fermentation duration on microstructure and quality of acha flour and its cookies acceptability

Introduction
The annual cereal crop “acha” (Digitaria exilis and Digitaria iburua) is native to West Africa and is grown there for its edible grains and straw. Known by many as hungry rice or folio, it is a member of the Gramineae family1. Acha are generally eaten whole, possibly because of their small shape2. When the whole grain is consumed, it has additional nutraceuticals benefits that are helpful for those who are health-conscious and for conditions like diabetes and obesity. According to Karsada3, acha possess nutritional qualities and like other developing ancient grains, it is thought to have a significant amount of minerals (43.30 mg/100 of calcium, 52.12 mg/100 of phosphorus, and 45.09 mg/100 of potassium), and amino acids (9.16 g/16 N leucine and 5.02 g/16 N valine), which makes it potential for use in the development of new products4,5.
Acha’s low protein and fiber content enables it excellent baking properties and the potential to considerably enhance economic status, wellness, and whole grain diets6. One of the most popular kinds of quick snacks is cookies7. According to Olatidoye et al.8, cookies are nutritious snacks made from unappealing dough that is heated in an oven to create a tasty final product. These are well-known bakery products and ready-to-eat snacks with a long shelf life and widespread consumption and can serve as vehicles for important nutrients9.
Fermented foods are of great importance due to their ability to supply and preserve large amounts of nutritious foods with a diverse range of aroma, texture and flavor that enhance the human diet10. In addition to preserving food, fermentation process produces essential enzymes, omega-3 fatty acids, and B-vitamins. Acha grains contain abundant fermentable carbohydrates (resistant starch and soluble fiber) that, when reaching the gut, exhibit greater probiotic efficacy compared to wheat, increasing the number of lactobacilli and bifidobacteria in the feces of humans11.
The potential of utilizing fermentation processes to transform acha flour into various products, including confectionery, ready-to-eat (RTE) food, weaning food, and breakfast cereals, remains largely untapped12. Despite acha flour’s availability in the market, its incorporation into processed food products is currently underutilized. Acha stands out as one of the most nutritionally rich grains, containing essential amino acids like methionine and cystine13. These amino acids play a crucial role in supplying sulfur and other compounds necessary for normal metabolism and growth within the body. The nutritional advantages of incorporating fermented acha into food products, particularly in the production of cookies, have not been thoroughly explored. This oversight brings about a vital examination into the potential benefits and effects of utilizing fermented acha flour into cookies production in alleviating the prevailing food insecurity.
Results
Functional and pasting properties
The functional and pasting properties of the native and fermented acha flour and cookies samples were presented in Table 1. There was a significant difference (P < 0.05) in the functional properties; dispersibility (67.75–74.50 and 73.00–79.00%), loose bulk density (0.49–0.57 and 0.494–0.527 g/ml), tapped bulk density (0.75–0.84 g/ml), swelling capacity (3.17–4.21 and 3.31–3.88 g/g), solubility index (0.02–0.05 and 0.09–0.12 g/g), and water absorption capacity (1.08–1.29 and 0.76–0.89 g/g), and pasting properties; breakdown (13.00–1549.50 and 11.50–1367.00 RVU), final viscosity (1849.50–6373.50 and 1414.00–6489.00 RVU), peak viscosity (1033.50–4610.00 and 874.50–4638.00 RVU), pasting temperature (78.23–91.30 and 78.25–95.13 °C), peak time (5.47–7.00 and 5.83–7.00 RVU), setback (811.00–3293.50 and 535.00–3218.00 RVU), and trough viscosity (1020.50–3529.50 and 856.50–3271.00 RVU) of the flour and cookie samples, respectively.
Proximate and mineral composition
The results of the proximate composition and mineral composition were presented in Table 2: There was a significant difference (P < 0.05) in the moisture (7.60–8.10%), fat (1.73–1.87%), fibre (0.40–0.80%), protein (8.83–9.33%) and carbohydrate (77. 67–78.24%) content of the flour samples, and fibre and protein content of the cookie samples, while the calcium (113.33–125.00 mg/100 g), copper (0.27–0.40 mg/100 g), magnesium (38.33–43.33 mg/100 g), sodium (141.67–150.00 mg/100 g), phosphorus (143.33–150.00 mg/100 g), and zinc (0.40–0.57 mg/100 g) of the flour samples showed significant difference (P < 0.05).
Phenolic and flavonoid compounds
The phenolic and flavonoid compounds of the flour and cookie samples were presented in Table 3. There was a significant difference (P < 0.05) in the phenolic compound of the flour (0.753–1.267%) and cookie (0.203 to 0.803%) samples, and flavonoid content of the cookie sample (0.952 to 1.181%).
Sensory profile
The sensory profile of the cookies prepared from native and fermented acha flour were presented in Fig. 1. There were significant differences (P < 0.05) among all the sensory parameters (color, taste, aroma, crispiness, appearance, and overall acceptability) evaluated. The native acha flour sample (CAN) had the highest values for all the parameters evaluated, followed by CFA24, CFA48, and CFA72.

CNA, cookies prepared from native acha flour; CFA24, cookies prepared from fermented acha flour for 24 h; CFA48, cookies prepared from fermented acha flour for 48 h; CFA72, cookies prepared from fermented acha flour for 72 h.
Discussion
The functional and pasting properties of the flour and cookie samples are presented in Table 1. The loose and tapped bulk density of Acha flour and cookie samples was observed to decrease significantly (P < 0.05) with increased fermentation duration. The values ranged from 0.490 to 0.568 g/ml and 0.777 to 0.842 g/ml, respectively, for the flour sample, and 0.494 to 0.527 g/ml and 0.710 to 0.867 g/ml for the cookie samples. The highest value was observed in native acha flour and cookie samples while least value was observed in sample fermented for 72 h. The decrease observed in the loose and tapped bulk density might possibly result from increased particle breakdown of the fibrous materials during fermentation14. According to15, pectinolytic and cellulolytic enzymes are elaborated by fermenting microorganisms and aid in the breakdown of cell membranes. The formation of carbon dioxide gas during fermentation, which causes the bubbles to grow and increase in volume may also be the reason for the decrease in bulk density of flour samples with longer fermentation durations16. The cookie sample’s low loose bulk density suggests that less food would be packaged in a constant volume, which ensures cheap packaging. The ability of flour to absorb water and swell, improving food consistency, is known as its water absorption capacity. In food systems, WAC is desired to increase yield, consistency, and food body17. There was significant (P < 0.05) decrease in the water absorption capacity of the flour (1.29–1.08 g/g) and cookie samples (0.89–0.76 g/g) with increase in fermentation duration. Highest value was observed in native acha flour while least value was observed in sample fermented for 72 h. The alteration of macromolecules during fermentation may be the cause of the samples’ decreased water absorption capacity18. The result is consistent with the pattern observed by Ogodo et al.19 in their research on lactic acid bacteria-fermented soybean flour and20 on fermentation on sorghum flour properties21 also found that longer fermentation durations greatly reduced the microbial activity of food products that have low water absorption capacities. As a result, the product’s shelf life would be increased. The oil absorption capacity ranged between 0.72 and 0.64 g/g for the flour sample, and 0.65–0.77 g/g for the cookie sample. With increased fermentation duration, there was no significant (P > 0.05) increase in the samples’ oil absorption capacity. Acha flour fermented for 72 h had the highest oil absorption capacity value while native acha flour had the least value. Intrinsic variables like protein structure, hydrophobicity or surface polarity may be responsible for the increase in oil absorption capacity with increased fermentation durations22. The study of23 and24 on pea flour and moringa seed flour respectively showed similar findings. Flour samples with good oil absorption capacity are suitable for food preparations that require oil mixing, such as bakery products, where oil is an essential ingredient13.
The dispersibility of the flour and cookie samples varies significantly (P < 0.05) as the values increased with increase in fermentation duration. Acha flour fermented for 72 h had the highest dispersibility value while native acha flour had the least value. Higher dispersibility value enables the flour to reconstitute more readily in water25. This indicates that the flour samples’ capacity to reconstitute effectively in water has been improved by fermentation. This suggests that the cookies samples could digest easily25. The swelling capacity and solubility index of the flour and cookie samples decreased with an increase in fermentation period. This might be related to the granule’s degree of association and binding force (Hoover, 2002).
There was a significant (P < 0.05) decrease in the peak viscosity of the flour samples with an increase in the duration of fermentation. The acha flour sample that was fermented for 72 h had the lowest value (1033.50 RVU), while the native acha flour had the highest value (4610.00 RVU). Similar phenomena have been reported for rice flour by Yong et al.26,27,28 and soybean flour by Olanipekun et al.29. The ability of the starch granules in the flour sample to bind water is indicated by the decrease in peak viscosity of the flour samples with an increase in fermentation duration. As shown in Table 1, the peak viscosity of the cookie sample increased significantly (P < 0.05) with increase in fermentation duration. High peak viscosity also indicates the fragility of the swelled granules, which swell initially before disintegrating due to the Rapid Visco Analyzer constant mixing25,30. The trough viscosity values of the flour sample decreased gradually with an increase in fermentation duration. The decrease in trough viscosity with increase in fermentation duration may be due to the swelling capacity of the starch granules in flour samples31. The flour samples generally had high trough values, indicating higher cooked paste stability and a higher ability to withstand shear at elevated temperatures32. The trough viscosity values of the cookie samples increase significantly (p < 0.05) with increase in fermentation duration. This could be attributed to the alteration of starch granule structure during fermentation. This process enhances the starch’s ability to swell and retain water, leading to higher viscosity during heating and cooling. The breakdown viscosity values of the flour samples decreased with an increase in the fermentation duration. The highest breakdown value was obtained in native acha flour while the least was obtained in sample fermented for 72 h. A study by Chinma et al.33 also revealed that low breakdown values suggest that the starch in question has cross-linking characteristics whereas high breakdown values show that the swollen starch granules are relatively weak against hot shearing. The lower breakdown viscosity values of flour samples obtained in this study indicate high fermentation duration impact into the flour sample ability to possess cross-linking properties and high stability against hot shearing. The breakdown values of the cookie sample increased significantly (p < 0.05) as fermentation duration increased. Better palatability is indicated by a higher breakdown viscosity34. The final viscosity values of the flour were observed to decrease significantly (P < 0.05) with increased fermentation duration. The simple kinetic effect of cooling on viscosity and the re-association of starch molecules in the samples may be the cause of the change in the final viscosity with longer fermentation durations35. The relatively high value of final viscosity of the acha flour samples suggests the ability of the flour samples to form more viscous pastes. The final viscosity values of the cookie samples increased significantly (P < 0.05) with increase in fermentation duration. The final viscosity changes as fermentation time increases and this was due to high amylose content of the cookie samples and hydrogen bonding during cooling36 (cited by Iwe et al.37). The retrogradation of the flour-based product during cooling decreases with increasing setback value38. As the duration of fermentation increased, the setback viscosity values of the flour samples decreased significantly (P < 0.05) reduced. The setback viscosity value was highest in native acha flour while the least value was observed in sample fermented for 72 h. This indicates that increase in fermentation duration has improved the retrogradation tendency of the flour samples. When cooling paste made from starch or a starch-based product, low setback suggests increased resistance to retrogradation39, while high setback is linked to syneresis or weeping during freeze/thaw cycles40. The setback values of the cookie samples increased with increased fermentation duration. It has been reported that setback viscosity has a major impact on how easily a food product can be digested when consumed. Higher setback values are correlated with lower digestibility41. The result indicates that increased fermentation duration decreases the digestibility of the cookies samples. The peak time of the flour samples increased significantly (P < 0.05) with increase in fermentation duration. This shows that increased fermentation duration also increases the cooking time of the acha flour samples. The peak time values are comparable to those of25 for instant yam-breadfruit composite flour and42 for germinating tiger-nut flour. The peak time increased with an increase in fermentation duration. One of the properties that show the minimum temperature needed to cook a sample, the energy costs involved, and the stability of other components is the pasting temperature37. The pasting temperature of the flour was observed to increase with increased level of fermentation duration. A greater pasting temperature is indicative of a larger ability to bind water, a higher inclination to gelatinize, and a lesser swelling property in starch-based flour because of the strong associative forces that exist between the starch granules25. The same observation was reported by Danbaba et al.43 for the pasting properties of ‘ofada rice’ varieties. Generally, the values obtained for the pasting properties of flour samples are within those recommended for commercial flour44. The pasting temperature of the cookie samples differs significantly (P < 0.05) as the values increased with increase fermentation duration. This implies that fermentation duration has increased the cooking temperature for cookies samples since pasting temperature is an indication of minimum temperature required to cook a sample (360).
Table 2 shows the nutritional quality (proximate and mineral) of native and fermented acha flour and cookie samples. Significant differences (p < 0.05) were observed in fat, fibre and protein content of the samples. The moisture content of the acha flour and cookies sample was observed to decrease with increase in fermentation duration. The samples’ decreased moisture content with longer fermentation times might likely be attributed to bacteria using some moisture for metabolic processes45. According to the work of Hwabejire et al.46, the moisture content of spontaneously fermented acha flour was observed to increase within 48 h of fermentation time and decreased by 72 h. The decrease in moisture content could be due to the breakdown of complex carbohydrates into simpler sugars, which are then used by microorganisms during fermentation. The moisture content of the cookie’s samples was observed to decrease generally after baking when compared to the acha flour samples. Food stability and value are indicated by the amount of moisture in the food47. The moisture content values of the cookie samples found in this study fall within the World Food Programme’s (WFP) maximum moisture content for flour baked products for effective storage, which is set at 10%. The protein content of the acha flour samples increased with increase in fermentation duration. It is possible that the increased microbial mass during fermentation led to the extensive breakdown of protein molecules into amino acids and other simple peptides, leading to why the protein content of the flour samples was reported to increase48. The result of protein content observed corresponds to the observation of49 on increase in protein content during fermentation of sorghum, and the work of Igbabul et al.45 on mahogany bean flour. The protein content of the cookies was observed to decrease when compared to acha flour samples after baking and the values varies significantly (P < 0.05). The decrease in protein content observed in cookies samples could be because of denaturation of protein due to baking temperature50. The fat content of the acha flour samples was observed to decrease with increased fermentation duration. The breakdown of lipids during fermentation may have led to the low fat level found in acha flour samples51. The reduced fat content contributes to an extended shelf life for acha flour by minimizing the likelihood of developing rancid flavors. The fat content of the cookie samples increased after baking when compared to the flour samples. The high fat content observed in cookies samples than the flour samples could be because of baking fat added as an ingredient during dough preparation and agreed with other authors52. The ash content of the acha flour and cookie samples was observed to increase initially at fermented period of 24 h, after which the ash content decreased with increase in the fermentation duration. The highest value was observed in sample fermented for 24 h, while the least value was observed in samples fermented for 72 h shows to have no significant effect on the ash content of the acha flour samples, though numerical differences was observed. The reduction in ash content following a 24 h fermentation period may be attributed to the leaching of soluble mineral elements into the medium or to the general activities of the fermenting microorganisms, whose enzymatic activity broke down the food components into forms that could be absorbed45. The crude fibre content of the acha flour samples and cookie sample values decreased with increase in fermentation duration. Highest value was observed in native acha flour/cookie while the least value was observed in samples fermented for 72 h. Due to the actions of microorganisms known for the bioconversion of carbohydrates and lignocelluloses, the fibrous tissues of the acha seeds may have softened during fermentation, which could account for the decrease in crude fiber content of the acha flour samples with longer fermentation periods45. This result correlates with that of53 who observed a decrease in the crude fibre content of cereal-based complementary foods, as fermentation duration increased. The fibre content of the cookies varies significantly (P < 0.05) and was not appreciably affected by baking. All the cookies’ fiber content, however, fell below the FAO/WHO54 suggested range of no more than 5 g of dietary fiber per 100 g of dry matter, which is in line with55. The flour samples’ comparatively high carbohydrate content indicates that they may be an energy source. The result observed in this study correlated with those observed by Igbabul et al.45 for fermented cocoyam flour.
The mineral composition revealed that calcium, sodium and zinc content of the acha flour and cookie samples varies significantly (P < 0.05). The calcium, sodium and zinc content of the samples increased initially, but fermentation duration above 24 h caused a decrease in the mineral content of the samples with increase in fermentation duration. Highest value for calcium, sodium and zinc was observed in sample fermented for 24 h while the least value was observed in sample fermented for 72 h. The decrease in the mineral content of the acha flour samples with increased fermentation duration might be attributed to leaching of the mineral elements in the fermenting water during prolong fermentation56. However, there was no significant (P < 0.05) difference among the samples in terms of magnesium, copper and phosphorus. This shows that fermentation duration has no significant effects on the magnesium, copper and phosphorus content of the flour samples, although numerical differences were observed. The magnesium, copper and phosphorus content increased initially, with fermentation duration above 24 h, the mineral parameters decreased with increased fermentation duration56. also reported that possible microbial utilization and conversion could be responsible for the reduction in the levels of minerals during prolonged fermentation. The mineral content of the cookie samples was lower when compared to the flour samples. The baking process was observed to slight decrease the mineral content of the cookie samples except for the sodium and copper content which was observed to increase after the baking process. This implies that both Na and Cu are very heat-resistant minerals, and that baking may have made them slightly more extractable. This observation can be attributed to the Maillard reaction that occurred during baking57. stated that the Maillard reaction can result in disintegration or creation of compounds that may have an impact on the availability and solubility of minerals. Despite the trend observed in the mineral content, the cookies samples still contain appreciable quantities of mineral elements that can supply the recommended daily allowance of the mineral elements as stated above. The same results for extruded acha-soybean blends and fermented popcorn-African locust bean blends were obtained by Anuonye et al.58,59.
The phenolic and flavonoid compounds of the fermented flour and cookies samples were shown in Table 3. The values of phenolic compounds of the flour (0.753–1.267%) and cookie (0.203–0.803%) sample increased significantly (p < 0.05) with increased fermentation duration. This increase in phenolic content with increased fermentation duration could be attributed to the enzymatic reactions that enhance phenolic content during fermentation. Specifically, the enzyme β-glucosidase plays a role by hydrolyzing glycosidic bonds, which results in the release of phenolic glycosides60. According to research, consuming phenolic compounds may have a significant impact on health, since it regulates metabolism, chronic disease, weight and cell proliferation61. There was a significant decrease (p < 0.05) in the flavonoid content of the cookie sample (1.181–0.952%) with increase in fermentation duration. Contrary to the result observed in this study62, observed increased flavonoid content after fermentation of soybean meal.
The Fourier transmission infrared (FTIR) spectra of fermented acha flour and cookies are shown in Table 4. Fourier Transmission-Infrared (FTIR) spectroscopy is a technique for studying constituent functional groups in an analyte63. The infrared (IR) spectra of the native and fermented acha flours and cookies samples showed similar peaks with variations in intensity. The FTIR spectra of the flour and baked cookie samples reveal the changes brought about by the fermentation process. The peaks were between 3860 and 3650 cm−1 (Fig. 2). The high peak range observed could be because of O–H bond stretching64. The O–H absorption peak of native acha flour changed from 3650 cm−1 to 3670, 3830 and 3800 cm−1 for 24 h, 48 h and 72 h fermentation period, respectively. These changes could be attributed to better lipophilic and hydrophilic properties of fermented flour samples65. A similar pattern was also noted in the cookie samples, where the O-H peak varied for the 24, 48 and 72 h fermentation periods, respectively, from 3610 cm−1 to 3800, and 3830 to 3860 cm−1. The degree of inter and intra-molecular bond formation is shown by the fluctuation in the O-H peak64. However, the increase in the width of the fermented samples spectrum in both flour and cookies could be because of characteristic presence of alcohol, produced during fermentation63. Tightly bound water in the form of moisture was the cause of the asymmetric stretching of the C–H band in the region of 3030–2980 cm−1 and the vibration peak at 1490–1470 cm−1 observed in the spectrum66. The carbonyl stretches peaks in the native and fermented acha flour samples ranged between 1760 and 1770 cm−1. However, the carbonyl peak values observed in the cookie samples were at higher intensities in the absorption range of 1780–1770 cm−1. It was observed in Fig. 2 that fermentation process reduces the carbonyl peaks which might be due to a decrease in the total lipids present in the samples because of fermentation67,68. The additional fat added during dough preparation may have contributed to the greater carbonyl peaks seen in the cookie samples. However, baking depolymerized the fat, resulting in a strong carbonyl peak in every cookie sample. C-O bond stretching and aliphatic C-N stretching are responsible for the peaks at 1180–1181 cm−1, whereas the amide I band formed in the 1550–1570 cm−1 range. The intensity of the bands increased from 1550 cm−1 in the native acha flour samples to 1560 and 1560 to 1570 cm−1 in the fermented flour samples after 24, 48 and 72 h, respectively. This indicates alterations in the sample’s crystallinity. There may have been a buildup of proteins in the processed samples as indicated by the fermented samples’ comparatively greater amide I peak intensities67. Increases in the amide peak intensities were also visible in the cookie samples’ spectra. This might be due to the embedded proteins β-sheet structures69,70. This study is comparable to those published by Animashaun et al.65,68 on the IR spectra for maize and sorghum respectively. Figure 3 shows the X-ray diffraction (XRD) pattern for native and fermented acha flour and its resultant cookie. The variations in the crystallinity of the flours and cookies affected by processing are examined using X-Ray Diffraction (XRD) patterns. Peak intensity relates to the number of semi-crystalline structures that are arranged and/or the variation in electron density between lamellae that are crystalline and those that are amorphous.71,72, while the sharp peaks correlated to crystalline region, the diffused peaks amounted to the amorphous region of the flour and cookies samples63,71,72. The diffraction patterns for the native and fermented acha flour samples shows that all the flour samples exhibited an A-type XRD pattern64. Native acha had a diffraction pattern with major reflections at 2θ of 16.2°, 17.9°, 19.0°, and a diffused peak at 22.8°. Flour samples fermented for 24, 48 and 72 h had similar peaks with stronger diffraction intensities with peaks occurring at 2θ of 15.3°, 17.4°, 20.2° and 22.9°, 15.5°, 17.5°, 19.4° and 23.2°, and 15.3°, 18.0°, 19.4° and 23.1° respectively. The fermented flour blends’ XRD patterns showed variation, which might be attributed to hydrolysis that occurred during the fermentation process27,28. Other cereal flours exhibit the observed A-type structure63,73. The X-ray diffraction plots show that the crystallinity in cookies samples has little variation when compared to the flour samples. The diffused V-type peaks seen in all samples are commonly found in cereals that have been processed74. This explains why all of the cookie samples showed increased thermal degradation and the disintegration of the crystalline region of the flour samples to an amorphous zone. The disruption of crystalline region is due to heat processing resulting to a partial or complete reorganization in the crystalline alignment64. Similar results were reported by Adebiyi et al.63, and Dharmaraj et al.74 for malted and fermented pearl millet biscuit and during heat treatments resulted in a decrease in crystallinity of acha flour and cookies, respectively.
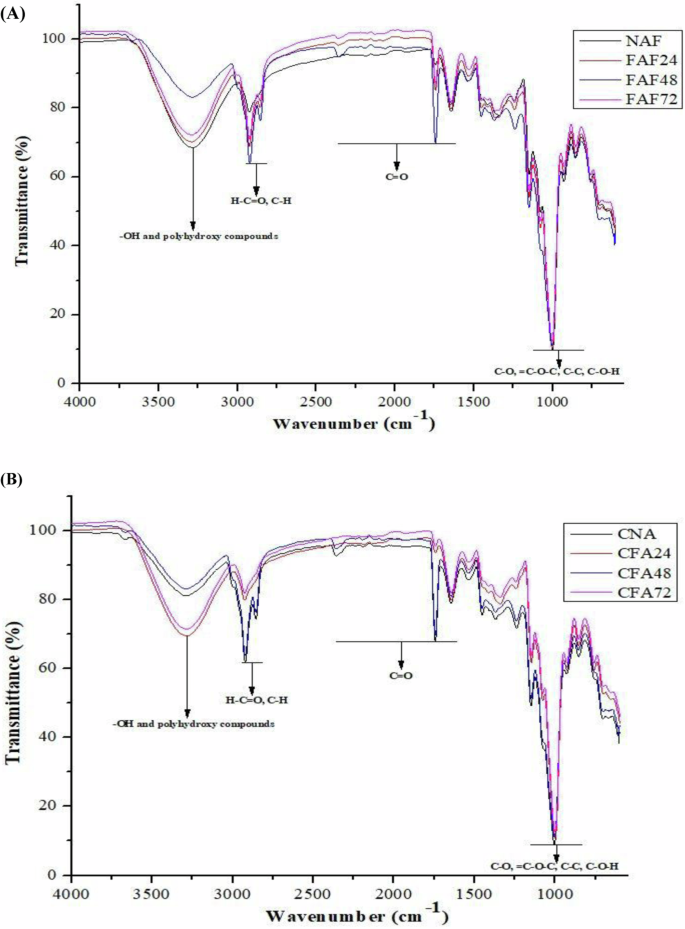
A NAF, native acha flour; FAF24, fermented acha flour for 24 h; FAF48, fermented acha flour for 48 h; FAF72, fermented acha flour for 72 h; (B) CNA, cookies prepared from native acha flour; CFA24, cookies prepared from fermented acha flour for 24 h; CFA48, cookies prepared from fermented acha flour for 48 h; CFA72, cookies prepared from fermented acha flour for 72 h.
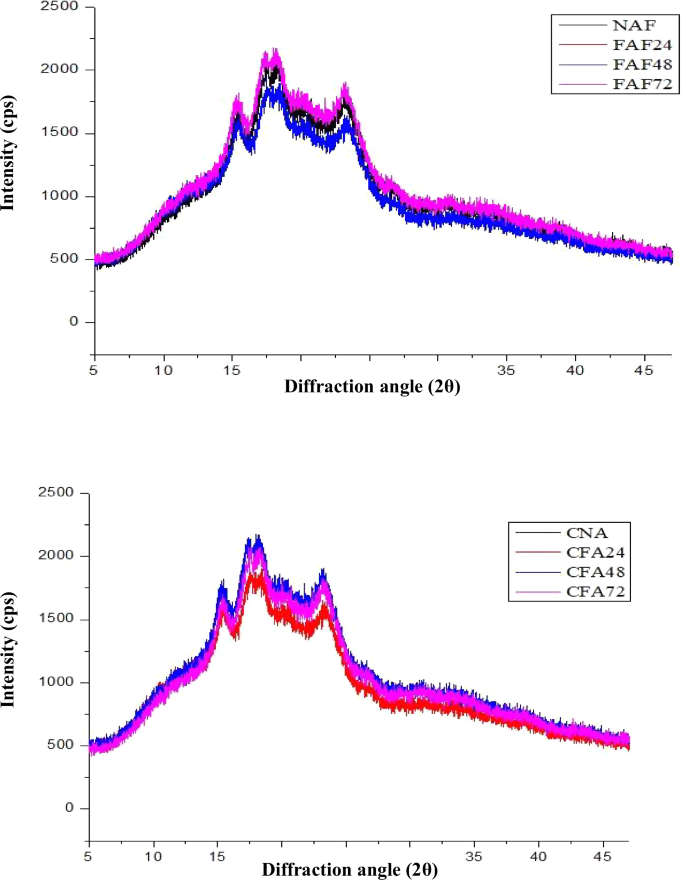
NAF, native acha flour; FAF24, fermented acha flour for 24 h; FAF48, fermented acha flour for 48 h; FAF72, fermented acha flour for 72 h; CNA, cookies prepared from native acha flour; CFA24, cookies prepared from fermented acha flour for 24 h; CFA48, cookies prepared from fermented acha flour for 48 h; CFA72, cookies prepared from fermented acha flour for 72 h.
The scanning electron microscope (SEM) image for native and fermented acha flour and corresponding cookies samples is presented in Fig. 4. The internal structure of food samples is commonly evaluated and characterized using scanning electron microscopy (SEM). SEM has been utilized by numerous authors to characterize the morphology of starch granules, explain the endosperm’s structural arrangement, and examine how distinct treatments affect the granules75,76,77,78,79. The scanning electron microscope (SEM) images of native and fermented acha flour samples were compared to observe the morphological changes in them. It was observed according to flour micrographs that the granules of native acha flour have a non-uniform, smaller, lenticular or disk-like shape, which is spherical or ellipsoidal in shape. Regular and smoother structural networks were observed with shape and structure almost the same to native acha flour in the fermented samples. The granules had smaller pores and seemed to be round or polygonal in shape. This suggests that fermentation process had an effect in forming a regular shape in their corresponding samples. The effect of osmotic stress during the fermentation process is responsible for the fermented samples’ increased porosity, disorientation, and less condensation as seen in the SEM images80. The spherical or ellipsoidal shape of the granules is like the shape of granules in wheat and corn starches reported by Horstmann et al.81. The scanning electron microscopy images of the cookie samples give a more varied arrangement of the granules when compared to the flour samples. The baking process has been shown to disrupt the granular structure as all the cookies samples had larger granular sizes with a “honeycomb like” structure. Similar observations were reported by Dharmaraj et al.74,63 for high temperature processed finger millet and pear millet respectively. The high structural deformation of the samples may be because heat applied during baking causes a higher diffusion rate. High-temperature levels, while baking led to intensified water evaporation and melting of starch granules82. In general, the baking procedure stabilized the colloidal batter system, enabled the formation of an enveloping crust, and altered the structural nature of the cookie samples. This situation may undermine the starch-protein matrix and hence give rise to structural damage and finally rupture the compact structure of the samples. The micrograph of native and fermented acha cookies was in close conformation with the findings of83 for high temperature processed products structure.
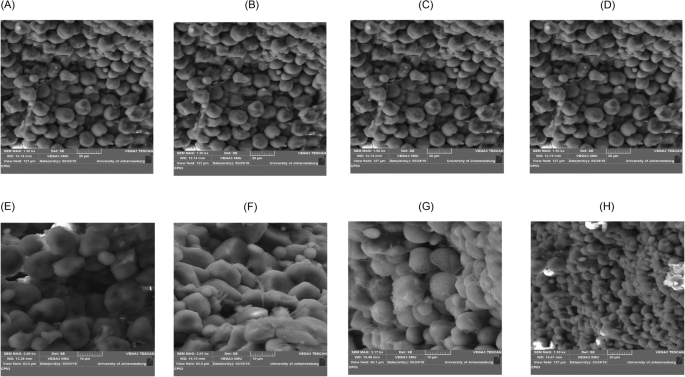
(A) NAF, native acha flour; (B) FAF24, fermented acha flour for 24 h; (C) FAF48, fermented acha flour for 48 h; (D) FAF72, fermented acha flour for 72 h; (E) CNA, cookies prepared from native acha flour; (F) CFA24, cookies prepared from fermented acha flour for 24 h; (G) CFA48, cookies prepared from fermented acha flour for 48 h; (H) CFA72, cookies prepared from fermented acha flour for 72.
The sensory attributes of cookies produced from native and fermented acha flour is presented in Fig. 1. There were significant (P < 0.05) differences among all the samples produced from native and fermented acha flour. In terms of appearance and crispness, the mean score shows decrease with an increase in the fermentation duration. The highest mean score was observed in cookie produced from native acha flour, while the least mean score was observed in sample produced from acha flour fermented for 72 h. Perhaps, decrease in the mean score for appearance and crispness with increased fermentation duration could be attributed to dark coloration developed because of mallard reaction during baking84 and increase in mechanical force required require breaking the samples due to increase in hardness of the samples facilitated by decreased moisture content of the flour samples, respectively85,86. Also, it was observed that there is decrease in taste and aroma with increased fermentation duration. The panelist rated the cookie produced from acha flour fermented for 24 h and sample produced from native acha flour the most preferred in terms of taste and aroma, respectively. There was significant difference (P < 0.05) among samples in terms of color. The panelists’ preference for the color of the cookies decreased with increase in fermentation duration. The decrease was because of increased fermentation duration which might be attributed to more rapid mallard reaction between protein and carbohydrate which produced cookies with darker color which may not be appealing to the consumer. Cookies sample produced from native acha flour was more preferred in terms of color. The textural properties of the samples decreased with increased fermentation duration. This was in line with the report of86. The panelists’ overall acceptability for the cookies samples decreased with increase in fermentation duration. Generally, cookies produced from native acha flour were rated most acceptable while fermented acha flour for 72 h was rated the least (Fig. 5). The result obtained for sensory attributes in this study was similar to the work of Okpala et al.55 for cookies samples made from blends of germinated pigeon pea, fermented sorghum, and cocoyam flour.
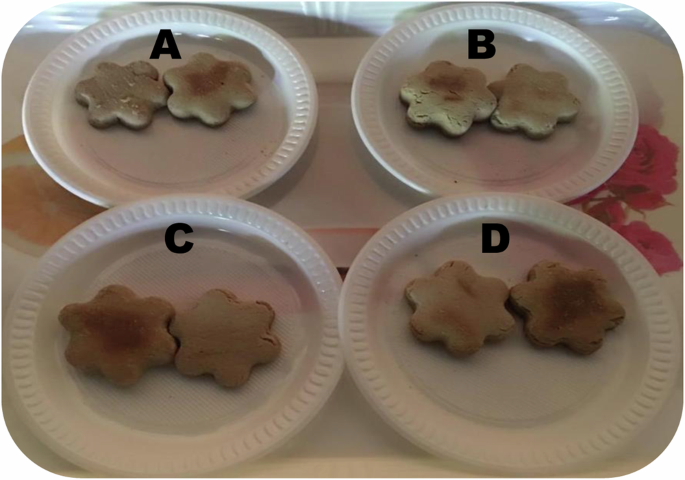
A Cookies prepared from native acha flour. B Cookies prepared from fermented acha flour for 24 h. C Cookies prepared from fermented acha flour for 48 h. D Cookies prepared from fermented acha flour for 72 h.
Materials and methods
Materials and equipment
The Acha grains were bought in Lagos State, Nigeria, at Mile 12 Market (7.5 °N and 4.5 °E). Additional ingredients, including eggs, milk, margarine, sugar, and baking powder, were procured from local Market in Abeokuta, Ogun State, Nigeria.
Sample preparation
Preparation of native acha flour
Acha flour was prepared following87 method. Dust and chaff were taken out by winnowing the grains. Residual dust and stones were washed away through sedimentation using large bowls. The cleaned and de-stoned grains were subjected to drying in a cabinet dryer at 45 °C. After drying, the grains underwent milling using an attrition milling machine, and the resulting flour was sieved to achieve a particle size passing through a 50 µm mesh. An airtight container was used to package the acha flour.
Preparation of fermented acha flour
Fermented acha flour was prepared as described by Onweluzo et al.88. Acha grains were soaked in distilled water and left to ferment for 3 days. Following fermentation, the soaked water was drained, and the seeds were dried in a cabinet dryer for 24 h at 40 °C. Subsequently, the dried grains underwent milling using an attrition milling machine, and the resulting flour was sifted to achieve a particle size passing through a 50 µm mesh.
Preparation of acha cookies
About 100% acha-based cookies were prepared and baked as described by Onweluzo et al.88,89. The formulation comprised of 200 g of acha flour (native flour and fermented flour) 2 g of salt, 2 g of baking powder, 62 g of egg, 80 g of margarine, 50 g of sugar, 15.6 g of milk and 10 ml of vanilla flavor. Margarine and sugar were blended in uniformity with an electric mixer operating at a medium speed for 5 min. Eggs and milk were incorporated into the mixture and mixed for duration of 30 min. Additional ingredients, including flour, salt, vanilla flavor, and baking powder, were thoroughly blended to make the dough. The dough was kneaded to achieve a consistent thickness of 0.5 cm, and then circular cuts with a diameter of 5 cm were made. The dough was placed in the oven and baked at 150 °C for 30 min, followed by a cooling.
Functional properties
The water and oil absorption capacities were determined using the method described b90. The method explained by Adeleke et al.91 was used to determine bulk density. Swelling capacity was determined using the method described by Sobowale et al.5. Dispersibility and solubility index was determined using the method described by Lee et al.92.
Pasting properties
The Rapid Visco Analyzer (RVA) (Techmaster parten N103802 Australia) was used to determine the pasting properties, as reported by Li et al. 93. After weighing about 3.5 g of the samples into an empty, dry canister, 25 ml of distilled water was poured into it. The solution was well mixed, and the canister was properly placed into the RVA as specified. The slurry was heated to a temperature of 50 and 90 °C for 2 min. At a heating rate of 11.25 °C/min, the pasting profile, including final viscosity, peak viscosity, setback, breakdown, pasting temperature, and peak time, was obtained using thermocline for windows software connected to a computer.
Proximate composition
The proximate composition of acha flour and cookies was determined where protein was measured using the Kjeldahl method (N X 6.25), and moisture, ash, and fat were determined using methods 934.01, 996.06, and 923.03 of AOAC (2000)94.
Mineral content
The mineral composition of acha flour and cookies was determined according to AOAC, (2000)94 method. 10 ml of 5 N concentrated hydrochloride were used to digest 5 g of the samples. The mixtures were set on a water bath and evaporated nearly to dryness. The solution was allowed to cool, then sieved into a standard flask of 100 ml capacity and diluted with distilled water to its full volume. Following the acid digestion of the sample, the minerals were analyzed separately with an atomic absorption spectrophotometer.
Total phenolic content (TPC)
Using Ainsworth and Gillepsie’s (2007)95 Folin-Ciocalteu procedure, the TPC of the flours and cookie extracts was evaluated. A solution of 10 µL extract and 50 µL Folin-Ciocalteu phenol reagent (Sigma Aldrich, Germany) was added to 500 µL of distilled water. After letting it stand in the dark for three minutes, 200 µL of 20% (g/v) Na2CO3 (Sigma Aldrich, Germany) was added, followed by the addition of 245 µL of distilled water. The mixture (300 µL) was precisely pipetted into a 96-well microplate, covered with aluminum foil, and then incubated in darkness for 30 min. The plate’s absorbance was then measured using a micro plate reader (iMark, Biorad, South Africa) at 750 nm. The standard utilized was garlic acid (Sigma Aldrich, Germany), and the results were reported as mg GAE/g sample.
Total flavonoid content (TFC)
The TFC was determined using the method proposed by Ar-Farsi and Lee (2008)96, involving the mixing of 30 µL of the extract with 20 µL of 36 mM NaNO2. About 20 µL of 94 mM AlCl3 was then added. A micro plate reader (iMark, Biorad, South Africa) was used to measure the mixture’s absorbance at 450 nm. Using catechin (Sigma Aldrich, Germany) as a reference, the results were reported as mg of catechin equivalents per g of the sample (mg CE/g sample).
Microstructural properties of acha flour and cookies
Fourier transmission-infrared (FTIR) spectroscopy
Fourier transmission-infrared spectroscopy analysis was carried out using the method of63,65. An FTIR spectrophotometer (Thermo Scientific Smart iTR, (Attenuated Total Reflectance), Thermo Scientific Inc., USA) was used to determine the samples’ FTIR spectra. Before sample (0.5 g of acha flour and cookies) were mounted on the instrument, the background spectra of the instrument were collected and at 16 runs per scan, the records of the spectra were taken with characteristics peaks in wave numbers ranging from 400 to 4000 cm−1 at.
X-ray diffraction (XRD)
The method of63 was used to conduct the X-ray diffraction analysis. 5 g of samples were put into the XRD sample holder and compressed with a stainless-steel weight. The crystalline property and X-ray diffraction of the samples were examined using an X-ray diffractometer (Rigaku-ultima IV, Japan) fitted with a divergence slit. The diffractometer was operated at 40 kV 40 mA with a scan speed of 10/min. The areas of the crystalline and amorphous regions in the X-ray diffractogram were utilized to determine the relative crystallinity (RC) using Origin Lab (Origin Pro).
Scanning electron microscopy (SEM)
The method of63 was used to analyze the scanning electron microscopy with a magnification level of 1500 times (1.5Kx). The acha flour and cookies were placed on aluminum stubs and sprayed with a carbon thin film using a carbon coated Quorum Q150TE, Quorum Technologies, UK, to avoid the charge effect. After coating, the samples were transported to an electron beam specimen chamber in a scanning electron microscope (Vega 3 XMU, TESCAN Czech Republic) and exposed to an electron beam while under vacuum.
Sensory analysis
The sensory evaluation was determined using 50 panelists consisting of students from food technology department, Moshood Abiola Polytechnic, Abeokuta, Nigeria. A 9-point hedonic scale, with 1 denoting “Like extremely” and 9 denoting “dislike extremely,” was used to code and serve cookie samples to panelists on a white plastic plate. In between the evaluations, the mouth was rinsed with table water. The coded samples were to be assessed by the panelists for color, crispiness, aroma, taste, and general acceptability (Adeyanju et al.97).
Statistical analysis
Using the statistical package for the social sciences (SPSS) software version 20, one-way variance (ANOVA) was used to analyze all the data obtained, and Duncan’s multiple range test was used to separate the means, a significance level was established at P < 0.05 (Steel and Torrie, 1980)98.

Responses