Effect of hydrogen leakage on the life cycle climate impacts of hydrogen supply chains
Introduction
Hydrogen has been identified as a promising and scalable option to decarbonize hard-to-abate industries such as iron and steel production, heavy manufacturing, and heavy-duty transportation1,2,3,4. As of August 2024, 61 countries, including the United States (US), have official national hydrogen strategies5. Other countries, including China, have included hydrogen in their decarbonization and energy plans6. Recent energy policies in the US, such as the regional clean hydrogen hubs and the Clean Hydrogen Production Tax Credit in the Inflation Reduction Act (IRA), are set to dramatically increase the production and use of clean hydrogen7. Thus, various analyses have projected that hydrogen production and consumption volumes could increase from under 100 Megatonnes (Mt) in 2022 to 530–650 Mt by 20508,9,10,11. As governments worldwide have pledged billions in investments toward hydrogen development and expansion, quantifying hydrogen greenhouse gas emissions would be beneficial to understanding life cycle climate impacts. For the IRA’s Clean Hydrogen Production Tax Credit, the available tax credits depend on the life cycle greenhouse gas emission intensity of the hydrogen production process in kilograms of CO2– equivalent per kilogram of hydrogen (kgCO2e/kgH2). Supply chains with life cycle emissions below 4 kgCO2e/kgH2 will qualify for the most generous support7. The tax credit requires a well-to-gate life cycle analysis, including emissions associated with feedstock growth, gathering, extraction, processing, and delivery to a hydrogen production facility and emissions associated with the hydrogen production process itself. The hydrogen Greenhouse gases, Regulated Emissions, and Energy use in Transportation model (45 VH2-GREET) developed by Argonne National Laboratory was designated as the official tool to quantify emissions for tax credit applicants12. The 45VH2-GREET model, however, does not account for hydrogen fugitive emissions and leakage, nor does it include all hydrogen production methods that might be economically viable. This absence can unintentionally impede innovations that are not currently encompassed within the established repertoire of 45VH2-GREET. Furthermore, the 45VH2-GREET model and, subsequently, the clean hydrogen tax credit assessments, do not consider downstream emissions and, therefore, omit a crucial aspect of hydrogen’s emission reduction capability through the displacement of fossil fuels.
Extensive work has previously been done to evaluate the life cycle emissions and impacts of hydrogen, specifically for hydrogen production pathways13,14. These assessments generally do not include the indirect climate warming effects of hydrogen within the calculated global warming potential of the life cycle results. Though hydrogen itself is not a greenhouse gas, it interacts with the hydroxyl radical, which is the primary sink for methane. This interaction increases the atmospheric lifetime of methane, a potent greenhouse gas, and thus, hydrogen indirectly increases radiative forcing15,16,17. In the troposphere, methane oxidation leads to the production of formaldehyde, which produces hydrogen through photolysis. The natural presence accompanied by increased anthropogenic injection of hydrogen in the atmosphere that can occur through leakage might accentuate this adverse atmospheric interaction. Furthermore, certain hydrogen production pathways, such as pyrolysis and steam methane reforming (SMR), rely on a methane feedstock, which can also be leaked, effectively increasing the overall stockpile of atmospheric methane. Moreover, through its interaction with hydroxyl, hydrogen increases tropospheric ozone and produces water vapor, which also acts as a greenhouse gas through radiative trapping in the stratosphere18. Hydrogen has other environmental and safety issues (water consumption, flammability range, etc.). However, these considerations are outside the scope of this study, which focuses on indirect warming impacts19,20.
There are uncertainties across the literature concerning the quantification of hydrogen sinks and global hydrogen leakage rates. Gaseous hydrogen is more reactive and has a smaller molecular cross-section than methane and is therefore prone to leak21. The leakage rates available in previous studies are obtained from assumptions, calculations, lab experiments, and simulations22. These estimates are not uniform across hydrogen production technologies or supply chains. Most studies utilize hydrogen leakage rates ranging from 1 to 10% to produce estimates of its climate implications. A recent study synthesizing known hydrogen emission rates reported present and future value chain emissions varying between 0.2% and 20%22. A study by Cooper et al. presented hydrogen emission and loss rates by process and supply chain. They also found a sizeable range (0.1–6.9%) in emissions across the studied supply chains with some of the greatest uncertainties and highest emission and loss rates expected for liquefaction23. In the effort to obtain more accurate hydrogen leakage rates, the US Department of Energy (DOE) recently announced a $20 million detection and quantification development initiative24. Furthermore, there is a lack of consensus on hydrogen’s global warming potential due to its relatively shorter lifespan of 2.5 years compared to other greenhouse gases25. The commonly encountered metrics are global warming potential over 100 years and 20 years (GWP100, GWP20) and global temperature potential over 100 years and 20 years (GTP100, GTP20). The values reported for hydrogen are 13 ± 5 for GWP100, 40 ± 24 for GWP20, 2 ± 1.5 for GTP100, and 18 ± 23 for GTP2025.
The Hydrogen Council conducted a life cycle assessment (LCA) that considered various pathways envisioned for future hydrogen value chains for 2030 and 205026. The pathways in the study consist of four autothermal reforming (ATR) plants coupled with 98% capture of total emitted carbon and four electrolysis pathways with onshore or offshore wind and/or solar energy26. The end-use applications in their analysis include light-duty vehicle transport, shipping, industrial heat, power generation, fertilizer manufacturing, public transport, and steel production. The analysis includes a comparison between the various hydrogen pathways used and alternative fossil fuel-based or electric-based pathways as appropriate. The results of the study indicated that the effects of using hydrogen range from 60% to 100% reduction in warming for the respective supply chains relative to current methods, assuming a carbon intensity reduction of the global grid mix26. Although this analysis included operational hydrogen venting at production, it omitted fugitive emissions along the supply chain and the indirect warming effects of hydrogen.
Recently, researchers from the Environmental Defense Fund conducted a study on the life cycle of hydrogen deployment pathways in which hydrogen leakage and warming effects were taken into consideration27. The study was based on the LCA completed by the Hydrogen Council in 202126 but only considered four end uses, notably light-duty vehicle transport, shipping, industrial heat, and power generation, and focused on impacts in 2050. Additionally, carbon capture on ATR hydrogen production was assumed to range from 60% to 98%. A hydrogen leakage range of 1–10% was assumed across the value chain, and five levels of methane leakage were considered: —extreme low (0.01%), low (0.6%), medium (0.9%), high (2.1%), and extreme high (5.4%). The comparisons between the hydrogen pathways and fossil fuel alternatives were completed using the technology warming potential (over 10, 20, 50 years), which measures the effect of switching from one technology to another, and GWP (over 20 and 100 years). Under extreme cases, the use of hydrogen can produce a 46% increase or a 93% decrease in warming, respectively. This range suggests that better understanding of hydrogen life cycle emissions and warming impacts and appropriate supply chain and end use selection is critical for hydrogen use to yield meaningful climate benefits. Furthermore, electrolysis production pathways appear to be the most consistent in emission reduction (>60%) regardless of hydrogen leakage and warming effects over different time scales27. Despite its thoroughness in considering hydrogen emissions, this study omits two main end uses for hydrogen, notably steel production and heavy-duty transport, which are examined in this work.
Steel production is responsible for 9% of worldwide carbon dioxide emissions today, averaging 1.85 tonnes of CO2e emitted per tonne of steel produced28. Proposed decarbonization strategies for the steel industry include substituting hydrogen and direct reduction in place of coal used in blast furnaces29,30. Additionally, renewable energy based electrified heating or hydrogen combustion could be used for process heat to reduce or eliminate emissions. Superchi et al. found that an optimal renewable hydrogen case for steel making in Italy could result in an emissions intensity of only 0.24 tonnes of CO2e per tonne of steel produced31. Similarly, hydrogen has been proposed as an alternative fuel to reduce heavy-duty trucking emissions that currently range from ~0.1 to 0.3 kgCO2e per tonne-km for conventional vehicles operating with diesel32,33.
In this work, we aim to fill the existing knowledge gap by including leakage rates and global warming potential to quantify the life cycle climate effects from (1) different hydrogen production pathways and then (2) using that hydrogen as an alternative to traditional energy sources for end uses previously omitted in literature. Given the projected growth of hydrogen in the energy mix to meet 2050 decarbonization goals and the concerns that hydrogen might indirectly cause warming that undermines progress towards mitigating climate change, it is valuable to comprehensively assess the impacts of the full life cycle emissions and indirect warming effects of hydrogen. This approach will be demonstrated with LCAs of a few sample hydrogen production pathways (electrolysis with grid-tied electricity, electrolysis with carbon-free electricity, SMR, and SMR with carbon capture and sequestration) and product manufacturing of steel and heavy-duty transport. Based on the findings detailed in this manuscript we recommend a nuanced approach in choosing application areas for hydrogen.
Results
Production
This study used hydrogen global warming potentials from Hauglustaine et al.25. An initial 2% hydrogen leakage was applied to all the production methods to assess the effects of the other variables. Figure 1 shows the results of this standardized leakage reported in kgCO2e/kgH2 using GWP100 of hydrogen. The difference between the overall greenhouse gas intensity of hydrogen production with and without indirect warming from hydrogen leakage is <0.5 kgCO2e/kgH2 for all pathways considered, which represents less than a 15% increase for electrolysis with grid-tied electricity, SMR, and SMR with carbon capture and sequestration (CCS). Consequently, though there is a slight increase in CO2e emissions when hydrogen’s indirect warming effects are introduced into the model, the carbon intensity of the electricity source and the carbon intensity of the production process have a much greater bearing on the overall warming potential of hydrogen production.
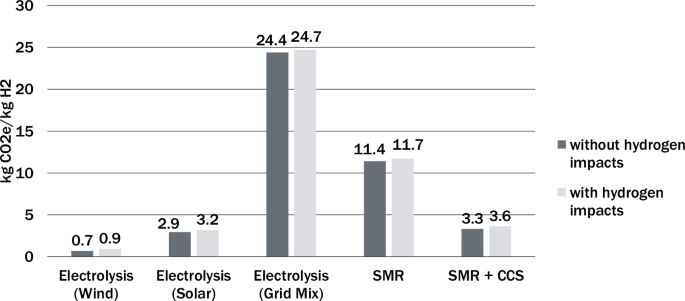
The inclusion of the indirect warming impacts of hydrogen increases equivalent greenhouse gas emissions intensity by less than 15% in most cases, depending on the production pathway. Results presented use GWP100. [SMR steam methane Reforming; CCS carbon capture and sequestration].
Figure 2 shows an assessment of the sensitivity to different climate metrics of hydrogen indirect warming effects over time with uniform 2% leakage for all the production methods. The increase in carbon intensity introduced solely by hydrogen warming effects (as opposed to methane) over different time frames is presented through the contrast between the base scenario and the inclusion of hydrogen GWP. On average, there is a 1.7 kgCO2e/kgH2 difference between the GWP20 and GWP100 values of life cycle carbon intensity. With the relatively shorter lifetime of hydrogen, such results align with previous studies that concluded the climate effects of hydrogen are slightly attenuated over time22,34.
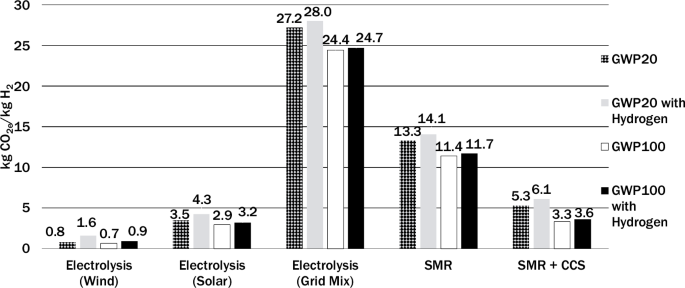
Results are shown for four climate metrics notably, GWP20 (cross hatched), GWP20 with hydrogen indirect impacts (solid gray), GWP100 (solid white), and GWP100 with hydrogen indirect impacts (solid black).
An assessment of current reported leakage rate projections for 2050 by Esquivel-Elizondo et al.22, revealed considerable variation. Electrolysis with renewables has the highest reported leakage rates varying between 2.0% and 9.2%. These relatively high values are due to venting and purging that occur for safety reasons during the electrolysis process. Unabated SMR and SMR coupled with CCS have leakage rates that vary between 0.5% and 1.0%. The detailed leakage rates used for this analysis are outlined in the “methods” section.
Figure 3 shows that regardless of the leakage rates, electrolysis with wind power consistently has the lowest emissions. On the other hand, when considering well-to-gate life cycle emissions, electrolysis with solar power can exceed the “clean hydrogen” threshold if the hydrogen leakage reaches or surpasses the upper leakage limits assessed in this study. However, for the lower and average scenarios, CO2 emissions per kilogram of hydrogen production using electrolysis with solar remained comparable to SMR with CCS even with an upper limit leakage rate. On the other hand, unabated SMR, even with lower hydrogen leakage rates, has the highest overall emissions (partly because of fugitive methane emissions in its supply chain) and fails to meet the DOE clean hydrogen standard of 4.0 kgCO2e/kgH2 for well-to-gate life cycle greenhouse emissions. It must be noted our analysis includes a greater scope of emissions than those outlined in the 45V guidance (view methods).
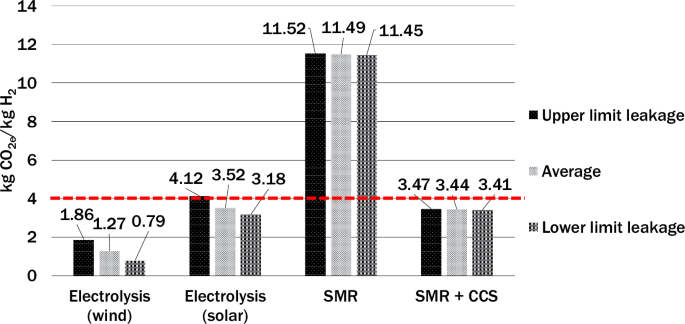
The respective high, average, and low leakage rates used are as follows: Electrolysis (left): 9.2%, 4.6%, and 2%; SMR (center) 1%, 0.8%, and 0.5%; SMR + CCS (right): 1.5%, 0.8%, and 0.6%. The threshold below which tax credits are potentially available from the U.S. Inflation Reduction Act is indicated by the red horizontal dashed line. Results are presented using GWP100.
Steel production and heavy-duty transport case studies
Figure 4A, B show the decrease in emissions observed with the use of hydrogen for steel production and heavy-duty transport respectively. The results from the steel supply chain LCA include hydrogen leakage and associated indirect warming effects at each stage of the supply chain (production, transportation, and end use). The assessment reveals a minimum 800 kgCO2e per tonne of steel (t-steel) production decrease in the carbon intensity of steel production using hydrogen compared to current fossil fuel-based methods with an average carbon intensity of 1850 kgCO2e/t-steel28. Further reduction is observed with decreased carbon intensity of the hydrogen production method. A decrease in emissions of 0.17 kgCO2e per tonne-kilometer (t-km) is observed with hydrogen based heavy duty trucking when using electrolysis powered by wind. With hydrogen produced via electrolysis with solar power, emissions are slightly above current diesel-based heavy-duty transport. An increase in emissions (0.79 kgCO2e/t-km) for heavy duty transportation is observed when using hydrogen from unabated SMR.
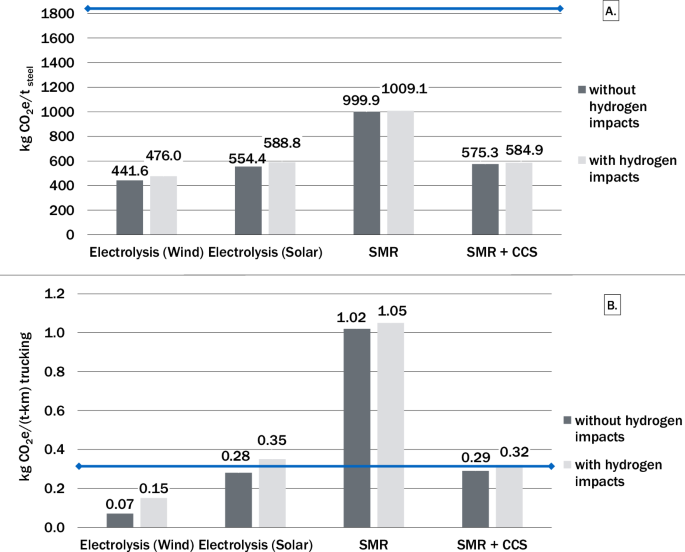
The results with (dark gray) and without (light gray) considering the indirect warming impacts of hydrogen indicate a net decrease in greenhouse gas emissions when using hydrogen for steel production and heavy-duty transport. The blue horizontal line represents the conventional average carbon intensity for each end use, notably 1860 kgCO2e/t-steel and 0.30 kgCO2e/(t-km) trucking28,32,45.
Discussion
Including hydrogen leakage and its associated impact in LCA models increases the total climate impact of hydrogen production by up to 0.5 kgCO2e/kgH2. These findings suggest that while hydrogen’s indirect warming effects do increase the climate impact of hydrogen production, other sources of emissions along the supply chain, including electricity production, fugitive methane emissions, and process emissions, are more influential and have a larger impact in the overall warming effect of hydrogen production. Furthermore, even with high hydrogen fugitive emission rates, electrolysis powered by renewables meets the U.S. federal standard of clean hydrogen production with life cycle emissions intensity below 4 kgCO2e/kgH2.
Moreover, by incorporating median leakage values and hydrogen GWP into an existing steel production process it was evident that there is a noteworthy decrease in emissions per tonne of steel produced when shifting from conventional fossil fuel to hydrogen-based steel production, regardless of the production pathway for the hydrogen. To put these results in context, the US steel sector produced 87 Mt of crude steel in 2018, which was responsible for 113 MMT CO2e or ~2% of total US emissions35. If all this steel had been produced using hydrogen processes, emissions would have been reduced to 38–87 MMT CO2e without hydrogen impacts or 41–88 MMT CO2e with hydrogen impacts, depending on the hydrogen production pathway. Accounting for the GWP impact of hydrogen only marginally increases the total steel sector emissions and still yields significant emission reductions compared to incumbent steel production technologies.
In heavy-duty transportation, hydrogen in place of diesel can reduce or exacerbate climate impacts depending on the production pathway. For this use case, accounting for the GWP impacts of hydrogen could materially inform when hydrogen is an effective decarbonization tool in this sector. Hydrogen produced via wind powered electrolysis has lower climate impact while hydrogen produced via electrolysis with solar power, SMR, and SMR with CCS has a similar or higher carbon intensity compared to current heavy-duty fuels. In one use case (steel) hydrogen had clear benefits for reducing emissions regardless of hydrogen production pathway. In another use case (heavy-duty transport), hydrogen production strongly influenced the abatement potential of using hydrogen compared to incumbent technologies. These results show that intentionally prioritizing hydrogen to the highest impact end-use sectors is critical to realize benefits for decarbonization.
Our findings indicate the need for a nuanced approach in evaluating hydrogen’s role in mitigating climate change effects. Additional research is needed to understand the implications of new hydrogen production pathways and end-use case studies, as well as further empirical data on fugitive emission rates of real-world hydrogen systems. This research demonstrates that, generally, the indirect climate impacts of hydrogen do not negate its climate benefits. However, while hydrogen holds promise as a cleaner energy source, careful consideration of its supply chain, leakage, and indirect climate effects is crucial to ensure meaningful contributions to global decarbonization goals.
Methods
The goal of this assessment is to quantify the impact of hydrogen’s indirect climate effects and leakage rates on the life cycle emissions of different hydrogen production methods and end uses. We use a LCA model constructed through the Open LCA software v.2.10 and the IPCC 2021 impact assessment method to estimate greenhouse gas emissions intensity of various hydrogen production pathways36. The functional unit is the product of concern, which in this case is hydrogen or the concerned end use (highlighted in red in the data tables). Every phase of the life cycle is divided into processes, which are subsequently interconnected through intermediate flows, thereby forming a product system. The data used to conduct this analysis were obtained from the Ecoinvent database v.3.10 released in 202337, a sustainability assessment life cycle inventory, in addition to available hydrogen leakage rates obtained from a study conducted by Esquivel-Elizondo et al.22. The scenarios assessed and subsequent data are US specific. The GWP100, and GWP20 of hydrogen obtained from a study conducted by Hauglustaine et al.25 reported in Table 1 were incorporated in the assessment. These values were used in order to understand the warming potential of each production pathway with associated leakage and indirect hydrogen climate impact over time. It must be noted that the pathways explored in this study do not encompass all the potential production, distribution, and end use components in future hydrogen scenarios, but rather represent a selection deemed by the authors as most imminent based on literature and policies. Additionally, outside of warming potential, hydrogen may pose other environmental and safety concerns that are not captured by the GWP metric and are subsequently not emphasized in this study. View Supplementary Methods (I) for a list of compounds considered within GWP metric.
Production
The production methods taken into consideration in this analysis are unabated SMR (SMR without CCS), SMR coupled with 96% CCS (SMR + CCS), electrolysis using a grid mix supply of electricity, electrolysis using solar (equivalent kWh not hourly matched), and electrolysis using wind energy (equivalent kWh not hourly matched). Figures 5, 6, and 7 display the system boundaries of the production methods used. As shown in Fig. 5 and Fig. 6, the system boundary for the SMR pathways begins with the raw material production and transport of natural gas, deionized water, metallurgical aluminum oxide, magnesium oxide, copper oxide, quicklime, chromium oxide, zinc oxide, zeolite powder, molybdenum trioxide, silica sand, and portafer. Additionally, the embedded emissions of the chemical factory and storage tank are included. The natural gas is sourced from markets in the US, and the remaining inputs are sourced from the global market. The SMR + CCS pathway also includes within the system boundaries the carbon capture equipment and the additional electricity inputs to run the equipment. As shown in Fig. 7, the system boundary for the electrolysis pathways begins with deionized water, the designated electricity supplier (grid, solar, wind, or renewable mix) and their capital expenditure (CAPEX) emissions. The electricity for electrolysis is sourced from the Texas Regional Entity for grid mix and wind electrolysis and from the Western Electricity Coordinating Council for solar (photovoltaic) electrolysis. For all the production processes, the system boundaries stop after the production of hydrogen (that is, at the system gate). Tables 2 and 3 detail the inputs and outputs of each production process considered in this study.
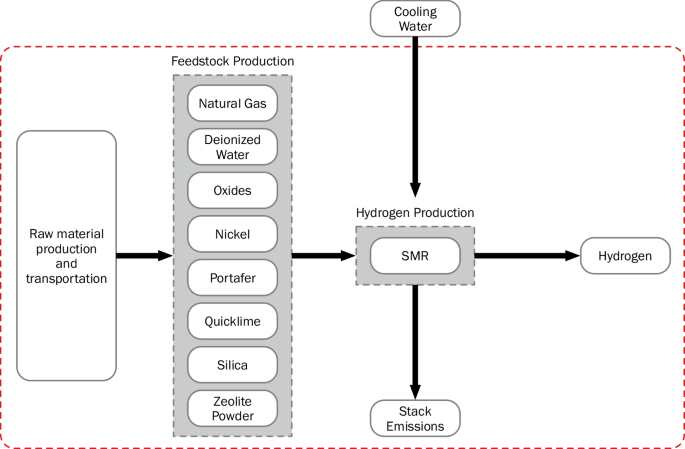
The system boundary is shown as a red dashed line.
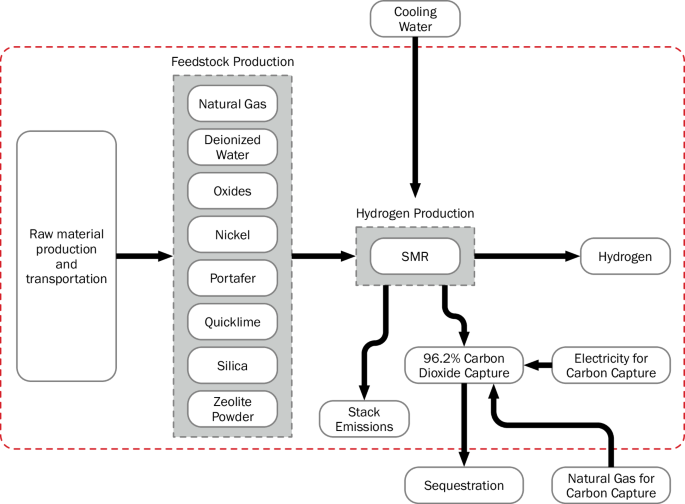
The system boundary is shown as a red dashed line.

The system boundary (shown as a red dashed line) includes upstream CAPEX emissions for electricity production.
The data for the SMR production processes (Tables 2 and 3) are based on an SMR plant assessed by Antonini et al.38. The natural gas is pressurized at 200 bars. The hydrogen yield of the process is enhanced with a water gas shift reaction. In the unabated SMR process, the carbon dioxide exits the plant with the flue gas from the furnace. A separate model for CCS was not built for this LCA, rather a 96.2% capture rate was applied to the total amount of carbon dioxide emitted from the base unabated SMR process, and the subsequent electricity requirements were added as additional input. The electricity input value calculations (view Supplementary Methods (II)) were based on findings from the National Energy Technology Laboratory39. The electricity and water input values for electrolysis were obtained from reports published by the National Renewable Energy Laboratory40,41,42. This analysis does not account for specific variations between PEM and alkaline electrolyzers, as the differences are small.
An upper limit, lower limit, and average leakage rates were assessed for each production method to gauge the sensitivity of supply chain greenhouse gas emissions intensity to leakage rates. These leakage rates are detailed in Table 4. An assessment of current reported hydrogen leakage rate projections for 2050 by Esquivel-Elizondo et al.22, revealed considerable variation. Electrolysis with renewables has the highest reported leakage rates varying between 2.0% (lower limit) and 9.2% (upper limit). These relatively high values are due to venting and purging that occur for safety reasons as a result of oxygen build up during the electrolysis process. Unabated SMR and SMR + CCS have leakage rates that vary between 0.5% and 1.0%. There are limitations in the leakage values used as they are obtained from simulations or models. There is little to no direct measurement data available on hydrogen leakage. Methane leakage during the SMR processes is <1% (default in the Ecoinvent database).
Production model validation
A validation was conducted by comparing the results from the models in this study to the Hydrogen Production Emissions Calculator (HyPEC) tool version 1.0, which is based on the GREET model version 202143,44. Figure 8 shows the results of this validation, excluding the indirect warming effect of hydrogen. At the time of this analysis, the 45V-GREET had yet to be made available. The difference between the models for all the production pathways considered is less than 2 kgCO2e/kgH2. In both models, upstream methane emissions are less than 1%. This validation, conducted during the early stages of research, used 40 kWh as electricity input for both models rather than 50 kWh used in the rest of the study to account for inefficiencies.
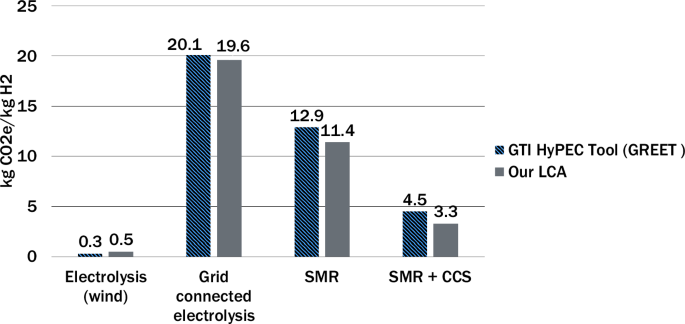
Comparison between LCA model conducted with Open LCA and the Ecoinvent database in this study (right) with existing GTI HyPEC tool43 based on the GREET model44(left) validates the model.
Steel case and heavy-duty transport case studies
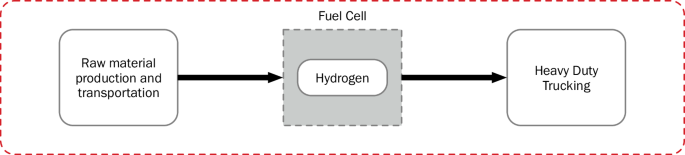
The steel and heavy-duty transport pathways selected are based in Texas to mimic future scenarios as one of the DOE hydrogen hubs, Gulf Coast Hydrogen Hub (HyVelocity), is expected to be constructed in Houston. A hydrogen pipeline transportation distance of 400 km is assumed with the scenario that the hydrogen would be produced in Houston and used at some location within or on the outskirts of the Texas Triangle. The Texas Triangle is defined as the area encompassing Austin, Dallas-Fort Worth, Houston, and San Antonio with the latter three as the corners connected by Interstate 45, Interstate 10, and Interstate 35. The distance chosen for pipeline transport represents the average of the three sides of the Texas triangle rounded up to the nearest hundred. The percentages of hydrogen leaked during pipeline transport and end use consumption used in the model are specified in Table 5. An average leakage rate of 0.3% is assumed during hydrogen pipeline transport22. Tables 6 and 7 detail the input and outputs of these end uses, and Figs. 9 and 10 illustrate the system boundaries for the end uses applied in the two supply chains. The gas power plant stack emissions in the electricity supply chain include acenaphthene, acetaldehyde, acetic acid, arsenic ion, benzene, benzo(a)pyrene, beryllium II, butane, cadmium II, carbon monoxide, chromium III, cobalt II. dinitrogen monoxide, dioxins measured as 2,3,7,8-tetrachlorodibenzo-p-dioxin, ethane, formaldehyde, hexane, lead II, manganese II, mercury II, methane, nickel II, nitrogen oxides, PAH, particulate matter, pentane, propane, propionic acid, selenium IV, sulfur dioxide, and toluene37. Hydrogen fuel cell trucks have varying characteristics such as on-board hydrogen storage, battery size, fuel cell power, and range which present difficulties in systems level modeling for hydrogen based heavy-duty trucking. For example, the Xcient fuel cell truck with range of 400 km developed by Hyundai has a 72-kWh battery, 190 kW fuel cell power, and can carry 31 kg of hydrogen compressed at 350 bars. The Daimler truck, which was developed by Mercedes Benz and has a range of 1000 km, demonstrated the use of liquid hydrogen (80 kg maximum capacity) with 70 kWh battery size and 300 kW fuel cell power45. Consequently, this study only assesses the necessary hydrogen input for transporting 1 tonne over a km obtained with the characteristics of Xcient fuel cell truck.
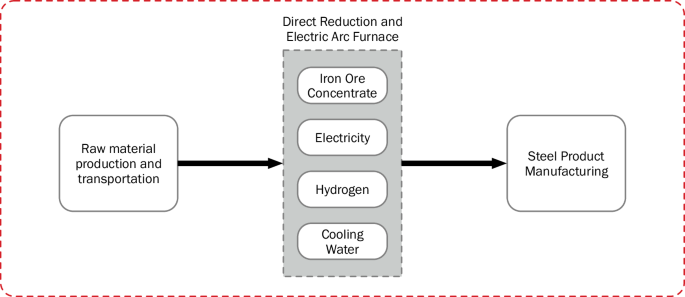
(red dashed line).
(red dashed line).
Reporting summary
Further information on research design is available in the Nature Portfolio Reporting Summary linked to this article.
Responses