Effect of Nb contents on the passivation behavior of high-strength anti-seismic rebar in concrete environments

Introduction
High-strength anti-seismic rebar has excellent strength and good plasticity in concrete structures and it is a widely used in the large engineering structures (such as cross-sea bridges, suspension bridges and high-rise buildings)1,2,3. Due to the formation of the passive film in the highly alkaline concrete environment, high-strength anti-seismic rebar exhibits the excellent corrosion resistance and good stability in concrete structures4,5,6. When the high alkaline concrete is subjected to the carbonization or Cl− ion erosion, the passive film on the surface of high-strength anti-seismic rebar will be destroyed and degraded, resulting in the loss of the protective effect on the surface of high-strength anti-seismic rebar and the destruction of concrete structures7,8,9,10. However, from the perspective of long-term durability of high-strength anti-seismic rebar in concrete structures, how to design the long-term corrosion resistance of high-strength anti-seismic rebar in concrete structures has always been a research bottleneck. Therefore, the development of structural stability and corrosion resistance of high-strength anti-seismic rebar provides new ideas for the long-term durability and service life of the concrete structures.
It was well known that the passivation behavior of micro-alloyed rebar mainly depended on the concrete pH and the microalloying element compositions (such as Nb, Cr, etc.), and the stability and protection of the passive film were mainly affected by the synergistic effect of the concrete pH and the microalloying element compositions. In which, the microalloying elements played an important role in the passivation process of micro-alloyed rebar, and the corresponding oxides played a role in repairing the passivation layer and had a beneficial effect on the stability and compactness of surface passive film of micro-alloyed rebar, thus directly affecting the corrosion resistance of micro-alloyed rebar. Therefore, it was of great significance to analyze the synergistic effect of microalloying elements and concrete pH on the passivation layer of micro-alloyed rebar. The influence of microalloying elements and concrete pH on the formation of surface passive film of micro-alloyed rebar has also been reported by many researchers. Many studies11,12,13,14,15,16 also reported that the formation mechanism of surface passive film of micro-alloyed rebar in simulated concrete pore solutions, and the stability and compactness of surface passive film of micro-alloyed rebar mainly depended on the influence of microalloying elements and concrete pH. Firstly, in the high alkaline concrete pore solution, a protective and stable passive film will be formed on the surface of micro-alloyed rebar, and the outer passive film was mainly composed of Fe hydroxyl oxides and Fe oxides, and the inner passive film was mainly composed of Fe oxides11,12,13. Secondly, with the decreases of pH in simulated concrete pore solution, the Fe oxides/Fe hydroxides in the surface passive film of carbon steel gradually degraded, which decreased the protective ability of carbon steel, while the surface passive film of micro-alloyed rebar formed the high stability and protective microalloying element oxides, which inhibited the dissolution of stable Fe oxides and enhanced the protective effect of micro-alloyed rebar14,15,16. Liu et al.17, Zhang et al.18, Shi et al.19 studied the passivation behavior of Cr micro-alloyed rebar and carbon steel in simulated concrete pore solution, and the results indicated that the passive film of Cr micro-alloyed rebar displayed more stable than that of carbon steel with the decreases of pH, which was attributed to the fact that the formation of highly stable Cr oxides in the passivation layer of Cr micro-alloyed rebar enhanced the corrosion resistance of Cr micro-alloyed rebar. Zhang et al.20 studied the passivation performance of Cr micro-alloyed rebar and carbon steel in simulated concrete pore solution, and the results indicated that compared with carbon steel, with the increase of Cr content from 5 wt.% to 11 wt.%, the free energy required for the stable oxide thickening were decreased from 20.12 kJ/mol to 9.25 kJ/mol, which was beneficial to promote the rapid formation of a stable passivation film on the surface of micro-alloyed rebar. Liu et al.21,22 studied the corrosion resistance of Cr micro-alloyed HRB400 rebar in simulated Ca(OH)2 solution, and the results indicated that the addition of Cr increased the content of Cr(OH)3 and α-FeOOH in the surface passivation layer of HRB400 rebar, thus enhancing the compactness and stability of surface passive film of Cr micro-alloyed HRB400 rebar and inhibiting the local dissolution of the passive film. Li et al.23 and Liu et al.24 studied the corrosion resistance of Cr/RE micro-alloyed HRB400 rebar in simulated concrete carbonation solution containing Cl− ions, and the results indicated that the synergistic effect of Cr/RE significantly reduced the corrosion rate and passivation current density of HRB400 rebar, which was attributed to the fact that the synergistic effect of Cr/RE changed the structure of surface oxide film of HRB400 rebar, resulting in a higher Fe(II)/Fe(III) ratio, thus enhancing the corrosion resistance of HRB400 rebar. Zou et al.25 studied the passivation performance of a new type of Cr micro-alloyed rebar in carbonization environment, and the results indicated that the passive film of P-N type semiconductor composite structure containing Cr and Fe oxides was formed on the surface of Cr micro-alloyed rebar at pH 12.6 ~ 9.0, and the decreases of pH promoted the formation of Cr oxides, thus enhancing the passivation performance of micro-alloyed rebar. Zhang et al.26 studied the corrosion resistance of Cr/Al micro-alloyed rebar in coral aggregate concrete, and the results indicated that the chloride ion corrosion resistance of surface passive film of Cr1 rebar, Cr/Al rebar and Cr3 rebar were increased to 37.67%, 64.08% and 171.82%, respectively, this indicated that the increases of Cr content enhanced the corrosion resistance of surface passive film of micro-alloyed rebar. Hussain et al.27 studied the corrosion resistance of vanadium micro-alloyed rebar in concrete environment, and the results indicated that the protective Fe oxides were formed on the surface of vanadium micro-alloyed rebar, which enhanced the corrosion resistance of vanadium micro-alloyed rebar.
Based on the above research work, many studies mainly focus on the influence of Cr addition on the surface passivation behavior and corrosion resistance of micro-alloyed rebar, and the main purpose study the mechanism of Cr element in the passivation layer of micro-alloyed rebar. However, there were relatively few reports on whether the effect of Nb on the passivation behavior of micro-alloyed rebar in simulated concrete pore solution was consistent with the effect of Cr element. Previous studies28,29,30 pointed out that the increases of Nb promoted the enrichment of a small amount of Nb oxides (such as NbO, NbO2, Nb2O5) in the surface passive film of alloy materials, and the formation of highly stable Nb2O5 enhanced the stability and compactness of surface passive film of alloy materials. Liu et al.31,32 studied the corrosion resistance of Nb micro-alloyed HRB500 rebar in concrete environment, and the results indicated that with the increases of Nb content, the passivation current density and the double-layer capacitance of surface passivation layer of Nb micro-alloyed HRB500 rebar decreased significantly, this indicated that the addition of a small amount of Nb was beneficial to promote the formation of a stable passive film, which enhanced the corrosion resistance and protection ability of Nb micro-alloyed HRB500 rebar. Ji et al.33 studied the effect of Nb on the stability of surface passive film of Ti-Zr alloy, and the results indicated that the addition of Nb promoted the formation of Nb oxides (NbO, NbO2, Nb2O5), which enhanced the stability of the passive film of Ti-Zr alloy. Guan et al.34 studied the passivation behavior of high-purity Nb-containing forged plates in acidic fluoride solutions, and the results indicated that with the increases of pH, the highly stable Nb2O5 was formed on the surface passive film of high-purity Nb-containing forged plates, which enhanced the passivation rate of high-purity Nb-containing forged plates. The above studies mainly reported some effects of Nb on the formation of surface passive film of micro-alloyed rebar, but there was a lack of research on the mechanism of Nb in the surface passive film of micro-alloyed rebar. Therefore, it was necessary to further study the effect of Nb on the passivation behavior of micro-alloyed rebar in simulated concrete pore solution and the formation mechanism of the passive film.
In this study, the XPS sputtering depth, AFM and TEM were used to study the composition and structure of surface passive film of Nb-containing rebar and CS rebar, and the electrochemical methods (such as CV, M-S, EIS, i-t, DPP, etc.) were used to study the formation and corrosion resistance of surface passive film of Nb-containing rebar and CS rebar, and the corresponding passivation mechanism of Nb micro-alloyed rebar was proposed. Therefore, the results of this study will provide a new idea for the long-term service and durability design of high-strength anti-seismic rebar in concrete structures.
Results
Passivation reaction peak
The cycle voltampere (CV) curve of Nb-containing rebar and CS rebar after passivation for 10 d in SCPS with different pH (the last cycle after five cycles) were given in Fig. 1.

a pH13.2. b pH12.5. c pH10.5. d pH9.0.
Figure 1a–d shows that after passivation for 10 d in SCPS with different pH, the CV curves of Nb-containing rebar and CS rebar showed the similar shapes, the passivation reaction process of Nb-containing rebar and CS rebar displayed the two anodic reaction peaks (A1 and A2) and two cathodic reaction peaks (C1 and C2), and the passivation reaction process was divided into three regions, namely the active region, the passivation region, and the breakdown region12,35,36,37. During experiencing the forward passivation reaction, the first anodic reaction peak (A1) appeared at the range of −0.75 V ~ −0.69 V, which indicated that the formation of Fe2+ on the surface of Nb-containing rebar and CS rebar17,38,39 and the corresponding reaction process was as follows.
When the forward potential was close to the range of −0.51 V ~ −0.41 V, the second anode peak (A2) appeared on the surface of Nb-containing rebar and CS rebar, which indicated that the passive film initially formed, and the Fe2+ oxides was converted to Fe3+ oxides and Fe hydroxyl oxides40,41,42, and the corresponding reaction process was as follows.
When the potential was increased to 0.65 V, the current density of the anodic reaction process gradually increased, and the oxygen absorption control occurred in the passivation reaction process, resulting in the breakdown of the passive film.
In the reverse reaction process, the first cathode peak (C1) was corresponding to the anode peak (A2), which indicated that the reduction of Fe oxides and Fe hydroxyl oxides40,43,44, the second cathode peak (C2) was corresponding to the anode peak (A1), which indicated that the conversion of Fe3+ oxides to Fe2+ oxides14,38.
Figure 1a–d shows that with the decreases of pH, the current density of A1 peak and A2 peak significantly enhanced, and the current density of C1 peak significantly reduced, which indicated that the surface passive film of Nb-containing rebar and CS rebar was mainly composed of Fe2O3 and Fe3O4. At low pH9.0, compared with CS rebar, the current density of A1 peak and A2 peak of HNb rebar increased significantly with the increases of Nb, which indicated that the addition of Nb promoted the formation of more Fe oxides and Fe hydroxyl oxides on the surface passive film of HNb rebar, thus a stable passive film was formed on the surface of HNb rebar. Figure 1a–d also shows that after passivation for 10 d in SCPS with different pH, the passivation regions on the surface of four rebars were almost the same. With the decreases of pH, the passivation regions on the surface of four rebars gradually widened, this indicated that the decreases of pH in SCPS enhanced the passivation of Nb-containing rebar and CS rebar, which were corresponded to the significant increases of current density of A1 peak and A2 peak.
Semiconductor properties of passive film
The Mott-Schottky (M-S) formula was used to analyze the relationship between the capacitance and the potential on the surface of micro-alloyed rebar, and the M-S formula was defined as follows14,17,18,25.
Where, C is the space charge capacity, E is the applied potential at the interface of the simulated solution, ε is the dielectric constant (the dielectric constant of Fe oxide is 1245), ε0 is the vacuum dielectric constant (ε0 = 8.85 × 10⁻¹² F·m−1), e is the electron charge (e = 1.602 × 10⁻¹⁹ C), ND and NA are the donor and acceptor densities, respectively, EFB is the flat band potential (the intercept potential of the linear part in the M-S curve), k is the Boltzmann constant (k = 1.38 × 10⁻²³ J·k−1), T is the absolute temperature, S is the slope of the linear part in the M-S curve (when the slope of the linear part of the M-S curve was positive, the surface passive film of micro-alloyed rebar presents the N-type semiconductor; when the slope was negative, the surface passive film of micro-alloyed rebar presents the P-type semiconductor). The M-S curve of Nb-containing rebar and CS rebar after passivation for 10 d in SCPS with different pH were given in Fig. 2.
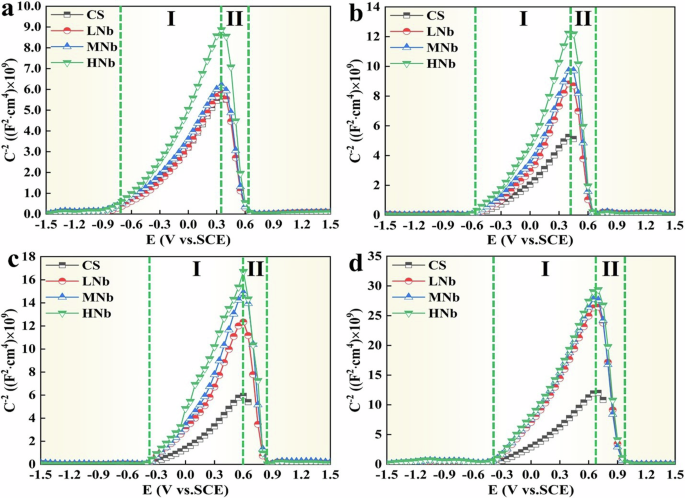
a pH13.2. b pH12.5. c pH10.5. d pH9.0.
It can be seen from Fig. 2 that after passivation for 10 d in SCPS with different pH, compared with CS rebar, the M-S curve shape of surface passive film of Nb-containing rebar showed the N-type semiconductor with positive slope (I region) and the P-type semiconductor with negative slope (II region). Previous studies18,46,47 reported that the semiconductor properties of surface passive film of micro-alloyed rebar were related to their composition and structure, which believed that the microalloying element oxides (such as Nb, Cr, etc.) exhibited the P-type semiconductors, and the Fe oxides exhibited the N-type semiconductors. Figure 2 also shows that the surface passive film of CS rebar mainly contained the Fe oxides, which presented the N-type semiconductors, while the surface passive film of Nb-containing rebar mainly contained the microalloying element oxides and Fe oxides, which presented the P-N type semiconductors.
The M-S curve in Fig. 2 was fitted using Eqs. (6) and (7), and the flat band potential and carrier density of surface passive film of Nb-containing rebar and CS rebar after passivation for 10 d in SCPS with different pH were given in Table 1.
Table 1 shows that with the decreases of pH, the flat band potential of surface passive film of Nb-containing rebar and CS rebar shifted positively, which indicated that the Fermi level of surface passive film of Nb-containing rebar and CS rebar increased, and the phase activity of surface passive film increased, resulting in the gradual dissolution of Fe oxides. Previous studies46,47,48 also showed that the conductive resistance of surface passive film of micro-alloyed rebar depended on the carrier density on the surface of film. Table 1 also shows that compared with CS rebar, the ND and NA values of surface passive film of Nb-containing rebar decreased significantly with the decreases of pH, and the ND and NA values of surface passive film of Nb-containing rebar at pH13.2 were about 2 ~ 3 times higher than those at pH9.0, and the ND and NA values of surface passive film of HNb rebar were lower. This indicated that at low pH9.0, with the increases of Nb, the conductive resistance of surface passive film of HNb rebar was stronger, resulting in the stronger protection and corrosion resistance of HNb rebar.
According to the “PDM” theory49, the surface passive film of alloy steel was mainly composed of metal oxides, these oxides existed some point defects, resulting in the semiconductor behavior of surface passive film of alloy steel. Table 1 shows that compared with CS rebar, with the decreases of pH, the increases of Nb led to a significant decrease in the ND and NA values of surface passive film of Nb-containing rebar. Combined with the E-pH diagram in Fig. 3, the Fe oxides in the passivation layer of CS rebar were mainly stable under the conditions of high pH, while the low-valence Nb oxides (NbO and NbO2) in the passivation layer of Nb-containing rebar displayed the existence under the conditions of pH9.0 ~ pH13.2, and the high-valence Nb oxides (Nb2O5) displayed the existence under the conditions of pH9.0 ~ pH10.5. This indicated that the addition of Nb was beneficial to promote the formation of stable Nb oxides under the conditions of low pH, which confirmed that the formation of Nb oxides inhibited the dissolution of protective Fe oxides, so that the metal cation vacancies of surface passive film of Nb-containing rebar continuously reduced, resulting in a close contact between the passive film and the rebar substrate, thus promoting the stable growth of the passive film. Therefore, at low pH9.0, the ND value of surface passive film of CS rebar was three times higher than that of HNb rebar, which indicated that the surface of HNb rebar had the lowest metal cation vacancies and the most stable passive film, resulting in higher corrosion resistance of HNb rebar.
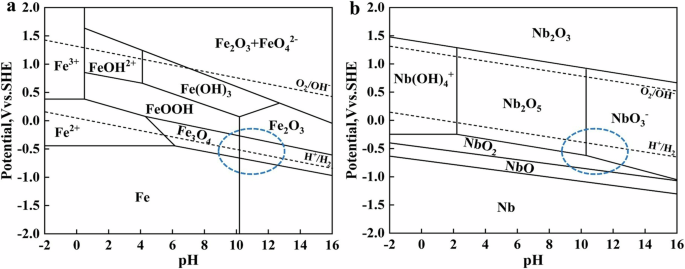
a Fe-H2O, 298.15 K. b Nb-H2O, 298.15 K. The blue dotted line frame was the phase composition region in the passivation process of pH13.2 ~ pH9.0.
Corrosion resistance of passive film
The EIS results of surface passive film of Nb-containing rebar and CS rebar after passivation for 10 d in SCPS with different pH were given in Fig. 4. Figure 4a, d, g, j shows that the radius of the capacitive arc curve of CS rebar decreased with the decreases of pH, which indicated that the passivation of CS rebar significantly decreased, while the radius of the capacitive arc curve of Nb-containing rebar increased with the decreases of pH, which indicated that the corrosion resistance of surface passive film of Nb-containing rebar gradually enhanced. Previous studies14,19,21 also reported that the larger the capacitive arc radius of micro-alloyed rebar, the better the stability and compactness of the passive film. Figure 4a, d, g, j also illustrates that at low pH9.0, compared with CS rebar, with the increases of Nb, the capacitive arc radius of Nb-containing rebar showed the higher superiority, and the capacitive arc radius of HNb rebar showed the higher value, which indicated that the surface passive film of HNb rebar showed the higher compactness.
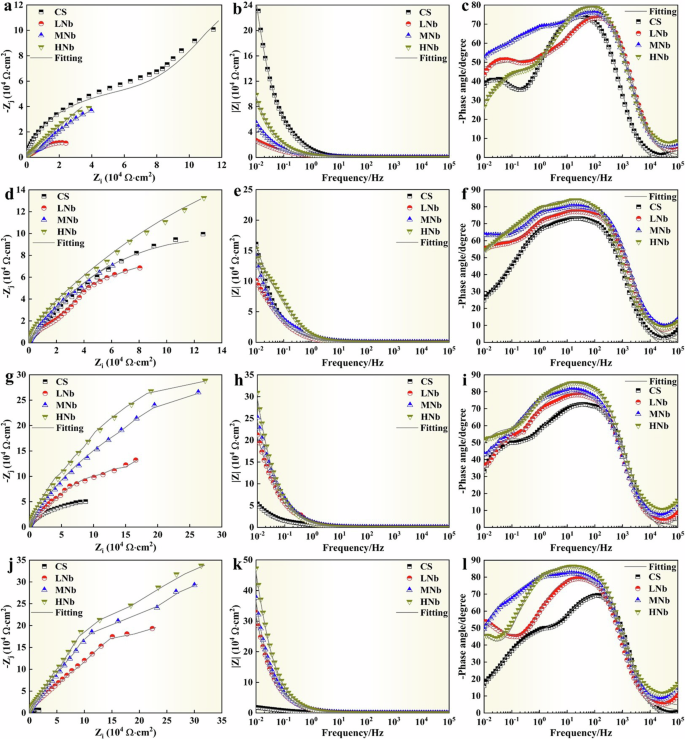
a–c pH13.2. d–f pH12.5. g–i pH10.5. j–l pH9.0. (a, d, g, j Nyquist. b, e, h, k Bode. c, f, i, l Phase).
Figure 4b, e, h, k shows that with the decreases of pH, the impedance modulus of CS rebar gradually decreased, while the impedance modulus of Nb-containing rebar gradually increased, which indicated that the corrosion resistance of surface passive film of Nb-containing rebar enhanced. At low pH9.0, compared with CS rebar, with the increases of Nb, the impedance modulus of LNb rebar, MNb rebar, HNb rebar were reached to 28.48 × 10⁴ Ω·cm2, 37.68 × 10⁴ Ω·cm2, 47.23 × 10⁴ Ω·cm2, respectively, which was higher value than the results reported in previous studies12,19,50, this indicated that the HNb rebar exhibited the higher impedance modulus, which was attributed to the fact that the increases of Nb promoted the formation of dense passive film of HNb rebar, thus enhancing the corrosion resistance of HNb rebar.
Figure 4c, f, i, l shows that with the decreases of pH, the maximum phase angle of CS rebar gradually decreased, while the maximum phase angle of Nb-containing rebar gradually increased, which indicated that the stability of surface passive film of Nb-containing rebar was better. Previous studies21,24,25 also reported that the smaller the maximum phase angle of surface passive film of micro-alloyed rebar, the lower the flatness of the passive film, the rougher the passive film, and the worse the protection of the passive film. At low pH9.0, compared with CS rebar, with the increases of Nb, the maximum phase angle of surface passive film of Nb-containing rebar showed the best superiority, and the surface passive film of HNb rebar had the excellent maximum phase angle, which indicated that the surface passive film of HNb rebar had the better protection.
It can be seen from Fig. 4 that after passivation for 10 d in SCPS with different pH, the maximum phase angles of four rebars showed a certain width, and this width gradually widened with the increases of Nb content, this indicated that the surface passive film of four rebars had a double-layer structure and showed a double-layer capacitance characteristic. Therefore, two constant phase elements were used to fit and analyze the double-layer capacitance characteristics of surface passive film of four rebars, which was consistent with the previous research19,21,24,25. The equivalent circuit in Fig. 5 was used to fit the EIS data in Fig. 4, and the equivalent circuit were given in Fig. 5.
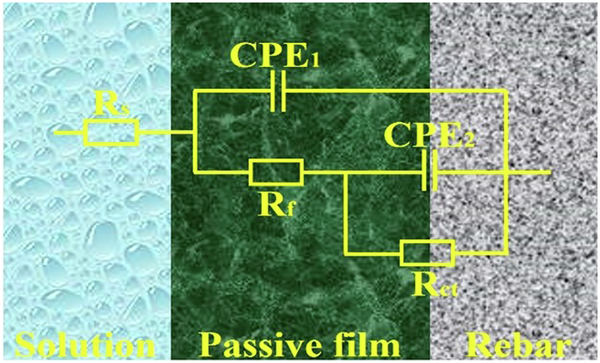
Equivalent circuit.
In Fig. 5, Rs is the resistance of the simulated concrete pore solution, Rf is the resistance of surface passive film of Nb-containing rebar and CS rebar, Rct is the charge transfer resistance, CPE1 is the constant phase angle element for the double-layer capacitance at the interface between the passive film and the simulated solution, CPE2 is the constant phase angle element for the double-layer capacitance at the interface between the passive film and the rebar matrix. When the surface passive film of Nb-containing rebar and CS rebar was a layer of uneven surface, the constant phase element CPE was a non-ideal capacitive behavior. The impedance value ZCPE of the constant phase element CPE were defined as follows14,19,24.
Where, Y0 is the basic admittance; n is the fitting index (0 < n < 1); j is the imaginary unit; w is the angular frequency. Relevant research51,52,53 showed that the constant phase element CPE were converted into the effective capacitance (C1) of the interface between the passive film and the simulated solution and the effective capacitance (C2) of the interface charge transfer between the passive film and the rebar matrix by Brug formula, Hsu formula and Mansfeld formula, and the calculation formulas of the effective capacitances C1 and C2 were as follows.
The effective capacitance values C1 and C2 of Nb-containing rebar and CS rebar were calculated using Eqs. (10) and (11), and the best fitting values and effective capacitance values were given in Table 2.
Table 2 shows that after passivation for 10 d in SCPS with different pH, the χ2 values of surface passive film of Nb-containing rebar and CS rebar was less than 10−3, this indicated that the fitting degree of EIS data was better. Compared with CS rebar, with the decreases of pH, the Rf value and Rct value of surface passive film of Nb-containing rebar increased significantly, and the effective capacitances C1 value and C2 value decreased significantly, which indicated that the decreases of pH promoted the stability and compactness of surface passive film of Nb-containing rebar, thus enhancing the corrosion resistance of Nb-containing rebar. At low pH9.0, with the increases of Nb, the Rf value and Rct value of surface passivation film of HNb rebar were three times higher than that of CS rebar, and the C1 value and C2 value were reduced by 3.5 times, which indicated that the increases of Nb promoted the smoothness and stability of surface passive film of HNb rebar, hindered the corrosion electrochemical reaction, and enhanced the protection performance of the passive film. Previous studies24,25 also reported that the decreases of pH and the additions of microalloying elements (such as Cr, Nb, etc.) promoted the thickening and stability of surface passive film of micro-alloyed rebar and obtained the excellent Rf value and Rct value, thus enhancing the corrosion resistance of micro-alloyed rebar.
The dynamic potential polarization (DPP) curve of Nb-containing rebar and CS rebar and the fitting value of DPP curve after passivation for 10 d in SCPS with different pH values were given in Fig. 6.
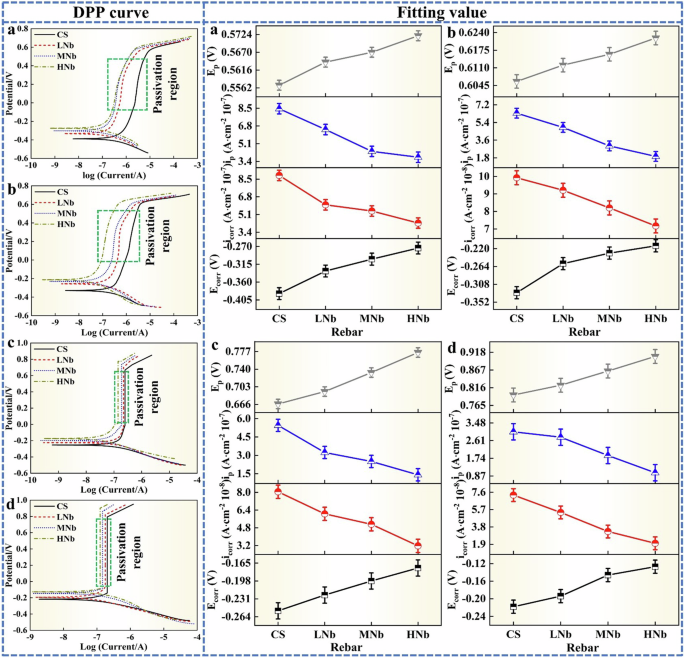
a pH13.2. b pH12.5. c pH10.5. d pH9.0. The green dotted line frame was the passivation region.
Figure 6 shows that after passivation for 10 d in SCPS with different pH, the DPP curve of Nb-containing rebar and CS rebar showed the similar shapes, and the DPP curve was mainly divided into cathodic polarization zone, anodic polarization zone, passivation zone and pitting zone. In Fig. 6, Ecorr was the corrosion potential, icorr was the corrosion current density, ip was the passivation current density, and Ep was the pitting potential. Figure 6 shows that with the decreases of pH, the Ecorr value of surface passive film of Nb-containing rebar and CS rebar was obviously positive, and the icorr value greatly reduced, which indicated that the surface of Nb-containing rebar and CS rebar reached a stable passivation state, which greatly improved the corrosion resistance of Nb-containing rebar and CS rebar.
Previous studies12,14,19,23,24,25 also reported that the anodic dissolution process on the surface of micro-alloyed rebar was mainly controlled by Fe dissolution, and the cathodic reaction process was mainly controlled by diffusion of dissolved oxygen. During the initial passivation reaction, a large amount of Fe matrix was dissolved to form Fe2+, which promoted the anodic dissolution process. With the progress of the reaction process, Fe2+ was further transformed into the initial product Fe hydroxides and Fe hydroxyl oxides. Under the action of dissolved oxygen, the initial product was further transformed into stable Fe oxides, which inhibited the anodic dissolution and promoted the formation of the protective passivation film on the surface of micro-alloyed rebar, resulting in the positive shift of Ecorr value and the decrease of icorr value, this indicated that the corrosion resistance of micro-alloyed rebar gradually increased. At low pH9.0, compared with CS rebar, with the increases of Nb, the Ecorr value of HNb rebar was reached to −0.127 V, and the icorr value was decreased to 2.008 × 10⁻⁸ A·cm−2. This indicated that the increases of Nb made HNb rebar to obtain the excellent Ecorr value and icorr value, which enhanced the corrosion resistance of HNb rebar.
Previous studies23,24,25,54,55 also reported that the lower the passivation current density of micro-alloyed rebar, the smaller the conduction rate of metal cations in the passive film, and the greater the resistance of the passive film. Figure 6 also shows that compared with CS rebar, with the decreases of pH, the ip value of surface passive film of Nb-containing rebar decreased significantly, and the Ep value increased significantly, which indicated that the decreases of pH and the increases of Nb promoted the formation of a stable and dense passive film on the surface of Nb-containing rebar, and the resistance of the passive film was large, which greatly improved the corrosion resistance of Nb-containing rebar. At low pH9.0, the passivation current density of surface passive film of HNb rebar was about 2.5 times lower than that of CS rebar, and the pitting potential was increased by 0.2 V. This indicated that the addition of Nb made the surface passive film of HNb rebar to display the stronger film resistance and hinder the occurrence of anodic dissolution and pitting corrosion, thus enhancing the higher compactness of surface passive film of HNb rebar.
Formation process of passive film
The chronoamperometric current density curve (i-t curve) of surface passive film of Nb-containing rebar and CS rebar after passivation for 10 d in SCPS with different pH values were given in Fig. 7.
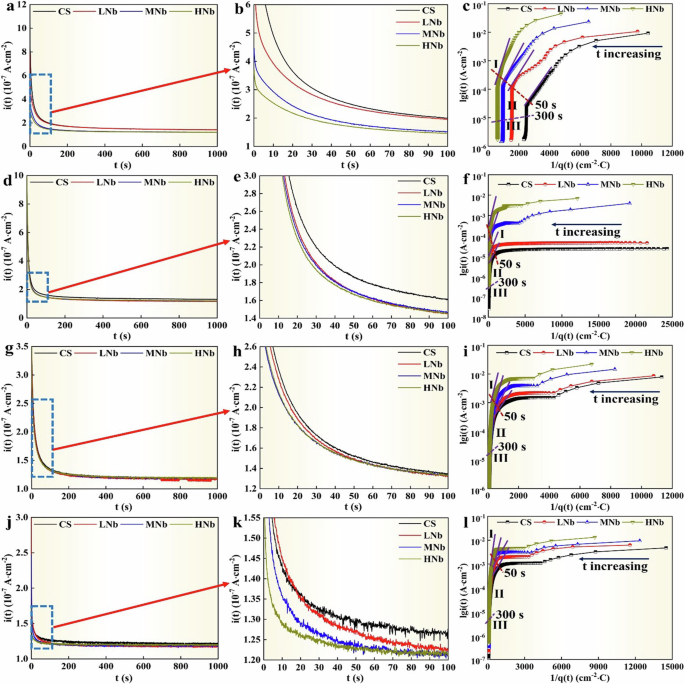
a, d, g, j i-t curve. c, f, i, l lgi(t)-1/q(t) curve. b, e, h, k was the enlarged drawing of blue dotted line frame in (a, d, g, j).
It can be seen from Fig. 7 that after passivation for 10 d in SCPS with different pH, the current density of surface passive film of Nb-containing rebar and CS rebar presented basically the same trend with time, namely, the initial current density on the surface of Nb-containing rebar and CS rebar rapidly decayed to a stable passivation current density, which indicated that the surface passive film of Nb-containing rebar and CS rebar has been basically formed. When the constant potential was 200 mV, after the timing time reached 200 s, the passivation current density on the surface of four rebars remained basically stable, and with the decreases of pH, the stable passivation current density of CS rebar were decreased from 2.00 × 10⁻⁷ A·cm−2 to 1.27 × 10⁻⁷ A·cm−2, the stable passivation current density of LNb rebar were decreased from 1.98 × 10⁻⁷ A·cm−2 to 1.23 × 10⁻⁷ A·cm−2, the stable passivation current density of MNb rebar were decreased from 1.55 × 10⁻⁷ A·cm−2 to 1.22 × 10⁻⁷ A·cm−2, and the stable passivation current density of HNb rebar were decreased from 1.49 × 10⁻⁷ A·cm−2 to 1.21 × 10⁻⁷ A·cm−2. This showed that compared with CS rebar, the stable passivation current density of Nb-containing rebar significantly decreased, resulting in the metal cation on the surface of Nb-containing rebar were decreased from the rebar/film interface to the film/simulated solution interface, and the electrochemical reaction resistance was high, thus the surface passive film of Nb-containing rebar exhibited the higher passivation. At low pH9.0, the passivation current density of surface passive film of HNb rebar decayed more than that of CS rebar, which indicated that the surface passive film of HNb rebar showed the higher passivation.
After passivation for 10 d in SCPS with different pH, the formation conditions of surface passive film of Nb-containing rebar and CS rebar mainly included two reaction processes, the one was the anodic dissolution process, the second was the formation process of the passive film. Burstein et al.56 and Lawless57 pointed out that the total current of metal surface was used to promote the formation of the passive film, and the relationship between the current i(t) and the flux q(t) during the formation of surface passive film of metal was derived by Faraday’s law as follows.
Where, i(t) is the total current of metal surface, q(t) is the total electric quantity of metal surface, A and B are the related constants of the activation energy of the migrating ions in the film, c is the correlation constant of metal, V is the potential drop through the film. The electric quantity q(t) was obtained by integrating the current i(t) with time t.
In the Eq. (12), there is a linear relationship between lgi(t) and q(t), and the slope is K = cBV. Related literature11,18,58 pointed out that the K value represented the passivation rate, the smaller the K value, the faster the passivation rate. The i-t curve was transformed into the lgi(t)-1/q(t) curve by Eqs. (12) and (13), and the results were given in Fig. 7. According to the variation characteristics of lgi(t)-1/q(t) curve, the lgi(t)-1/q(t) curve was divided into three different stages.
The anodic dissolution process control stage (I). In the initial stage, the anodic dissolution rate of Nb-containing rebar and CS rebar was large, and the required time was short (0 ~ 50 s), and there was no obvious linear relationship between lgi(t)-1/q(t) curve in this stage. Due to the passive film did not form on the surface of Nb-containing rebar and CS rebar, the transmission rate of Fe2+ ions and the diffusion rate of dissolved oxygen were accelerated, and the current value on the surface of Nb-containing rebar and CS rebar reached the maximum. In the control stage of anodic dissolution, with the decreases of pH, the current value on the surface of Nb-containing rebar and CS rebar showed a decreasing trend, this indicated that the dissolution trend of rebar matrix decreased, which was attributed to the fact that the decreases of pH led to the decrease of Fe2+ concentration, and the initial passive film was difficult to form on the surface of Nb-containing rebar and CS rebar.
The formation and growth stage of the passive film (II). As the passivation reaction proceeded, the initial passive film was formed on the surface of Nb-containing rebar and CS rebar, which hindered the further transmission of Fe2+ to SCPS, resulting in a rapid attenuation of the current value flowing through the surface of Nb-containing rebar and CS rebar to a minimum and a stable passivation current. The lgi(t)-1/q(t) curve of this stage showed a linear relationship, which indicated that the surface passive film of Nb-containing rebar and CS rebar gradually formed. At 50 s ~ 300 s, when the constant potential was 200 mV, with the decreases of pH, compared with CS rebar, the slope of the linear part of lgi(t)-1/q(t) curve of surface passive film of HNb rebar were increased from 5.96 mC·cm−2 to 8.79 mC·cm−2, which meant that the decreases of pH led to the decrease of the passivation rate on the surface of HNb rebar, this indicated that the formation of surface passive film of HNb rebar reached the saturation, thus hindering the transmission of ions.
The stable stage of the passive film (III). In the later stage, the current value of surface passive film of Nb-containing rebar and CS rebar was reduced to the lowest value, and the lgi(t)-1/q(t) curve at this stage deviated from the linear relationship, this indicated that the surface passive film of Nb-containing rebar and CS rebar increased slowly at the lowest passivation rate, and the thickness of surface passive film of Nb-containing rebar and CS rebar reached a stable value. At low pH, the thickness of surface passive film of HNb rebar was more stable than that of CS rebar (the constant potential was 200 mV), this indicated that a stable passive film was formed on the surface of HNb rebar under the action of low pH9.0.
Phase composition of passive film
The XPS sputtering depth results of surface passive films of HNb rebar and CS rebar after passivation for 10 d in SCPS with pH13.2 and pH9.0 were given in Fig. 8, the binding energy position and band width of each element (Nb element, Fe element, O element) in the surface passive film of HNb rebar and CS rebar were given in Table 3, and the semi-quantitative analysis of XPS sputtering depth were given in Fig. 9.
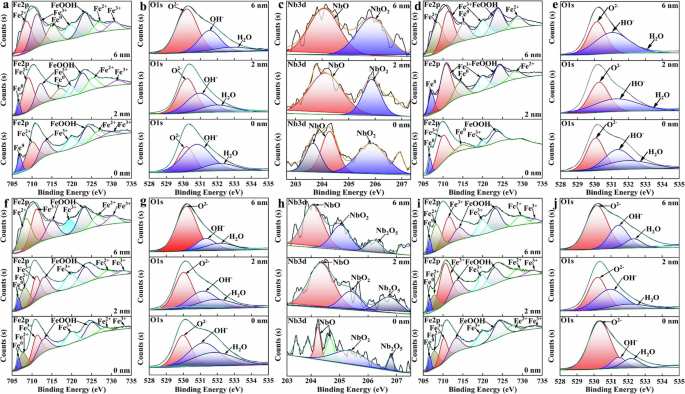
a–e pH13.2. f–j pH9.0. a–c, f–h HNb rebar. d, e, i, j CS rebar. a, f, d, i Fe2p. b, g, e, j O1s. c, h Nb3d.
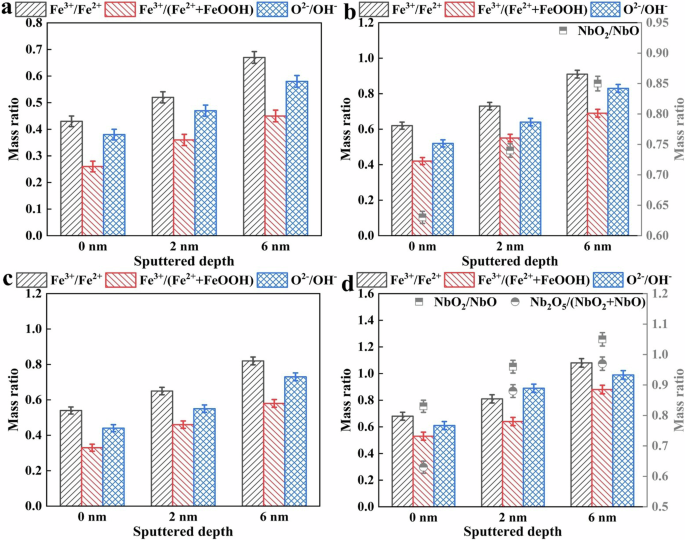
a, b pH13.2. c, d pH9.0. a, c CS rebar. b, d HNb rebar.
It can be seen from Fig. 8a, f, d, i combined with Table 3 that the Fe2p spectra of surface passive films of HNb rebar and CS rebar at different sputtering depths were divided into Fe0 (the binding energy was 706.73 eV18,36,59,60), Fe2+ (the binding energy was 708.13 eV12,13,14,22,24,25,54,59,60), Fe3+ (the binding energy was 710.88 eV12,13,14,24,25,59,60), FeOOH (the binding energy was 713.68 eV24,25,54,59,60). It can be seen from Fig. 8b, g, e, j combined with Table 3 that the O1s spectrum were divided into O2− (the binding energy was 530.33 eV12,13,14,20,25,59,60), OH− (the binding energy was 531.38 eV20,22,24,25,59,60), H2O (the binding energy was 532.53 eV12,13,14,24,25,54,59,60). Combined with the semi-quantitative results in Fig. 9a–d, with the increases of sputtering depth, compared with CS rebar, the Fe3+/Fe2+, Fe3+/(Fe2++FeOOH), O2−/OH− in the surface passive film of HNb rebar at pH13.2 were reached to 0.91, 0.69, 0.83, respectively, while the Fe3+/Fe2+, Fe3+/(Fe2++FeOOH), O2−/OH− in the surface passive film of HNb rebar at pH9.0 were reached to 1.08, 0.88, 0.99, respectively. This indicated that the decreases of pH slowly reduced the degradation of Fe3+ in the surface passive film of HNb rebar, so that the surface passive film of HNb rebar presented a double-layer structure, and the inner layer was mainly composed of stable Fe3+ oxides (such as Fe2O3, Fe3O4, etc.), while the outer layer was mainly composed of Fe2+ oxides (such as FeO, Fe(OH)2, etc.) and hydroxyl oxides (such as FeOOH, etc.).
According to the standard Gibbs free energy theory of metal oxides61,62,63, the formation standard Gibbs free energy of NbO, NbO2, Nb2O5 at 298.15 K were −391.490 kJ·mol−1, −740.923 kJ·mol−1, −1764.585 kJ·mol−1, respectively, and the higher the valence of Nb oxides, the more stable the formation of Nb oxides. It can be seen from Fig. 8c, h combined with Table 3 that at different sputtering depths, only NbO (the binding energy was 204.38 eV28,29,30,31,32,33) and NbO2 (the binding energy was 205.23 eV28,29,30,31,32,33) were detected in the Nb3d spectrum of surface passive film of HNb rebar at pH13.2, while the NbO (the binding energy was 204.38 eV28,29,30,31,32,33), NbO2 (the binding energy was 205.23 eV28,29,30,31,32,33) and Nb2O5 (the binding energy was 206.63 eV28,29,30,31,32,33) were detected in the Nb3d spectrum of surface passive film of HNb rebar at pH9.0, this indicated that the decreases of pH promoted the formation of more stable Nb oxides in the surface passive film of HNb rebar. Combined with the semi-quantitative results in Fig. 9b, d, with the increases of sputtering depth, NbO2/NbO in the surface passive film of HNb rebar were reached to 0.85 at pH 13.2, while NbO2/NbO and Nb2O5/(NbO2+NbO) in the surface passive film of HNb rebar were reached to 1.05 and 0.97 at pH 9.0, respectively, this indicated that the decreases of pH promoted the formation of more Nb oxides in the inner layer of the surface passive film of HNb rebar, which inhibited the selective dissolution of Fe oxides and promoted the compactness and stability of the inner layer of surface passive film of HNb rebar.
Surface morphology of passive film
The AFM morphology of surface passive film of Nb-containing rebar and CS rebar after passivation for 10 d in SCPS with different pH were given in Fig. 10. Figure 10 shows that after passivation for 10 d in SCPS with different pH, the surface of Nb-containing rebar and CS rebar was covered with a layer of nano-particles, and there was a certain roughness on the surface of Nb-containing rebar and CS rebar, this indicated that a passive film has been formed on the surface of Nb-containing rebar and CS rebar. At high pH13.2, a small amount of nano-particles were distributed on the surface of CS rebar, there were some large particles and bulges, and the surface roughness were reached to 15.32 nm. While some dense nano-sized particles were distributed on the surface of Nb-containing rebar, and the surface roughness were decreased from 13.55 nm to 9.42 nm. The above results indicated that a passive film containing loose larger particles was formed on the surface of CS rebar, while a passive film containing dense and fine particles was formed on the surface of Nb-containing rebar.
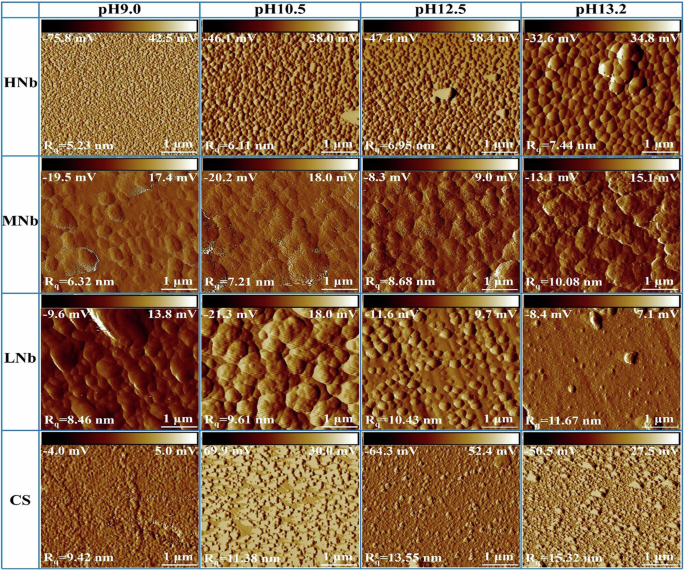
AFM morphology of surface passive film of Nb-containing rebar and CS rebar after passivation for 10 d in SCPS with different pH.
With the decreases of pH, compared with CS rebar, the surface of Nb-containing rebar was distributed with fine and dense nano-sized particles, the surface passive film was smooth and flat, and the surface roughness were significantly reduced from 11.67 nm to 5.23 nm, this indicated that the decreases of pH promoted the formation of a dense passive film on the surface of Nb-containing rebar, thus enhancing the corrosion resistance of Nb-containing rebar, which was consistent with the results of EIS, CPP, i-t. Previous studies14,50,54,64 pointed out that with the decreases of pH, the fine and dense oxide particles were distributed on the surface of micro-alloyed steel, and these oxide particles promoted the formation of dense passive film and improved the stability of the passive film. At low pH9.0, with the increases of Nb, the roughness of surface passive film of HNb rebar was about 2 times lower than that of CS rebar, and the surface of HNb rebar was covered with a layer of dense and fine nano-sized particles, this indicated that the surface passive film of HNb rebar has been reached the stable and dense.
Structure of passive film
The cross-section TEM morphology of surface passive film of Nb-containing rebar and CS rebar after passivation for 10 d in SCPS with different pH were given in Fig. 11, and the cross-section phase composition and selected area electron diffraction (SAED) images of surface passive film of Nb-containing rebar and CS rebar after passivation for 10 d in SCPS with pH13.2 and pH9.0 were given in Fig. 12.
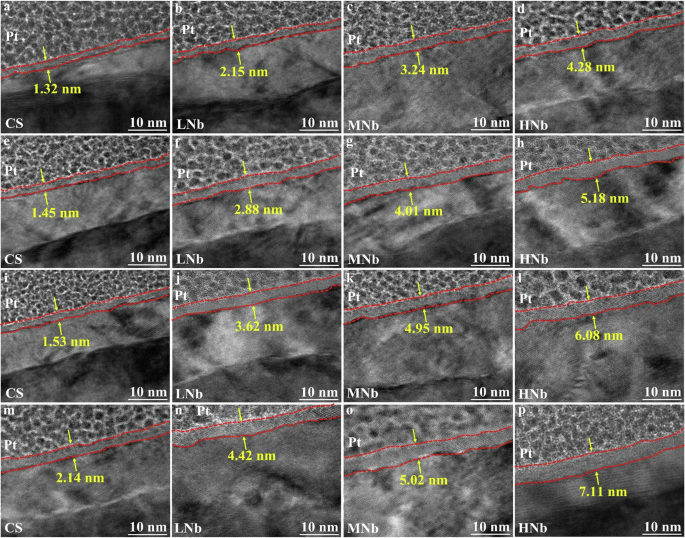
a–d pH13.2. e–h pH12.5. i–l pH10.5. m–p pH9.0. (a, e, i, m CS. b, f, j, n LNb. c, g, k, o MNb. d, h, l, p HNb).
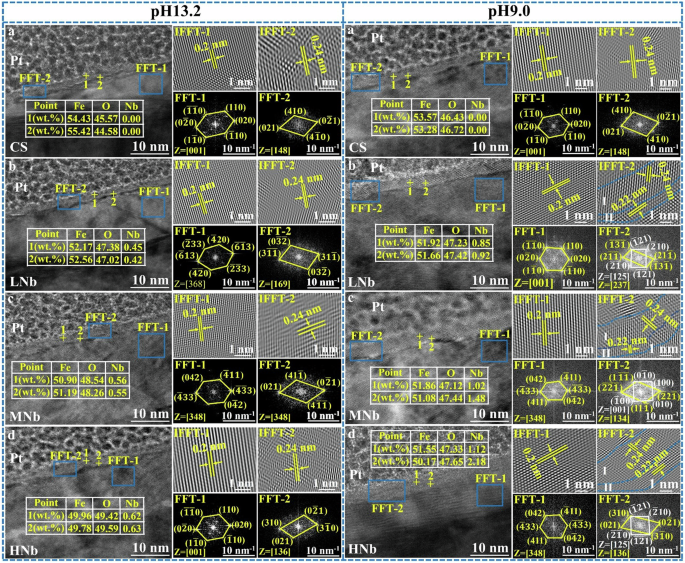
a CS rebar. b LNb rebar. c MNb rebar. d HNb rebar.
Figure 11 shows that after passivation for 10 d in SCPS with different pH, there was a nano-scale passivation layer between the rebar substrate and the Pt binder, and the distribution of the passive film was uneven and strip-shaped, this was attributed to the fact that the formation process of the passive film mainly depended on the morphology and structure of the rebar surface, and the thickness of the passive film at different positions was inconsistent. Figure 11 also shows that the thickness of surface passive film of Nb-containing rebar and CS rebar was approximately within 10 nm after passivation for 10 d in SCPS with different pH, which was consistent with the previous results64,65. With the decreases of pH, the thickness of surface passive film of CS rebar were increased from 1.32 nm to 2.14 nm, the thickness of surface passive film of LNb rebar were increased from 2.15 nm to 4.42 nm, the thickness of surface passive film of MNb rebar were increased from 3.24 nm to 5.02 nm, and the thickness of surface passive film of HNb rebar were increased from 4.28 nm to 7.11 nm. Compared with CS rebar, the decreases of pH and the increases of Nb promoted the significant thickening of surface passive film of Nb-containing rebar. At low pH9.0, with the increases of Nb, the thickness of surface passive film of HNb rebar was about 3.5 times that of CS rebar, which indicated that the increases of Nb promoted the thickening of surface passive film of HNb rebar, thus enhancing the stability and compactness of surface passive film of HNb rebar.
The EDS in Fig. 12a–d shows that at high pH13.2, with the change from the outer layer to the inner layer in the passive film, the content of Fe element slowly increased and the content of O element slowly decreased, resulting in the higher Fe/O ratio in the inner layer and the lower Fe/O ratio in the outer layer. At low pH 9.0, with the change from the outer layer to the inner layer in the passive film, the content of Fe element slowly decreased and the content of O element slowly increased, resulting in the decrease of Fe/O ratio in the inner layer and the increase of Fe/O ratio in the outer layer. The above results indicated that the decreases of pH promoted the distribution of stable Fe oxides in the inner layer of the passive film, and the outer layer were mainly distributed with Fe oxides and Fe hydroxyl oxides, this indicated that the inner layer of surface passive film of the rebar were more stable than that the outer layer. Compared with CS rebar, with the decreases of pH and the increases of Nb, the distribution of Nb in the inner layer of surface passive film of Nb-containing rebar was more obvious than that in the outer layer, which indicated that at low pH9.0, the enrichment of Nb promoted the distribution of more stable Nb oxides on the surface of Nb-containing rebar, thus inhibiting the dissolution of Fe oxides and improving the stability of surface passive film of Nb-containing rebar.
It can be seen from Fig. 12a–d that FFT-1 and FFT-2 were the SAED images of the rebar matrix near the passive film and the SAED images of the passive film, respectively. The SAED images of the rebar matrix showed a point arrangement in a certain direction, the crystal structure was the body-centered cubic, and the crystal plane spacing was 0.2 nm, this indicated that the rebar matrix was a complete crystal structure. For the SAED images of the passive film, the surface passive film of the rebar presented the multiple crystal orientations, the crystal structure showed a cubic crystal system, and the crystal plane spacing was 0.24 nm, this indicated that the passive film was a polycrystalline structure of Fe oxides.
At low pH9.0, compared with CS rebar, with the increases of Nb, the surface passive film of Nb-containing rebar also presented another polycrystalline oxide, the crystal structure was also cubic crystal system, and the crystal plane spacing was 0.22 nm, this indicated that this polycrystalline oxide was Nb oxides, which were mainly distributed in the inner layer of the passive film, which was consistent with the previous results28,29,30,31,32,33. The surface passive film of Nb-containing rebar was mainly divided into two layers. The outer layer (I) was mainly composed of polycrystalline Fe oxides, and the inner layer (II) was mainly composed of polycrystalline Fe oxides and Nb oxides. With the increases of Nb, the inner layer of surface passive film of Nb-containing rebar gradually thickened. At low pH9.0, compared with CS rebar, the increases of Nb promoted the formation of more polycrystalline Fe oxides and Nb oxides on the surface of HNb rebar, thus enhancing the stability of surface passive film of HNb rebar.
Discussion
In simulated concrete pore solution, a protective passive film was formed on the surface of micro-alloyed rebar, and the structure and composition of the passive film had an important influence on the corrosion resistance of micro-alloyed rebar4,5,6,11,12,13,14,15. With the change of pH in simulated concrete pore solution, the surface passive film of micro-alloyed rebar changed significantly, and the composition of the passive film may be affected by the composition of microalloying elements and solution components. Previous studies11,12,13,14,17,18,23,24,25 indicated that the microalloying elements (such as Nb, Cr, etc.) were beneficial to promote the formation of surface passive film of micro-alloyed rebar in simulated concrete pore solutions. Therefore, it is necessary to study the formation process of surface passive film of micro-alloyed rebar.
According to the i-t curve and lgi(t)-1/q(t) curve analysis of surface passive film of Nb-containing rebar and CS rebar after passivation for 10 d in SCPS with different pH, the contribution current required for the formation of surface passive film of Nb-containing rebar and CS rebar was mainly divided into the current value of the anodic dissolution stage (idiss) and the current value of the passive film formation (ifilm). Therefore, Beck et al.66, Xu et al.58 and Buhl et al.67 pointed out that the total current of the formation process of the passive film on the surface of metal materials was composed of idiss and ifilm.
Where, ibare is the current value flowing through the metal surface, which is the maximum current value (imax) of the i-t curve, A is the constant, b is the empirical value, and Ɵ is the coverage coefficient. The Ɵ value was calculated by Avrami phase transition kinetic equation68.
Where, k is the related constant of the oxide nucleation rate, n is the morphology index, which is related to the formation dimension of the oxide film, and the value of n is an integer between 1/2 and 7/2. Buhl et al.67 assumed that after the formation of surface passive film of metal, the passive film preferentially spread to the two-dimensional plane, and the entire metal surface was covered by the passive film layer, and the passive film gradually thickened in the thickness direction, thus the value of n in the Eq. (15) was 1. The total current required for the formation of surface passive film of Nb-containing rebar and CS rebar was obtained by substituting Eq. (15) into Eq. (14).
The Eq. (16) was used to fit the i-t curve in Fig. 7. In order to improve the fitting accuracy, the i-t curve of 0 ~ 100 s was selected for fitting, and the best fitting parameters k, A, b was obtained. The variation of idiss, ifilm, Ɵ with t was calculated by substituting the k, A, b into Eq. (16) (the constant potential was 200 mV), and the results were given in Fig. 13.
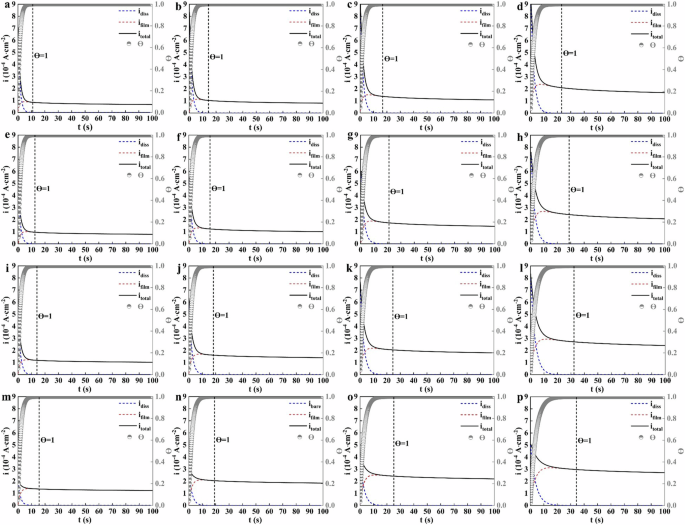
a–d pH13.2. e–h pH12.5. i–l pH13.2. m–p pH13.2. (a, e, i, m CS rebar. b, f, j, n LNb rebar. c, g, k, o MNb rebar. d, h, l, p HNb rebar).
Figure 13 shows that after passivation for 10 d in SCPS with different pH, the surface of Nb-containing rebar and CS rebar showed the anodic dissolution before Ɵ = 1, and the current at this stage mainly contributed to the large dissolution of the rebar matrix. As the passivation process progressed, the idiss value on the surface of Nb-containing rebar and CS rebar rapidly decayed to 0 (when Ɵ reached 1), the surface of Nb-containing rebar and CS rebar was completely covered by a layer of oxide film, and this layer of oxide film gradually grew and thickened on the surface of Nb-containing rebar and CS rebar. With the decreases of pH, the idiss value on the surface of Nb-containing rebar and CS rebar increased significantly, and the ifilm value of oxide film also increased significantly, this indicated that the decreases of pH led to the increases of the dissolution rate of the rebar matrix, and a large number of Fe2+ ions were released into SCPS to participate in the formation of oxide film. At low pH9.0, compared with CS rebar, the idiss value and ifilm value on the surface of HNb rebar increased significantly, this indicated that a large number of Fe2+ ions were formed on the surface of HNb rebar to participate in the formation of oxides, so that the surface passive film of HNb rebar gradually formed a large number of stable Fe oxides.
Figure 13 also shows that when the pH value of SCPS were decreased from 13.2 to 9.0, compared with CS rebar, with the increases of Nb, the formation time of oxide film on the surface of HNb rebar were increased from 23.1 s to 34.2 s, this indicated that the nucleation rate of oxide film on the surface of HNb rebar became slower, and the increases of Nb promoted the thickness of surface passive film of HNb rebar to reach a certain saturation and slowly thickened. Previous studies11,18,20 also reported that with the decreases of pH, the idiss value and ifilm value on the surface of Cr-containing rebar increased significantly, resulting in the formation of stable Fe oxides, which retarded the nucleation time of oxides on the surface of Cr-containing rebar, thus the thickness of the passive film gradually thickened.
In the thickening stage of the passive film, the ifilm value was basically used to complete the nucleation and growth of oxide. In order to obtain the variation of the thickness of surface passive film of Nb-containing rebar and CS rebar with time, it is necessary to integrate the ifilm within 0 ~ 100 s, and the quantity of electric charge (qfilm(t)) consumed by the oxide film formation were calculated, and the thickness of surface passive film of Nb-containing rebar and CS rebar was calculated by Faraday’s law formula69.
Where, M is the molar mass of Fe (M = 56 g·mol−1), z is the charge number of Fe2+ (z = 2), ρ is the density of Fe (ρ = 7.86 g·mol−3), and F is the Faraday constant (F = 96485.34 C·mol−1). The thickness of surface passive film of Nb-containing rebar and CS rebar after passivation for 10 d in SCPS with different pH values was calculated by Eqs. (17) and (18), and the variation of the thickness of surface passive film of Nb-containing rebar and CS rebar with time (the d-t curve) were given in Fig. 14.
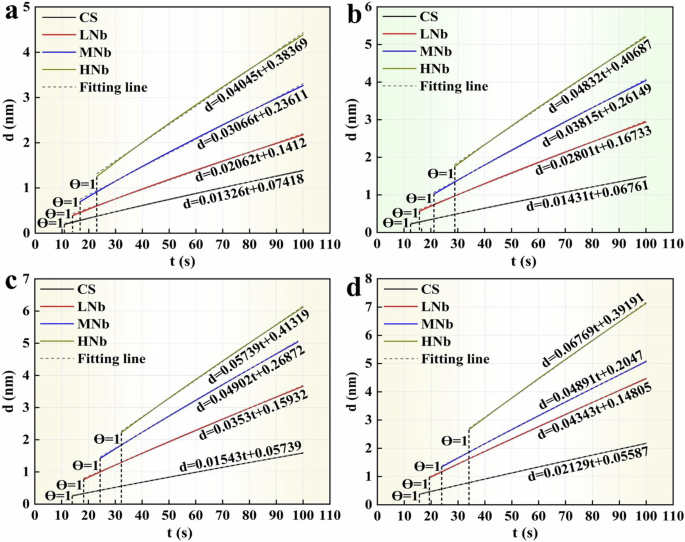
a pH13.2. b pH12.5. c pH10.5. d pH9.0.
Figure 14a–d shows that when the pH value of SCPS were decreased from 13.2 to 9.0, compared with CS rebar, with the increases of Nb, the thickness of the initial passive film on the surface of HNb rebar were increased from 1.26 nm to 2.67 nm. This indicated that the decreases of pH led to more film-forming current on the surface of HNb rebar, which were mainly contributed to complete the formation and growth of the passive film, thus forming a thicker initial passive film on the surface of HNb rebar. Previous studies11,18,20,69 also reported that the slope of d-t curve represented the growth rate of surface passive film of micro-alloyed steel. With the decreases of pH and the increases of Nb, compared with CS rebar, the slope of d-t curve of surface passive film of HNb rebar increased slowly, this indicated that the decreases of pH promoted the gradual thickening of surface passive film of HNb rebar.
When the overall thickness of the passive film reached stable, compared with CS rebar, with the decreases of pH and the increases of Nb, the overall thickness of surface passive film of HNb rebar were increased from 4.38 nm to 7.13 nm, this indicated that at low pH9.0, the increases of Nb promoted the overall thickness of surface passive film of HNb rebar to be thicker and more stable, which had a certain regularity with the results of TEM. Ai et al.11 also found that at low pH9.0, the initial passive film of Cr-containing rebar had a larger overall thickness, this indicated that the decreases of pH led to the obvious enrichment of Cr, which thickened the surface passive film of Cr-containing rebar. Zhang et al.18,20 also indicated that with the decreases of pH, the surface passive film of Cr-containing rebar was stable and dense than that of CS rebar. Previous studies21,22,23,24,25 showed that the addition of Cr was beneficial to enhance the stability and compactness of surface passive film of micro-alloyed rebar, which was attributed to the fact that the formation of Cr oxides inhibited the degradation of surface passive film of micro-alloyed rebar. Liu et al.31,32 found that the addition of Nb was beneficial to promote the formation of surface passive film of micro-alloyed rebar, and the enrichment of Nb in the passive film enhanced the corrosion resistance of micro-alloyed rebar. The above results showed that during the passivation reaction, with the decreases of pH, the increases of Nb promoted the formation of more stable Fe oxides and Nb oxides on the surface of Nb-containing rebar, which enhanced the stability and compactness of the passive film, thereby enhancing the passivation efficiency of Nb-containing rebar.
Based on the analysis of the formation process of surface passive film of Nb-containing rebar and CS rebar in SCPS with different pH, the formation mechanism of surface passive film of Nb-containing rebar and CS rebar was divided into three stages, and the passivation reaction mechanism were given in Fig. 15.
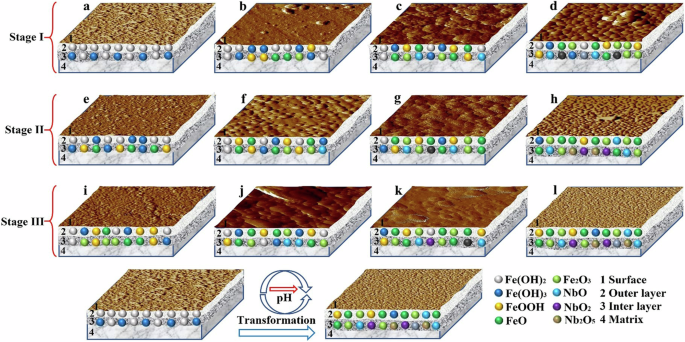
a, e, i CS rebar. b, f, j LNb rebar. c, g, k MNb rebar. d, h, l HNb rebar.
It can be seen from Fig. 15 that the formation process of surface passive film of Nb-containing rebar and CS rebar was mainly divided into three stages: the first stage was the initial process of the passive film, the second stage was the growth and thickening process of the passive film, and the third stage was the stable process of the passive film. During the initial formation of the passive film (Stage I) (see in Fig. 15a–d), the initial passivation reaction occurred between the rebar surface and the SCPS, and the rebar matrix was dissolved to form Fe2+ (see Eq. (1))14,18,20. When the Fe2+ ion was continuously accumulated in SCPS, an initial product film FeO and Fe(OH)2 (see Eq. (1)) was formed on the surface of Nb-containing rebar and CS rebar, the Fe(OH)2 was further oxidized to Fe(OH)3 and Fe3O4 (see Eqs. (19) and (20)) under the action of dissolved oxygen, and the Fe(OH)3 was further decomposed into FeOOH and Fe2O3 (see Eqs. (21) and (22)), in which, the Fe3O4 was oxidized to Fe2O3 (see Eq. (23))14,18,20,24,55.
Compared with CS rebar, with the increases of Nb, the initial passive film on the surface of Nb-containing rebar formed the Nb oxides (see Eq. (24)), and the presence of these Nb oxides participated in the initial formation process of the passive film28,29,31,32,34. Figure 15a–d shows that with the decreases of pH, compared with CS rebar, the increases of Nb led to the enrichment of the initial Nb oxides in the initial passive film of Nb-containing rebar, and these Nb oxides had the high stability, which reduced the activity of stable Fe oxides and increased the passivation rate of Nb-containing rebar.
During the growth and thickening of the passive film (Stage II) (see in Fig. 15e–h), the growth and thickening of surface passive film of Nb-containing rebar and CS rebar simultaneously carried out, so that the entire surface of Nb-containing rebar and CS rebar was covered with an initial passive film, and the initial passive film gradually thickened in the thickness direction, thus the film-forming current was all used for the growth of the passive film, resulting in a weakening of the anodic dissolution process of the matrix and an enhancement of the growth process of the passive film11,18,20. In SCPS with different pH, the thickening rate of surface passive film of Nb-containing rebar was significantly higher than that of CS rebar. With the decreases of pH, compared with CS rebar, the increases of Nb led to the enrichment of more stable Nb oxides in the inner layer of surface passive film of Nb-containing rebar, and these oxides enhanced the self-healing ability of the passive film, which increased the thickening rate of the passive film, hindered the migration of Fe2+ ion, and enhanced the stability of the passive film29,30,31,32.
During the stable process of the passive film (Stage III) (see in Fig. 15i–l), the surface passive film of Nb-containing rebar and CS rebar gradually stabilized and the thickness reached the saturation. However, the stability of surface passive film of Nb-containing rebar and CS rebar was greatly affected by pH change. For the CS rebar, with the decreases of pH, the carbonization of SCPS was more serious, and the stable Fe oxides and Fe hydroxyl oxides in the surface passive film of CS rebar were gradually degraded, thus reducing the surface passivation rate of CS rebar14,18,20,24. However, the passivation rate of Nb-containing rebar increased with the decreases of pH, and a stable and dense passive film was formed on the surface of Nb-containing rebar. This indicated that the decreases of pH were beneficial to promote the formation of Nb oxides in the surface passive film of Nb-containing rebar, and these Nb oxides enhanced the self-healing ability of the passive film, thus inhibiting the dissolution of the stable Fe oxides and enhancing the corrosion resistance of Nb-containing rebar28,30,31,32.
The formation mechanism of the passive film confirmed that the increases of Nb played a beneficial role in the formation of surface passive film of Nb-containing rebar. Firstly, with the increases of Nb, the decrease of pH was beneficial to promote the formation of Nb oxides in the surface passive film of Nb-containing rebar, and these Nb oxides enhanced the repair ability of the passive film, thus increasing the passivation rate of the passive film and thickening the surface passive film of Nb-containing rebar. Secondly, with the decreases of pH, the increases of Nb promoted the significant enrichment of Nb oxides in the inner layer of surface passive film of Nb-containing rebar, thus inhibiting the degradation of the stable Fe oxides and enhancing the stability of the passive film. Therefore, the special role of Nb in the surface passivation layer of micro-alloyed high-strength anti-seismic rebar provides a new idea for the long-term service and durability of micro-alloyed high-strength anti-seismic rebar in concrete structures.
Methods
Experimental materials
In this study, the raw materials were ordinary carbon steel rebar (named CS rebar), while the micro-alloyed high-strength anti-seismic rebar (named Nb-containing rebar) were prepared on the basis of ordinary carbon steel rebar. According to the new national standard GB/T 1499.2―2018, three groups of high-strength anti-seismic rebar with different Nb contents were designed, which were labeled as low Nb rebar (named LNb), medium Nb rebar (named MNb), and high Nb rebar (named HNb), respectively. The steel ingots of Nb-containing rebar and CS rebar were melted by vacuum induction melting furnace, and the alloy material was the ferroniobium alloy (the grade of ferroniobium alloy was Nb66.78Fe33.22 alloy). The final samples of Nb-containing rebar and CS rebar (diameter (100 mm) × height (50 mm)) were formed by controlled rolling and controlled cooling, starting with heat at 1100 °C for 2 h, then rolled at different temperatures (1000 °C, 950 °C, 900 °C), and finally controlled cooling at 800 °C ~ 600 °C70,71. The chemical composition of Nb-containing rebar and CS rebar were determined by inductively coupled plasma atomic emission spectrometry (ICP-AE/CE), carbon sulfur analyzer (CS840) and nitrogen hydrogen oxygen analyzer (NHO445), and the results of chemical composition were given in Table 4.
The calculation formula of carbon equivalent (Ceq) was as follows2.
The microstructure morphology and mechanical properties of four rebars were given in Fig. 16 and Table 5.

a CS rebar. b LNb rebar. c MNb rebar. d HNb. The white dotted line frame was the polygonal ferrite (PF). The red dotted line frame was the lamellar pearlite (LP). The yellow dotted line frame was the enlarged drawing of lamellar pearlite.
It can be seen from Fig. 16 that the microstructure of four rebars was mainly composed of ferrite and pearlite, the morphologies of ferrite were the polygonal structure, and the morphologies of pearlite were the lamellar structure. Compared with CS rebar, with the increases of Nb content, the ferrite grain sizes of LNb rebar, MNb rebar and HNb rebar were refined to 11.12 μm, 9.22 μm and 7.38 μm, respectively, and the pearlite lamellar spacings were refined to 0.26 μm, 0.24 μm and 0.21 μm, respectively. This indicated that the addition of Nb played a role in refining the grains, and the grain size of HNb rebar reached 11 grades. It can be seen from Table 5 that compared with CS rebar, with the increases of Nb content, the tensile strength and yield strength of HNb rebar were reached to 757.07 MPa and 573.54 MPa, respectively, and the strength-yield ratio and elongation after fracture were reached to 1.32 and 24.69%, respectively. This indicated that the addition of Nb led to a significant improvement in the strength and plasticity of Nb-containing rebar.
The sample sizes of Nb-containing rebar and CS rebar were processed into a length (20 mm) × width (20 mm) × thickness (20 mm) (for AFM test) and length (5 mm) × width (5 mm) × thickness (3 mm) (for XPS test) by wire cutting. These rebar samples were exposed the working surface and the rest of surface was completely sealed with epoxy resin. The exposed surface of the rebar samples were rough grinding and fine grinding using different types of metallographic sandpaper (200 mesh~2000 mesh), then polished using the diamond polishing agent (the particle size of 0.5 μm and 1.5 μm) on the PI-1A metallographic sample polishing machine. Finally, the ethanol + ultrasonic vibration was used to shake and clear the surface of the rebar samples for subsequent immersion test and characterization.
Simulated concrete porous solution
The passivation process of high-strength anti-seismic rebar under the conditions of concrete environment was affected by many factors, and these factors mainly included the mineral composition, temperature, humidity, oxygen content, etc., in which the mineral composition of concrete was the most important factor72,73,74. Due to the complex changes of these factors, the passivation process of high-strength anti-seismic rebar was difficult to achieve the real condition, thus the simulated concrete pore solution (SCPS) was used to simulate the alkaline environment of concrete, which greatly reduced the experimental conditions to avoid the influence of these factors. Therefore, the use of SCPS to study the surface passivation process of micro-alloyed rebar has been considered to use a wide range of test methods75,76,77.
The SCPS components were mainly divided into two categories17,18,19,75,78,79,80: the first was the saturated calcium hydroxide (Ca(OH)2) solution to simulate high alkaline solution; the second was to add a certain amount of potassium hydroxide (KOH) and sodium hydroxide (NaOH) in the saturated calcium hydroxide (Ca(OH)2) solution, so as to simulate the real alkaline environment of concrete. In this study, the second SCPS was selected to simulate the highly alkaline solution, and the main component of SCPS was composed of 0.03 mol·L−1 calcium hydroxide (Ca(OH)2) + 0.3 mol·L−1 potassium hydroxide (KOH) + 0.15 mol·L−1 sodium hydroxide (NaOH). At the same time, the different contents of sodium bicarbonate (NaHCO3) powder were added to the high alkaline solution, and the pH values were adjusted to 12.5, 10.5, 9.0 respectively, which simulated the carbonization process of SCPS. The SCPS components with different pH were given in Table 6. The reagents used to simulate SCPS with different pH were analytically pure (purity up to 99%), and the solvent was the deionized water with a resistivity of 18.2 MΩ·cm processed by the Millipore-Direct-Q system. The pH value of SCPS was measured and corrected every 24 h. Previous studies18,19,20,23,24,25 pointed out that the passive film of micro-alloyed rebar in SCPS was stable for about 10 d. Therefore, the SCPS at each pH was used as the soaking test group, and the soaking test time of each group was set to 10 d to study the formation process of surface passive film of Nb-containing rebar and CS rebar. Three parallel tests were taken under the condition of different pH in each group to ensure the accuracy of test results.
Electrochemical tests
The electrochemical sample sizes of Nb-containing rebar and CS rebar were processed into a length (10 mm) × width (10 mm) × thickness (10 mm) by wire cutting. The surface of Nb-containing rebar and CS rebar was welded with nickel sheet by spot welding machine as working wire, and the opposite surface of the connecting wire was retained as the working surface, and the rest of surface was sealed with epoxy resin. The different types (200 mesh~3000 mesh) of metallographic sandpaper were used to coarsely and finely grind the working surface of Nb-containing rebar and CS rebar, then polished by the diamond polishing agent (the particle size of 0.5 μm and 1.5 μm) on the PI-1A metallographic sample polishing machine. Finally, the ethanol was used to clean the working surface of Nb-containing rebar and CS rebar in ultrasonic wave for electrochemical test.
All electrochemical tests of Nb-containing rebar and CS rebar were performed on a CHI760E electrochemical workstation with a classic three-electrode system, in which, the Nb-containing rebar and CS rebar were used as working electrodes, the platinum sheets were used as auxiliary electrodes, and the saturated calomel was used as reference electrode. The test solution was SCPS with different pH. All Nb-containing rebar and CS rebar were passivated in SCPS for 10 d. Firstly, the open circuit potential (OCP) test was performed for 1800 s. After the OCP was stabilized, the corrosion resistance of surface passive film of Nb-containing rebar and CS rebar was tested using the electrochemical impedance spectroscopy (EIS), the test frequency range was 10−2 ~ 105 Hz, and the amplitude was 10 mV, and the EIS results were fitted using ZView software. Secondly, the reaction peak of surface passive film of Nb-containing rebar and CS rebar was tested using the cyclic voltammetry (CV), the test voltage range was −1.1 V ~ 0.85 V, the scanning rate was 0.006 V/s, the scanning direction was forward scanning, and the scanning cycle was five cycles. The semiconductor properties of surface passive film of Nb-containing rebar and CS rebar was tested using the Mott-Schottky (M-S), the test voltage range was −1.6 V ~ 1.6 V, the amplitude was 10 mV, and the fixed frequency was 1000 Hz. The formation process of surface passive film of Nb-containing rebar and CS rebar was tested using the constant potential current transient (i-t), and the constant potential current transient scanning was carried out for 1000 s under the conditions of film forming potential. Finally, the passivation reaction process of surface passive film of Nb-containing rebar and CS rebar was tested using the dynamic potential polarization (DPP), the test voltage range was −0.5 V ~ 0.8 V, and the scanning rate was 0.5 mV/s. All electrochemical tests were performed at room temperature (25 ± 1 °C), and three parallel tests were taken for each group to ensure the accuracy of test results.
Characterizations
All samples were taken out after the passivation 10 d in SCPS, rinsed with distilled water, dried and stored in vacuum drying oven for XPS test. Thermo Kalpha X-ray photoelectron spectroscopy (XPS) was used to characterize the phase composition and element valence of surface passive film of Nb-containing rebar and CS rebar, and carrying out the deep etching of 2 nm and 6 nm to characterize the phase composition of surface passive film of Nb-containing rebar and CS rebar. Based on the binding energy of C peak (248.8 eV), all XPS results were fitted by Avantage software.
After passivation 10 d in SCPS, the structure and surface defects of surface passive film of Nb-containing rebar and CS rebar were characterized by Bruker Dimension ICON atomic force microscope (AFM). For the morphology test of surface passive film of Nb-containing rebar and CS rebar, AFM was used to repeatedly test the surface passive film morphology of three groups of parallel rebar samples under the conditions of different pH for three times, so as to ensure the accuracy and consistency of surface passive film morphology of the rebar samples. For the roughness test of surface passive film of Nb-containing rebar and CS rebar, NanoScope Analysis software was used to repeatedly measure the roughness of surface passive film for five times, and obtaining the average value, so as to ensure the accuracy and readability of surface passive film roughness of the rebar samples. The scanning size was 10 μm, the scanning frequency was 0.999 Hz, the scanning rate was 256 mV/s, the resolution was 0.1 nm. All AFM data were analyzed by NanoScope image analysis software.
After passivation for 10 d in SCPS, the passive film zone was prepared by focused ion beam (FIB). Firstly, the position of surface passive film of the rebar was found by SEM, and the matrix on both sides before and after the passive film was hollowed out, leaving the slice region of the passive film. Secondly, the slice region of the passive film was removed by a mechanical nanomanipulator, and performed the ion beam thinning, making the thickness was reduced to the ideal thickness. Finally, the slice region of the passive film was welded to the sample column on the copper mesh, and the sample position was marked. FEI Tecnai TF30 high-resolution transmission electron microscopy (TEM) was used to characterize the crystal structure and cross-sectional thickness of the passive film, which further studied the high-resolution phase, crystal structure, element distribution and selected area electron diffraction of surface passive film of Nb-containing rebar and CS rebar. For the measurement of the cross-section thickness of surface passive film of Nb-containing rebar and CS rebar under the conditions of different pH, the Digital Micrograph software was used to repeatedly measure the cross-section thickness of the passive film for five times, and obtaining an average value, so as to ensure the accuracy and consistency of the cross-section thickness of surface passive film of Nb-containing rebar and CS rebar.
For the phase existence of surface passivation process of Nb-containing rebar and CS rebar under the conditions of different pH, the E-pH diagrams of Fe-H2O system and Nb-H2O system were calculated by using the E-pH calculation module of Factsage (version 7.2) thermodynamic software, and these calculations were carried out at 298.15 K.


Responses