Efficacy and tolerability of neoadjuvant therapy with Talimogene laherparepvec in cutaneous basal cell carcinoma: a phase II trial (NeoBCC trial)
Main
Cutaneous basal cell carcinoma (BCC) is the most common cancer worldwide with incidence rates ranging from 24–430 per 100 000 in Europe1,2, >1,000 per 100,000 in Australia and 1 per 100,000 in Africa3. The incidence has doubled over the last two decades and is expected to increase further4,5. Surgical excision is the treatment of choice for the majority of BCCs6 with a 5–15% risk of recurrence7,8. Depending on the localization and size of the BCC, plastic reconstructive surgery like skin flaps or grafts can be required for wound closure, which may potentially complicate the detection of early local recurrence8,9 and lead to suboptimal cosmetic outcome and functional impairment, thus negatively impacting the patient’s well-being and quality of life10.
In difficult-to-resect and locally advanced BCCs (laBCCs), neoadjuvant treatment strategies aim to reduce post-surgical morbidity, increasing the likelihood of curative resection and reducing the risk of recurrence. Neoadjuvant treatment with Hedgehog inhibitors (HHIs), targeting PTCH-1 mutations, the most commonly found mutation in BCCs, showed an overall response rate (ORR) of 71% according to the immune-based Response Evaluation Criteria in Solid Tumors (iRECIST)11; however, the adverse event (AE) profile of HHIs, including dysgeusia, hair loss, muscle cramps and fatigue, often results in low compliance and premature discontinuation12. We hypothesized that oncolytic viruses (OVs), an innovative class of intratumoral immunotherapeutics, might be an effective and safe neoadjuvant treatment strategy for difficult-to-resect BCCs because (1) BCCs mainly grow locally on the skin and are easily accessible for intralesional injections; (2) BCCs carry a high tumor mutational burden and abundant tumor neoantigens13; and (3) BCCs have an immunosuppressive tumor microenvironment (TME) rich in regulatory T (Treg) cells 14, which could be targeted by OVs. The OV talimogene laherparepvec (T-VEC) is a genetically engineered herpes simplex virus (HSV) 1 and is approved in Europe and the United States for the treatment of unresectable, injectable lesions of stage IIIB-IVM1a melanoma15. T-VEC’s dual mode of action is based on deletion of the infected cell protein 34.5, which is proposed to induce preferential replication in and lysis of tumor cells with a deficient interferon (IFN) pathway. Concomitantly, insertion of the gene encoding the human granulocyte–macrophage colony-stimulating factor (hGM-CSF) leads to a systemic immune response16. Moreover, T-VEC has been shown to alter the TME by activating innate and adaptive immunity through increasing CD8+ T cell and natural killer (NK) cell numbers17,18, while decreasing Treg cells19. In addition, increased plasma cell counts after T-VEC treatment in melanoma were reported20. B and plasma cells make up a large part of the immune cell compartment in the TME of different tumor entities; however, the precise role of the humoral and cellular immune response to T-VEC therapy has not been fully elucidated.
Here, we report the results of a single-arm, phase II, neoadjuvant two-stage clinical trial of T-VEC in cutaneous BCCs (EudraCT no. 2018-002165-19), which was preliminarily stopped for early success after the first stage. The study showed that T-VEC treatment in BCCs (1) was effective and well tolerated; (2) significantly altered the immune cell composition and intratumoral immune cell infiltration; and (3) elucidated the involvement of hyper-expanded, cytotoxic T cell and IGHG1 plasma cell clones in the T-VEC-mediated immune response.
Results
Patient baseline characteristics
Between January 2020 and January 2022, a total of 18 patients (11 (61.1%) female and 7 (38.9%) male) with a median age of 74 years (range 49–92 years) were enrolled and assigned to neoadjuvant treatment with T-VEC (Fig. 1a,b). Inclusion required the presence of a difficult-to-resect BCC, defined as surgical necessity for either a skin flap or skin transplant for wound closure. All 18 patients were included for the final efficacy analysis (Fig. 1b). Detailed patient baseline and tumor characteristics are listed in Table 1 and Supplementary Table 1. T-VEC treatment was prematurely discontinued at one patient’s request, because of a grade 2 AE of fever, who underwent surgery with a local skin flap, after receiving only two cycles of T-VEC. One patient was lost to follow-up after receiving six cycles of neoadjuvant T-VEC treatment, but before undergoing surgery. As this patient did not achieve a clinical response, allowing excision with primary wound closure, he was included for efficacy, but excluded for the recurrence analysis. The data cutoff was 31 December 2022. The median follow-up period, between the first administration of T-VEC and the data cutoff, was 24 months (range 12–36 months).

a, Illustrated study scheme and treatment schedule. Biomarker analysis was performed with mIF pre- and post-treatment, scRNA-seq and scTCR-seq and scBCR-seq post-treatment. Image was created in BioRender. b, Flowchart of the NeoBCC trial. In total, 18 patients started therapy and were included for the final analysis of the study. One patient requested premature termination of the study treatment due to a grade 2 AE. c, Patient response after six cycles of T-VEC administration was split into surgical outcome (with or without (w/o) skin flap/graft). d, Clinical response defined according to the WHO response criteria (CR, PR and SD). e, Pathological response classified in pCR and non-pCR. f, Exemplary clinical and dermoscopic images of two BCCs, pre- and post-treatment. One patient had a pCR with tumor regression and fibrosis post-treatment (top right) and one patient with a locally advanced BCC had a non-pCR with a tumor area reduction after T-VEC treatment (bottom right). g, Waterfall plots presenting the overall tumor area reduction (%) from baseline before first T-VEC injection until the time point of surgery in patients positive and negative for the primary end point (PE), including information about the pathological response (pCR, dark green; non-pCR, light green) on an individual patient level. Patient 20 had no change after two cycles of T-VEC and dropped out of the study due to an AE. The dashed line represents the 50% tumor area reduction threshold. h, A spider plot exemplifying the tumor area reduction (%) of each patient according to treatment time points.
Source data
Primary end point
The primary end point of the study, defined as the proportion of patients, who after six cycles of T-VEC (13 weeks) at the time point of surgery, become resectable with primary wound closure without the need for plastic reconstructive surgery like skin flaps or skin grafts, was achieved. In the first stage of the study, 9 of 18 (50%) patients already had a positive response in the primary end point (Fig. 1c); however, only eight responses of the predefined 43 patients were required in this Simon’s two-stage design. Therefore, the null hypothesis with a rate of ≤10% could already be rejected (P < 0.0001) (lower and upper bound 29.1% and 70.9%; two-sided 90% Clopper–Pearson confidence interval) and the study was discontinued for early success.
Of the other nine patients who did not have a positive response in the primary end point, five of nine (55.6%) required a local skin flap, one of nine (11.1%) a skin transplant, one of nine (11.1%) a local skin flap in combination with a skin graft and two of nine (22.2%) patients, who would have required skin flaps/grafts, requested secondary wound healing post-excision.
Secondary end points
Six of 18 (33.3%) patients had a complete response (CR), 4 of 18 (22.2%) a partial response (PR) and 8 of 18 (44.4%) a stable disease (SD), resulting in an ORR of 55.6% (Fig. 1d) according to the World Health Organization (WHO) criteria, to neoadjuvant T-VEC treatment. Of note, none of the patients had an increase in tumor size during the treatment period. Six of 18 (33.3%) patients had a pathological complete response (pCR) and 12 of 18 (66.7%) had a pathological noncomplete response (non-pCR) (Fig. 1e,f). Five of nine (55.6%) patients with a histopathological non-infiltrative BCC subtype achieved a pCR, whereas one of nine (11.1%) patients with an infiltrative BCC had a pCR. In one patient, the time to treatment failure was 35 days. The median and mean tumor area reduction from screening until surgery (n = 18) were 42.7% (range 0–83.3%) and 45.4% (s.d. ± 24.5%), respectively. Patients who achieved the primary end point of resection with primary wound closure (n = 9) had a median tumor area reduction of 62.5% (range 25.0–83.3%), whereas patients negative for the primary end point (n = 9) had a median tumor area reduction of 37.7% (range 0–70.9%; Fig. 1g). All patients receiving six cycles of T-VEC showed a nominal reduction in tumor size (Fig. 1h). Of note, in some cases it was difficult to clinically differentiate between fibrosis and viable tumor cells. Therefore, a residual tumor area was calculated in all cases, although in six post-excision samples a pCR was reported.
At a median follow-up of 11 months (range 2.1–16.3 months), from the time point of resection of any residual tumor, no patient had experienced a relapse. The 6-month relapse-free survival rate was 100%. With a median follow-up of 14 months (range 4.3–19.7 months) from the time point of the first T-VEC injection no patient death occurred. The 6-month overall survival rate was 100%. During the median follow-up of 11 months (range 2.1–16.3 months), calculated from the time point of resection of any residual tumor, 2 of 18 (11.1%) patients developed new BCCs on different body sites with a median time to appearance of 7 months (range 1.2–12.1 months).
Safety
All patients who received at least one dose of T-VEC (n = 18) were included in the safety analysis. AEs were documented according to the Common Terminology Criteria for Adverse Events (CTCAE, v.5.0). Fourteen of 18 (83.3%) patients developed T-VEC-related grade 1 or 2 AEs. The most frequent T-VEC-related AEs were local injection site reaction (21.9%), including erythema, swelling and procedural pain. All T-VEC and non-T-VEC-related AEs are listed in Table 2. No serious AEs (SAEs) occurred. At one patient´s request, T-VEC therapy was discontinued after two cycles because of grade 2 pyrexia. This patient was serum IgM and IgG negative for HSV at baseline and converted to be HSV IgM positive 4 weeks after treatment initiation (Table 1). One wound infection and one hematoma were observed following surgery, both unrelated to T-VEC (Table 2). The recruitment and treatment phase of the study commenced in parallel with the COVID-19 pandemic and no safety data were available on the concomitant use of T-VEC and RNA-based COVID-19 vaccines. In our patient cohort, eight patients received an RNA-based COVID-19 vaccination concurrently with T-VEC; neither vaccine-related AEs, nor unreported T-VEC-related AEs occurred.
T-VEC reprograms the tumor immune microenvironment
To evaluate the treatment-induced dynamic changes within the immune cell landscape of BCCs, we performed spatial profiling with multiplex immunofluorescence (mIF) staining before and after treatment from available paired tissue tumor samples (n = 16 from n = 18 patients). Immune cells in treatment-naive BCCs were found at significantly higher levels in the peritumoral stroma, whereas only isolated immune cells were detected within the tumor islands (CD4+ T cells, P = 0.0001; CD4+Foxp3+ Treg cells, P = 0.0013; CD8+ T cells, P = 0.0001; CD68+ myeloid cells, P = 0.0430; CD20+ B cells, P = 0.0139, two-sided Wilcoxon signed-rank test; statistical significance determined with P < 0.05) (Fig. 2a,b) (Extended Data Fig. 1a–c). After neoadjuvant T-VEC treatment, a significant increase of CD8+ T cells (P = 0.0092), CD20+ B cells (P = 0.0004) and CD68+ myeloid cells (P = 0.0042) and a decrease of CD4+ T cells (P = 0.0042) and CD4+Foxp3+ Treg cells (P = 0.0290) was observed. Notably, also the CD8+ T cell/Treg ratio increased significantly (P = 0.0039) (Fig. 2c). In addition, we discovered a significant increase of CD8+ T cells (P = 0.002), CD20+ B cells (P = 0.002) and CD68+ myeloid cells (P = 0.002) infiltrating the interface of the tumor islands (Extended Data Fig. 2a–c) and a significant reduction of tumor cell density compared to baseline samples (P = 0.0488) (Fig. 2d) in patients with a remaining tumor post-treatment.
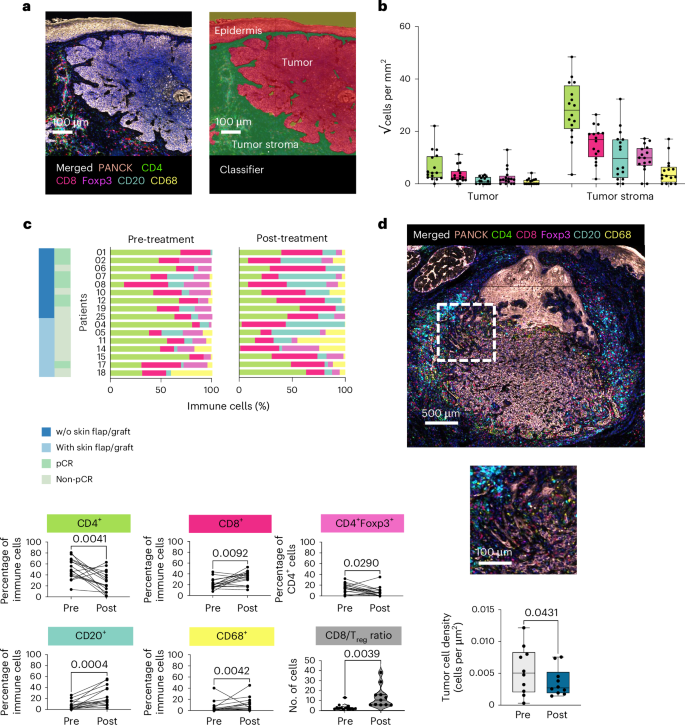
a, Representative images of a baseline sample with merged seven-plex immunofluorescence staining (PanCK (rose), CD4 (green), CD8 (red), Foxp3 (magenta), CD20 (blue) and CD68 (yellow) markers were targeted in addition to nuclear counterstaining with 4,6-diamidino-2-phenylindole (DAPI)) image (left) and tissue segmentation in tumor, tumor stroma and epidermis are displayed (right). Scale bar 100 µm. b, The immune cell infiltrate of patients with treatment-naive BCCs (n = 16) is presented separately in tumor and tumor stroma by box plots (√cells per mm2) (CD4+, P = 0.0041; CD4+Foxp3+, P = 0.0290; CD8+, P = 0.0092; CD68+, P = 0.0042; CD20+, P = 0.0004) (two-sided Wilcoxon signed-rank test, statistical significance determined with P < 0.05). Data are presented as mean ± s.e.m. Each box extends from the 25th (Q1, lower bound of box) to the 75th (Q3, upper bound of box) percentile, the horizontal line in the center of the box represents the median value (Q2), the lower bound of lower whiskers mark the 5th (min) and the upper bound of whiskers the 95th (max) percentiles, dots represent individual values. c, Distribution of immune cells (relative values, %) on an individual patient level pre- and post-treatment, in accordance with the surgical outcome (with or without (w/o) skin flap/graft) and pathological response (pCR and non-pCR) are displayed in bar plots. Immune cells (%) pre- versus post-treatment are displayed with bar plots (two-sided Wilcoxon signed-rank test, statistical significance determined with P < 0.05). d, Representative post-treatment histopathological picture (seven-plex immunofluorescence panel), 500 µm and 100 µm bar, from one patient (n = 1). Tumor cell density is presented in box plots pre- and post-treatment from patients with a non-pCR (n = 10). Data are presented as mean ± s.e.m. (two-sided Wilcoxon signed-rank test, statistical significance determined with P < 0.05). Each box extends from the 25th (Q1, lower bound of box) to the 75th (Q3, upper bound of box) percentile, the horizontal line in the center of the box represents the median value (Q2), the lower bound of lower whiskers mark the 5th (min) and the upper bound of whiskers the 95th (max) percentiles; dots represent individual values.
Source data
Next, we investigated the relationship between immune cell infiltration and the clinical (CR, PR and SD) and pathological response (pCR and non-pCR). According to the clinical response we discovered that patients with a tumor area reduction of ≥50%, meaning a CR or PR, had significantly increased levels of CD8+ T cells (P = 0.0488), CD20+ B cells (P = 0.0020) and CD68+ myeloid cells (P = 0.0020) and decreased CD4+ T cells (P = 0.0059) and CD4+Foxp3+ Treg cells (P = 0.0059). We observed similar trends that did not reach the level of significance in patients with SD, which had a tumor area reduction of ≤50%, with increased numbers of CD8+ T cells (P = 0.1562), CD20+ B cells (P = 0.2188) and CD68+ myeloid cells (P = 0.4375), and a decrease of CD4+ T cells (P = 0.3125) and CD4+Foxp3+ Treg cells (P = 0.9999) (Extended Data Fig. 3a). Comparing pCR to non-pCR samples, we detected similar trends with heterogeneity in significance levels. Patients with a pCR had significantly increased levels of CD20+ B cells (P = 0.0312) and myeloid cells (P = 0.0312) only, and a nonsignificant increase of CD8+ T cells (P = 0.4375) and decrease of CD4+ T cells (0.0938) and Treg cells (P = 0.0625). In contrast, patients with a non-pCR showed significantly increased CD8+ T cells (P = 0.0195), CD20+ B cells (P = 0.0137), nonsignificantly raised myeloid cells (P = 0.0645), a significant decrease of CD4+ T cells (P = 0.0273) and a nonsignificant decrease of CD4+Foxp3+ Treg cells (P = 0.3223) (Extended Data Fig. 3b).
Immune cell heterogeneity according to treatment response
We performed single-cell RNA sequencing (scRNA-seq) (n = 102,093 cells) on available post-treatment tissue samples at the time point of surgery, from a subset of patients (n = 12). In total, 18 cell clusters were identified, including malignant cells, keratinocytes, fibroblasts, endothelial cells, melanocytes, three T cell subsets (CD4+ T cells, Treg cells and CD8+ T cells), NK cells, proliferating cells, B and plasma cells, plasmacytoid dendritic cells (pDC), dendritic cells, Langerhans cells (LCs), mast cells and monocytes and macrophages (Mono-Mac) (Fig. 3a,b and Extended Data Fig. 4a). T cells, B cells and macrophages accounted for the highest percentage of the immune cell population in the scRNA-seq data (Fig. 3a) validated by a mIF staining panel (Fig. 2c).

a, UMAP of tumor cells and their microenvironment in post-treatment BCC samples (n = 102,093 cells) from a subset of patients (n = 12) by scRNA-seq analysis. A total of 18 cell clusters were identified and denoted by colors such as malignant cells, keratinocytes, fibroblasts, endothelial cells, melanocytes, three T cell subsets, NK cells, proliferating cells, B and plasma cells, pDCs, dendritic cells, LCs, mast cells and Mono-Mac, as well as a nondefined ‘other’ cluster. b, Bubble plot indicating the average (Avg.) expression of selected marker genes of the cell types in a.
Source data
In the subsequent analysis we focused on the pathological response, as pCR is considered a clinically beneficial biomarker in neoadjuvant clinical trials for other tumor types21,22. Patients with a non-pCR had significantly higher numbers of Treg cells (marked by Forkhead box protein 3 (FOXP3), interleukin-2 receptor subunit α (IL2RA) and tumor necrosis factor receptor superfamily member 4 (TNFRSF4) (P = 0.028; two-sided Wilcoxon rank-sum test; statistical significance determined with P < 0.05). Proliferating cells (MKI67)) (P = 0.0480) expressed high Mobility Group Box 2 (HMGB2) (Extended Data Fig. 4a), a member of the non-histone chromosomal high mobility group protein family, which has been associated with poor prognosis and invasion in lung cancer23, were significantly elevated in patients with a non-pCR (Extended Data Fig. 4b). Dimensionality reduction after cell-cycle regression analysis further showed that these proliferating cells were primarily T cells (82%; n = 621 T cells out of 754 cells) and were predominantly found in patients with a non-pCR (n = 700 cells from non-pCR versus 54 cells from pCR) and were largely enriched in CD4+ T cells and Treg cells (Extended Data Fig. 4c,d). Direct comparison of these two complementary methods (mIF and scRNA-seq) according to the pathological and clinical response showed consistent trends (Extended Data Fig. 5a–d).
T-VEC favors hyper-expanded, cytotoxic T cell clones
T cells constituted a large proportion of the immune cell population in the TME of treatment-naive and T-VEC-treated BCCs (Figs. 2b,c and 3a). In-depth analysis revealed a total of eight T cell clusters (naive CD4+ T cells, memory T cells, Treg cells, T helper cells, cytotoxic T cells, γδ T cells, proliferating cells and exhausted T cells) and one NK cell cluster (Fig. 4a) post-treatment. Patients with a non-pCR had a significantly higher number of Treg cells (FOXP3, TNFRSF4 and tumor necrosis factor receptor superfamily member 18 (TNFRSF18)) (P = 0.0081) (two-sided Wilcoxon rank-sum test, statistical significance determined with P < 0.05) with upregulation of checkpoint molecules (cytotoxic T-lymphocyte-associated protein 4 (CTLA4), T cell immune receptor with Ig and ITIM domains (TIGIT), inducible T cell co-stimulatory (ICOS)) (Fig. 4b,c and Extended Data Fig. 6a). In contrast, we detected a significantly higher cytotoxic T cell/Treg ratio (P = 0.016) in patients with a pCR (Fig. 4d) corroborating our data from mIF (Fig. 2c). Similar trends were observed when comparing CR with SD (P = 0.029; Fig. 4d).

a, UMAP presenting post-treatment T cells (eight clusters) and NK cells (one cluster) b, Bubble plot indicating the average (Avg.) expression of selected marker genes in each cell cluster, including a subclassification of T helper cells (13 clusters). c, Bar plots presenting the composition of T cells. The colors reflect the ones of the immune cell clusters of a, split by pathological (pCR versus non-pCR) and clinical (CR, PR and SD) response (two-sided Wilcoxon rank-sum test; statistical significance determined with P < 0.05). d, Violin plot demonstrating the ratio of cytotoxic T cells and Treg cells. Cytotoxic T cell/Treg ratio of patients according to pathological response (pCR (n = 4) and non-pCR (n = 8)) and clinical response (CR (n = 4), PR (n = 4) and SD (n = 4)) (two-sided Wilcoxon rank-sum test; statistical significance determined with P < 0.05). e, Bar plots presenting terms from the MSigDB Hallmarks database that were enriched in hyper-expanded T cell clones. Terms are ranked by the total number of genes overlapping differentially expressed genes and adjusted P values are indicated (enricher one-sided hypergeometric test with false discovery rate correction; Benjamini–Hochberg)77. The universe is defined by all detected genes in the T cell subset. f, Bar plots displaying the number of T cell clones aligned to the MacPAS-TCR database according to human HSV- and cancer-associated TCRs.
Source data
Next, we paired our scRNA-seq data with single-cell T cell receptor sequencing (scTCR-seq) assigning a T cell receptor (TCR) clonotype with exactly one α and one β CDR3 chain to 23,099 of 43,661 T cells (53%). We detected small, medium, large and hyper-expanded T cell clones (Extended Data Fig. 6b) but did not observe significant differences between patients with pCR and non-pCR, regarding the absolute number of TCR clones and repertoire clonality (Extended Data Fig. 6c). Cytotoxic T cells had the highest clonal density and made up the majority of hyper-expanded T cell clones (Extended Data Fig. 6d). Large T cell clones showed characteristics of proliferative, dysfunctional CD8+ T cells24,25, whereas small T cell clones expressed naive T cell markers C–C motif chemokine receptor 7 (CCR7) and lymphoid enhancer binding factor 1 (LEF1)26 (Extended Data Fig. 6e), which were found to a higher extent in patients with a non-pCR. Notably, enrichment analysis of marker genes of hyper-expanded T cell clones demonstrated high inflammatory activity and IFN-γ response, suggesting a fully functional activation (Fig. 4e). We further aligned our scTCR-seq dataset with a curated catalog of TCR sequences, McPAS-TCR27. The 435 α-chains of the BCC TCR repertoire were listed in this McPAS-TCR database in 10 of 12 patient samples. We were able to detect human HSV-associated TCRs in two of ten samples and cancer-associated TCRs in ten of ten samples (Fig. 4f).
Macrophage diversity in the TME of T-VEC-treated BCCs
We detected a significant increase of CD68+ macrophages upon T-VEC treatment (P = 0.0430) (two-sided Wilcoxon signed-rank test; statistical significance determined with P < 0.05) (Fig. 2c) and scRNA-seq analysis further unveiled distinct myeloid cell populations post-treatment, such as ficolin 1 (FCN1+), complement C1q C chain (C1QC+) and secreted phosphoprotein 1 (SPP1+)-positive macrophages (Extended Data Fig. 7a,b). The majority were FCN1+ and C1QC+ (74%, n = 10,898 FCN1 and C1QC macrophages out of 14,738 total macrophages) and their distribution was comparable between patients with a pCR and non-pCR, and patients with CR, PR and SD (Extended Data Fig. 7c).
Functional enrichment analyses of differentially upregulated genes highlighted the migratory and inflammatory phenotype of FCN1+ macrophages with several processes related to chemotaxis and defense processes enriched (Clusterprofiler:enricher with false discovery rate correction28 adjusted P < 0.005; Extended Data Fig. 7d–f). Further characterization of the FCN1+ subset using recently published tumor-associated macrophages (TAM) gene signatures29 revealed their contribution to immunoregulatory TAMs (Reg_TAM1) and classical tumor-infiltrating monocytes (Extended Data Fig. 7g), in line with what has been previously described in colorectal cancer for this subset29. C1QC+ macrophages displayed enrichment in genes associated with IFN-γ response, antigen presentation and humoral immune response (Extended Data Fig. 7d–f), and showed similarity to a resident tissue macrophage-like phenotype (Extended Data Fig. 7g)30. At the same time, genes upregulated in SPP1+ macrophages were enriched for enhanced lipid metabolism and hypoxia-inducible genes (Extended Data Fig. 7d–f) and showed similarity to inflammatory TAMs (Inf-TAMs) with additional pro-angiogenic (Angio) signatures (Extended Data Fig. 7g)29. In addition, macrophages expressed Fc γ receptor 3A (FCGR3A), which is associated with antibody-dependent cellular phagocytosis and elimination of cancer cells31 (Extended Data Fig. 7h).
Spatial proximity analysis with mIF, revealed a trend toward an increased colocalization of CD68+ myeloid cells with CD4+ T cells upon T-VEC treatment (P = 0.1754) (CD68+ myeloid cells within 10 μm of CD4+ T cells; mean 0.2059 (s.d. ± 0.1979) pre-treatment versus 0.2976 (s.d. ± 0.1459) post-treatment; two-sided Wilcoxon signed-rank test, statistical significance determined with P < 0.05) and a significantly increased colocalization with CD20+ B cells (P = 0.0052) (CD68+ myeloid cells within 10 μm of CD20+ B cells; mean 0.0083 (s.d. ± 0.1377) pre-treatment versus 0.2277 (s.d. ± 0.1283) post-treatment; Extended Data Fig. 7i).
T-VEC induces hyper-expanded IGHG1 plasma cells
Investigation of B cell subsets after treatment uncovered inter- and intrapatient heterogeneity and revealed a total of nine B and plasma cell clusters (Fig. 5a,b); however, no significant differences between the cluster gene expression and pathological and clinical response were observed (Fig. 5c and Extended Data Fig. 8a). We identified a subpopulation of B cells expressing high levels of major histocompatibility complex, class II, DR α (HLA-DRA) in clusters 34, 7, 21 and 38 (Extended Data Fig. 8b), which suggests those tumor-infiltrating B cells were capable of antigen presentation32. Furthermore, we detected cytotoxic and antiviral features (granzyme K (GZMK) and perforin 1 (PRF1)) in B cells in cluster 38 (ref. 33) and memory features (CD27) in B and plasma cells (cluster 24, 4, 3, 22 and 38)34 (Extended Data Fig. 8b,c). Plasma cells (cluster 15, 22, 3, 4 and 24) showed a high expression of the transcription factor X-box binding protein 1 (XBP1) (Extended Data Fig. 8b), which is necessary for terminal differentiation of B lymphocytes to plasma cells35. We did not detect immunosuppressive phenotypes (interleukin-10 (IL10) and transforming growth factor β1 (TGFB1); Extended Data Fig. 8c).

a, UMAP of plasma and B cells after treatment (nine clusters). b, Bubble plot indicating the average (Avg.) expression levels of selected marker genes in each cell cluster. c, Bar plots presenting the composition of B and plasma cells. The colors reflect the ones of the immune cell clusters of a, split by pathological response classified in pCR and non-pCR and clinical response categorized in CR, PR and SD. d, Bar plots showing immunoglobulin (Ig) types in B and plasma cells according to their clonality (left) and cell type (right). e, Exemplary merged mIF staining (IgG1+, yellow; CD138+, green; PanCK+, pink) of a pre-treatment BCC, and corresponding single stainings (IgG1+, yellow; CD138+, green; PanCK+, pink). Scale bar, 50 µm, ×40 magnification. CD138+ plasma cells pre- versus post-treatment (P = 0.0182) and IgG1+CD138+ plasma cells pre- versus post-treatment (P = 0.0155) from patients with paired tumor tissue samples (n = 16) are separately represented by box plots (cells per mm2), and according to pathological response (pCR (n = 6) (P = 0.013)/(P = 0.0312) and non-pCR (n = 10) (P = 0.275)/(P = 0.1602)) (two-sided Wilcoxon signed-rank test; statistical significance determined with P < 0.05). Data are presented as mean ± s.e.m. Each box extends from the 25th (Q1, lower bound of the box) to the 75th (Q3, upper bound of the box) percentile, the horizontal line in the center of the box represents the median value (Q2), the lower bound of lower whiskers mark the 5th (min) percentile and the upper bound of whiskers the 95th (max) percentile. Dots represent individual values. f, Bar plots displaying terms from the MSigDB Hallmarks database. Terms are ranked by P value and the total number of genes overlapping differentially expressed genes and adjusted P value are indicated (enricher one-sided hypergeometric test with false discovery rate correction; Benjamini–Hochberg)77. The universe is defined by all detected genes in the B cell/plasma cell subsets.
Source data
The integrated single-cell B cell receptor sequencing (scBCR-seq) and scRNA-seq of 13,219 of 25,166 B cells (53%) revealed that half of the B cell receptor (BCR) repertoire was composed of large or hyper-expanded clones. Hyper-expanded clones were observed in plasma cells only (cluster 3, 4, 24 and 22), whereas B cell clones presented a medium and small expansion (cluster 21, 7 and 38) (Extended Data Fig. 9a,b). We did not identify significant differences between patients with a pCR and non-pCR, regarding the absolute number of BCR clones and repertoire clonality (Extended Data Fig. 9c). Characterization of marker genes of hyper-expanded, large, medium and small clones further confirmed transcriptional heterogeneity of B and plasma cells (Extended Data Fig. 9d). Relative frequency of immunoglobulin heavy constant (IGH) isotypes in B and plasma cell clusters revealed that plasma cells were mainly enriched within IGHγ (IGHG) classes, whereas B cells were enriched within IGHμ (IGHM) classes, and to a smaller extend IGHG, IGHδ (IGHD) and IGHα (IGHA). Hyper-expanded plasma clones were nearly exclusively IGHG1-positive plasma cells (Fig. 5d), which were previously reported to be associated with a proinflammatory and cytotoxic antitumor response36. Four-plex IF staining validated the presence of CD138+ and IgG1+CD138+ plasma cells and we detected a significant increase upon T-VEC treatment (P = 0.0182; two-sided Wilcoxon signed-rank test, statistical significance determined with P < 0.05) (137.0 versus 678.6 cells per mm2) and (P = 0.0155) (45.6 versus 388.1 cells per mm2), respectively. Of note, we observed that patients with a pCR had a significantly increased number of CD138+ plasma cells (P = 0.013) (mean 1.0 (s.d. ± 2.103) versus mean 482.0 (s.d. ± 385.7) cells per mm2) and IgG1+CD138+ plasma cells (P = 0.0312) (mean 0.1 (s.d. ± 0.1830) versus 235.9 (s.d. ± 241.5) cells per mm2), whereas non-pCR patients had a nonsignificant increase of CD138+ plasma cells (P = 0.2754) (mean 218.5 (s.d. ± 289.1) versus 796.6 (s.d. ± 798.1) cells per mm2) and IgG1+CD138+ plasma cells (P = 0.1602) (mean 73.0 (s.d. ± 98.24) versus 479.5 (s.d. ± 599.2) cells per mm2) (Fig. 5e). In addition, hyper-expanded clones showed an enrichment in oxidative phosphorylation signatures associated with antibody producing plasma cells37 (Fig. 5f).
Discussion
This study met its primary end point and demonstrated that neoadjuvant T-VEC treatment can reduce the tumor size of BCCs and simplify surgery, can lead to a complete pathological remission and was well tolerated. T-VEC elicited a strong immune cell response and significantly altered the intratumoral immune cell composition. We detected hyper-expanded, cytotoxic T cell clones and IGHG1 plasma cell clones.
BCC development predominantly affects older patients, commonly with multiple comorbidities38. Therefore, systemic treatment approaches are not always feasible in this patient population. For instance, neoadjuvant HHI treatment can result in a high rate of treatment discontinuation, due to treatment-related AEs39 and immune-checkpoint inhibitors potentially have a risk of high-grade and permanent treatment-related AEs40. T-VEC may thus be an appealing alternative thanks to its apparently safe AE profile41. In the NeoBCC trial, T-VEC was also well tolerated.
We evaluated the efficacy of T-VEC treatment across a broad spectrum of BCCs, including all BCCs requiring a skin flap/graft, as BCCs with a diameter of more than 2 cm already have an 8.9% risk of recurrence after resection8. We excluded BCCs infiltrating the mouth, eyelid or ear to avoid potential complications in case of possible disease progression during the 3-month treatment period. After six cycles of neoadjuvant T-VEC treatment all patients had a noticeable tumor area reduction, including those who were classified as SD, implying that there are no real nonresponders. As in other neoadjuvant studies the clinical assessment of the tumor area did in some cases underestimate the level of pathological response. Therefore, the focus of our translational analysis was on the pathological response, which has also been demonstrated to be a favorable biomarker and is used as a surrogate primary end point in neoadjuvant trials21,42. Of note, non-infiltrative BCCs responded best to treatment with 55.6% achieving a pCR. In contrast, only 11.1% of infiltrative BCCs achieved a pCR. In general, infiltrative BCCs are clinically challenging and show a higher risk of recurrence43 and a dense infiltrate of Treg cells14; however, a decrease in tumor cell density, indicative of an active OV-dependent tumor cell lysis and increased immune cell infiltration, was also observed in these tumors. The T-VEC-mediated local immune cell response might lead to a reduced relapse rate, as it has been reported that the recurrence rate of BCCs with a dense immune cell infiltrate is lower compared to BCCs with a discrete immune cell infiltrate44. In this regard we did not observe a single BCC recurrence at the median 11-month follow-up. It is well known that patients with a history of BCC have a significantly higher risk of developing a new BCC at other body sites45 with a 5-year cumulative rate of 45.2% compared to 5% in the general fair-skinned population46. During the follow-up period, we detected an incipient nodular BCC on a different body site in two patients with a non-pCR (11.1%).
In our study, T-VEC led to a significant increase in the number of cytotoxic CD8+ T cells, B cells, myeloid cells and of the CD8+ T cell/Treg ratio, whereas the number of Treg cells decreased. These observations demonstrate T-VEC’s capacity to remodel the immunosuppressive TME of BCCs, which is in line with previous data from melanoma17, B cell lymphoma47 and breast cancer48. In addition, our study implicates other immune cell populations in the T-VEC-treated TME, such as antigen presenting and inflammatory phenotypes (FCN1+ and Q1QC+ macrophages and HLA-DRA+ B cells) identified in our scRNA-seq data. These cells might be involved in shaping an antitumorigenic adaptive immune response (CD8+ T cells and IgG1+ plasma cells). For instance, FCN1+ macrophages have been shown to migrate into tumors and to exert an antitumor transcriptional program29 and they were associated with inflammatory responses to viral infection49. In contrast, C1QC+ macrophages were associated with poor prognosis50, although their role in mediating antitumoral responses has also been documented51. The third detected subtype in our study, SPP1+ macrophages, has been associated with poor outcome in various cancer patients52; however, SPP1+ macrophages were less abundant in our dataset compared to the predominant proinflammatory FCN1+ and Q1QC+ macrophage milieu. Furthermore, the increased colocalization of macrophages with B cells and T cells observed with our spatial proximity analysis might suggest a possible crosstalk of macrophages with the adaptive immune system53 upon T-VEC treatment. Bommareddy et al. reported an induction of antiviral and antitumoral CD8+ T cells after T-VEC treatment in a mouse model54. In our study we discovered HSV- and cancer-specific TCR clones using the McPAS database (pathology-associated TCR database27), and we assume that these clones might be involved in the recognition of tumor and viral antigens, potentially related to T-VEC treatment. The main observed difference between patients with a pCR and non-pCR on immune cell level was found within the T cell compartment. Patients with a pCR showed a higher T cell-dependent antitumoral activity, with an increased cytotoxic T cell/Treg ratio, whereas patients with a non-pCR had an increased number of Treg cells.
We additionally detected distinct B cell features and hyper-expanded IGHG1 plasma cell clones, which were previously shown to be associated with an effective antitumor response36. We also found an enrichment in oxidative phosphorylation signatures, which have been associated with maturation toward antibody producing plasma cells37. It was reported that T-VEC led to an IgG switch in a few patients with melanoma (n = 3)55. We could show the expansion of IGHG1 plasma cell clones at the transcriptome level (confirmed by spatial mIF analysis (IgG1+CD138+ plasma cells) at a protein level) following T-VEC treatment in BCCs 3 months after treatment initiation in several patients. It was speculated that plasma cells following T-VEC treatment might have a malignant potential in patients with melanoma (n = 3)20 and a follow-up of patients for potential hematological malignancies should be performed. In contrast, our results are indicative of an antitumoral role of plasma cells in the TME of T-VEC-treated BCCs. In addition, B cells were enriched in IGHG1 subclasses, gene expression of GZMK and PRF1, indicative of B cells with antitumoral activity36. Moreover, the observed antigen-presenting-like features of B cells (HLA-DRA) might shape an antigen-specific immune response with the activation of CD4+ T cells56, potentially increasing the antitumoral T cell response57. In contrast, only a few IGHM and IGHD naive B cell clones and a small number of IGHA B and plasma cell clones were detected, which are known to harbor immunosuppressive features via facilitating the conversion of CD4+ T cells to Treg cells58; however, we did not detect direct immunosuppressive B cell phenotypes (IL10 and TGFB1). In line with data linking immune-checkpoint inhibitor treatment success with the presence of plasma and B cells59, our results implicate the humoral immune response as a mediator of immunotherapeutic agents in cancer.
We did not detect significant differences in terms of clonality and composition within the immune cell compartments between samples of patients with a pCR and non-pCR. This might be due to the fact that after six cycles of T-VEC we did not have a single patient without any regression of the BCC. The observed immune response in all T-VEC-treated patients also raises the question of whether more than six cycles of T-VEC application would have led to more pronounced and sustained remodeling of the immunosuppressive TME and complete tumor cell clearance in a higher number of patients.
This study, which had a two-stage design, was positive for its primary end point in 9 of 18 (50%) patients. After formal testing, and rejection of the null hypothesis, the study did not proceed to the second stage but was discontinued due to early success. It should be noted that because of this early termination the clinical response rate of 55.6% assessed by WHO criteria and the pCR rate of 33.3% in these 18 patients might overestimate the response rate in a larger study population as we cannot exclude that these end points could have been different in the population of the second stage. Our results warrant further investigation in randomized clinical trials as a stratified therapy and favor the development and investigation of next-generation oncolytic virotherapies in the treatment of BCCs.
Conclusion
Neoadjuvant T-VEC treatment of cutaneous BCCs was well tolerated, showed high activity and resulted in reprogramming of the TME. Our data promote OVs as a strategy in the treatment landscape of cutaneous BCCs.
Methods
Study oversight
This investigator-initiated study was conducted in accordance with the principles of the Declaration of Helsinki and the International Conference on Harmonization Good Clinical Practice guidelines and was approved by the ethics committee of the Medical University of Vienna (no. 1881/2018) and by the Austrian federal office for safety in health care (BASG). All patients included in the clinical trial provided written informed consent before enrollment and additionally provided written consent that clinical images and data can be used for publications. Participants were not compensated for study participation. The study was registered in the European Clinical trials database with the EudraCT no. 2018-002165-19. The study’s sponsor was the Medical University of Vienna.
Patient eligibility
Patients had to be aged ≥18 years at the time of informed consent, with a histologically confirmed BCC, either newly developed or recurring/progressing after previous treatment. All patients provided written consent for study participation and for the use of clinical photos. Tumors had to be measurable by caliper. Any systemic therapy for laBCCs was required to be stopped at least 8 weeks before study treatment. Patients with metastatic, sclerosing/morpheaform or superficial BCCs, or BCCs directly infiltrating the mouth, eyelid and/or nostril were excluded, as well as patients with a history of other malignancies within the past 5 years, or active secondary tumors. All inclusion and exclusion criteria are listed in the study protocol in the Supplementary Information. Each participant fulfilled all inclusion and none of the exclusion criteria.
Study design, treatment schedule and sample collection
This investigator-initiated two-staged, single armed, exploratory phase II clinical trial included difficult-to-resect BCCs, defined as BCCs that require a skin flap or graft for wound closure after excision (Fig. 1a). All patients were selected based on an unequivocal vote of an expert panel consisting of a dermato-surgeon, plastic surgeon and dermato-oncologist on the necessary surgical procedure. After a screening period of a maximum 28 days, T-VEC was administered by intralesional injection into the active tumor margin of the BCC. The maximum volume per treatment was 4 ml, determined by the lesion size (Supplementary Table 2). After the initial dose of 106 (1 million) plaque-forming units (p.f.u.) per ml, a subsequent dose with 108 (100 million) p.f.u. per ml was given 21 (±3) days after. All subsequent doses with 108 (100 million) p.f.u. per ml were applied every 14 (±3) days, for up to six doses, over a treatment period of 13 weeks. To determine the area of the BCC, the lesion’s width and length was measured with a caliper and photos, including a ruler, were taken at every study visit.
Participants were followed up every 3 months until 12 months after surgery and every 6 months thereafter, including clinical assessment of the tumor area for possible recurrence, and a total body skin examination for assessment of occurrence of new BCCs. Pre-treatment peripheral blood was collected from all patients at eight time points: cycle 1, cycle 2, cycle 3, cycle 4, cycle 5, cycle 6, end of treatment visit and follow-up visit 1 for safety analysis. Tumor tissue samples were gathered at baseline and at the time point of surgical removal, as outlined in the study scheme (Fig. 1a).
Histopathologic classification and response evaluation
The classification of pre-treatment hematoxylin and eosin (H&E)-stained formalin-fixed paraffin-embedded (FFPE) tissue sections into infiltrative or non-infiltrative BCC subtypes14 was performed by three independent board-certified histopathologists. BCCs with one or more histopathologic subtypes within a tumor were classified according to the subtype of highest risk (for example, a mixed BCC with an infiltrative and nodular region was classified as an infiltrative BCC). Clinical response was evaluated according to WHO criteria60 in CR, PR, SD and PD per investigator assessment47. CR was defined as a negative histopathology report upon excision and clinical CR, SD or PR. PR is defined as a reduction of ≥50% in the sum of diameters of target lesions taking as reference the baseline sum diameters (bidimensional) and positive tumor histopathology, SD as a <50% reduction, positive tumor histopathology, and PD as an increase of ≥25% of externally visible tumor dimension, development of new ulceration, or the presence of new lesions. ORR was defined as the total number of patients with a CR and a PR. The pathological response was classified as either pCR or non-pCR, based on the presence or absence of residual BCC tumor cells in the biopsy specimen18. Assessment of the histopathological response of H&E-stained FFPE tissue sections was carried out by three independent board-certified histopathologists blinded to the patient’s clinical outcome.
Multiplex immunofluorescence
The 4-μm thin tissue sections were cut from FFPE BCC specimens and stored at −80 °C until use. Staining was performed using the Opal seven Solid Tumor Immunology kit (Akoya Biosciences, OP7TL4001KT, lot 210830009). The protocol was adapted from the manual provided by Akoya Biosciences and according to the protocol of Griss et al.61. The seven-plex immunofluorescent staining panel consisted of CD4, CD8, CD20, Foxp3, CD68, PanCK and nuclear counterstaining with 4,6-diamidino-2-phenylindole (DAPI) (Supplementary Table 3). The four-plex immunofluorescent staining panel consisted of PanCK, CD138 and IgG1 and nuclear counterstaining with DAPI (Supplementary Table 4). Multi-stained tissue sections were scanned with the automated quantitative pathology imaging system Vectra Polaris (Akoya Biosciences). To unmix the multiplexed images and identify each marker of interest, a spectral library was created from single stained slides (CD4 coupled to either Opal 520, Opal 540, Opal 570, Opal 620, Opal 650 or Opal 690) in inForm (Akoya Biosciences). Quantification and spatial analysis of immune cells and tumor cells were performed using inForm (Akoya Biosciences) and HALO image analysis software (Indica Labs). For the analysis 3−6 equal sized areas, consisting of 50% tumor stroma and 50% tumor islands (in case of available tumor islands), were selected (Extended Data Fig. 1a). The workflow of the automated image analysis is outlined in Extended Data Fig. 1b,c.
Tumor dissociation and cell sorting
The 3–5-mm skin punch biopsies were digested for 1 h at 37 °C using a Miltenyi Skin Dissociation kit (130-101-540) and filtered through a 40-µm strainer. Red blood cells were lysed for 1 min at room temperature with ACK buffer (Gibco A10492-01). After washing, cells were stained with CD45 PerCP-Cy5.5 (BioLegend, 304027, clone HI30, lot number B267897, dilution 1:100), EpCAM APC (BioLegend, 324207, clone 9C4, lot number B349154) and DAPI (Invitrogen, D1306) and sorted with FACSAria (BD). A total of 40,000 CD45+ immune cells and 4,000 CD45− EpCAM+ tumor cells were sorted into PBS + 0.2% BSA and loaded into a 10x Genomics 5′ v.1.1 reaction for further processing with the 10x Genomics pipeline with a relative centrifugal force of 500g at 4 °C.
Preparation of single-cell RNA sequencing libraries
Reverse transcription, DNA synthesis and gene expression, TCR and BCR libraries preparation was performed according to the 10x Genomics 5′ v.1.1 protocol, using the Single Cell 5′ PE and Single Cell V(D)J R2-only chemistries. Qubit dsDNA HS kit (Invitrogen Q33231) and Tapestation (Agilent) were used for quality control. Libraries were sequenced on a NovaSeq SP flow cell.
Single-cell RNA sequencing analysis
Raw sequencing data were processed with Cell Ranger (v.7.0.0) software (10x Genomics) for demultiplexing and alignment to the GRCh38 human reference transcriptome (refdata-gex-GRCh38_HSV-2020-A). Processed data were analyzed using the R software and Bioconductor packages using a Docker image derived from rocker/tidyverse:4.1.2. Default parameters were used in all function calls, unless stated otherwise. Specifically, we used Seurat (v.4.1.0)62 and canceRbits (v.0.1.4.9004; https://github.com/cancerbits/canceRbits) to load preprocessed results from Cell Ranger into R and to perform quality control (removing cells with fewer than 300 genes or mitochondrial content >15%). We removed cell-free messenger RNA contamination for each sample independently using SoupX (v.1.5.2)63. We estimated the contamination fraction, considering specific genes as the top five marker genes of each Seurat cluster of the merged uncorrected counts dataset obtained with the function FindMarkers. Corrected counts were then merged and processed using the standard Seurat workflow. We assigned each cell a cell-cycle G2/M and S score using the Seurat CellCycleScoring function (s.features = cc.genes$s.genes, g2m.features = cc.genes$g2m.genes). We used SCtransform (v.0.3.3) for the normalization with either default parameters or with vars.to.regress = c (‘S.Score’ and ‘G2M.Score’) to regress out a cell-cycle effect64. We reduced sample-specific variation by removing immunoglobulin genes from the VariableFeatures before principal-component analysis and Uniform Manifold Approximation and Projection (UMAP) dimensional reductions with the RunPCA and RunUMAP functions, respectively. We computed the 20 nearest neighbors based on the 30 first UMAP dimensions using the function FindNeighbors before clustering cells with the FindClusters function (resolution = 0.8). We annotated the Seurat clusters by manually merging two independent mappings to the Skin Tabula Sapiens reference 65 and the human peripheral blood mononuclear cell Azimuth reference 66 using the Azimuth package (v.0.4.3). Next, we subdivided epithelial cell clusters into keratinocytes and malignant cells based on the expression of specific marker genes (KRT17, EpCAM and BCAM for the malignant cells and FGFBP1, KRT1 and KRT6A for the healthy keratinocytes). These annotations were validated by histological reports of post-treatment samples according to absence or presence of malignant cells, classified in pCR and non-pCR. We used ggpubr (v.0.4.0.999; https://rpkgs.datanovia.com/ggpubr/) to perform a statistical comparison of relative cell type frequencies between samples, with the functions ggpaired and stat_compare_means (method = ‘wilcox.test’). FeaturePlot and VlnPlot functions from Seurat were used to plot gene expression. We used pseudobulk differential expression analyses (DElegate package (v.1.0.0)67) to (1) find markers of the different cell types using the function FindAllMarkers2 (default parameters) and (2) to compare pCR and non-pCR per cell type using the function findDE (replicate_column = ‘patient’, method = ‘edger’). We used the enricher function (default parameters) from the clusterProfiler package (v.4.2.2)68 to perform hypergeometric tests for functional enrichment analysis. The universe/background was defined as the row names of the Seurat object (that is, all detected genes). The human hallmark and Gene Ontology (GO) biological process (C5:BP) gene sets were retrieved from the Molecular Signatures Database (MSigDB) using the msigdbr function and package (v.7.4.1)69 and the BioPlanet_2019 gene set was downloaded from https://maayanlab.cloud/Enrichr/#libraries (date accessed 1 September 2024)70. Finally, we applied the Benjamini–Hochberg method to control false discoveries in multiple hypothesis testing71. Plots were generated using SCpubr (v.1.0.1.9000), ggplot2 (v.3.3.5)72 and RColorBrewer (v.1.1-2; http://www.ColorBrewer.org) packages.
Immune receptor analysis
The TCR and BCR raw sequencing data were processed with Cell Ranger (v.7.0.0) software (10x Genomics) for demultiplexing and alignment to the GRCh38 human reference (vdj_GRCh38_alts_ensembl-5.0.0). We used scRepertoire (v.1.5.2)73 to load preprocessed results from Cell Ranger into R using the functions combineTCR and combineBCR. Default parameters were used in all function calls unless stated otherwise. We retained all cells expressing exactly one of the α/β or IGH/IGL chains. A clonotype was defined as a unique combination of the CDR3 motifs, defined by the strict combination of the VDJC gene expression and the CDR3 nucleotide chain. To allow a fair comparison of samples with different numbers of T cells, clonality for patients and cell types were calculated as 1 − normalized entropy74. The space occupied by clonotype proportions was calculated using the clonalHomeostasis function, grouping the clonotypes into bins by relative frequency, respectively for BCR (and TCR): rare = 0–0.0001 (or 0–0.00005), small = 0.0001–0.001 (or 0.00005–0.0005), medium = 0.001–0.01 (or 0.0005–0.005), large = 0.01–0.1 (or 0.005–0.05) and hyper-expanded = 0.1–1.0 (or 0.05–1.00). We added the clonotype information to the transcriptomic dataset using the function combineExpression (filterNA = TRUE). The spatial density of small, medium, large and hyper-expanded clones was plotted using the clonalOverlay function. We characterized hyper-expanded, large, medium and small clones using the pseudobulk approach implemented in FindAllMarkers2 from the Delegate package (v.1.0.0; https://github.com/cancerbits/DElegate)67 (replicate_column = ‘patient’, method = ‘edger’, min_fc = log2(1), min_rate = 0.1). To be considered as a marker gene, a gene must be expressed in at least 10% of the cells of interest. Pathway enrichment analysis of marker genes of hyper-expanded clones was performed using enrichr function from the clusterProfiler package (v.4.2.2)68. The universe was defined as the row names of the Seurat object and the human hallmark gene set was retrieved from MSigDB using the msigdbr function and package (v.7.4.1)69. Potential targets of T cells (cancer cells and viruses) were inferred by mapping the chains A of TCR to the manually curated catalog of TCR sequences MacPAS-TCR, updated version from 10 September 2022 (ref. 27).
Statistics
The study sample size was calculated using a Simon’s two-stage design75 and was performed based on the primary end point. The null hypothesis stated that the true response rate was ≤10%. This was tested against a one-sided alternative with an α of 5%. When the true response rate is 25%, this design yields a power of 80% (ref. 39). In the first stage, n1 = 18 patients were recruited. In the case of two or fewer responses, the study would have been stopped for futility. Otherwise, n2 = 25 additional patients would have been accrued for the second stage, resulting in a total sample size of 18 + 25 = 43. The null hypothesis had to be rejected if eight or more responses were observed in all 43 patients (both cohorts). If eight or more patients were positive in the primary end point already after the first stage, based on non-stochastic curtailment, the final decision is already the rejection of the null hypothesis. This implicitly defines an early stopping of the trial for efficacy (success) for a Simon’s two-stage design. Our study resulted in a rate of 9 of 18 (50%) with a two-sided 90% Clopper–Pearson confidence interval of lower and upper bound of 29.1% and 70.9%. Even assuming that all future 25 patients of a second stage would not have had a positive response for the primary end point, this would have resulted in a rate of 9 of 43 (20.9%) with a two-sided 90% Clopper–Pearson confidence interval of a lower and upper bound of 11.3% to 33.7%. In this scenario the null hypothesis would have also been rejected (P = 0.018). Therefore, after formal testing, the study’s primary end point was already accomplished at the first stage after observing nine responses and the second stage was not initiated.
A two-sided Wilcoxon matched-pairs signed-rank and rank-sum test was used to check for differences between two groups. The Benjamini–Hochberg method was applied for multiple testing corrections. Statistical significance was determined with P < 0.05. Both sexes were enrolled. Due to the small sample size (n = 18), no sex-based subanalyses were performed. Statistical analyses were conducted using the Software Microsoft Excel, the R Project for Statistical Computing (v.4.3.0), SPSS (v.28.0) and GraphPad Prism (v.8.4.3. (471)). Graphical illustrations were created using biorender.com with agreement nos. CB279R3D2F and XF279R4230.
Statistics and reproducibility
The study sample size was calculated using a Simon’s two-stage design75 and was performed based on the primary end point. This clinical trial was not a randomized trial but followed the CONSORT guidelines in principle76. All available tissue specimens from enrolled patients were included for analysis. No data were excluded from the analyses. The data were formally tested for normality and according to the sample size, nonparametric tests, including two-sided Wilcoxon signed-rank and rank-sum tests, were used to compare groups. During translational experiments and outcome assessments the investigators were blinded to allocation.
Reporting summary
Further information on research design is available in the Nature Portfolio Reporting Summary linked to this article.
Responses