Elevated fasting serum xylitol levels are associated with a lower risk of incident type 2 diabetes among individuals with prediabetes in the Chinese population

Introduction
The global prevalence of diabetes has reached pandemic proportions, leading to serious complications and poor life expectancy [1]. Diabetes prevalence, particularly type 2 diabetes mellitus (T2DM), has significantly increased in China over the past few decades. Prediabetes, an intermediate stage of the progression to diabetes, affects approximately 38.1% of Chinese adults [2]. Without intervention, 5–10% of people with prediabetes progress to T2DM each year [3]. Therefore, detection of early markers and interventions for the progression of prediabetes to diabetes are of major importance.
Studies have shown that lifestyle modification (dietary or physical activity improvements) is the most effective strategy for reversing prediabetes [4]. Artificial and natural sweeteners are widely used as sugar substitutes in the food industry to reduce energy intake [5]. Sugar alcohols (polyols), natural sweeteners with low-calorie content, are preferable alternative sweeteners to sucrose because of their beneficial effects on metabolism [6, 7]. The most commonly used polyols are xylitol, sorbitol, and erythritol, which contribute to hyperglycemia management [8,9,10,11]. In addition to dietary sources, polyols are synthesized endogenously as a part of carbohydrate metabolism [12]. Xylitol is an intermediate in the glucoronate–xylulose cycle, sorbitol is endogenously produced from glucose and oxidized to fructose, and erythritol is endogenously produced by the pentose phosphate pathway [13,14,15]. However, the association between serum polyols and the progression of prediabetes to diabetes has not yet been investigated.
Therefore, we aimed to detect the concentrations of the common-used polyols in prediabetes and to further evaluate the association between different polyols and the prevalence of type 2 diabetes.
Materials and methods
Study population
A total of 9961 participants from Shanghai Chongming District were included in the baseline survey of the REACTION study from 2011 to 2012, and 7587 completed the follow-up survey in 2014 [16]. Participants with prediabetes at baseline and who developed T2DM during the 3.5-year follow-up period were classified as progressors. After 3.5 years of follow-up, the patients who maintained prediabetes were classified as non-progressors. Progressors were defined as cases, while non-progressors were defined as controls. Controls were selected for cases in a 1:1 ratio and matched according to sex, age, fasting blood glucose (FBG), 2h-postprandial blood glucose (PBG), glycated hemoglobin (HbA1c), and body mass index (BMI). In total, we identified 180 cases and 180 eligible controls. Figure 1 shows the patient selection process. This study was approved by the Ethics Committee of Chongming Hospital Affiliated to Shanghai University of Health and Medicine Sciences and in accordance with the Helsinki Declaration. All the participants provided written informed consent.

A total of 1659 participants with prediabetes at baseline, who had completed primary data and the follow-up visit, were selected. The final analysis included 180 incident diabetes (progressors) and 180 non-progressors who remained prediabetes during follow-up. The two groups were matched for gender, age, FBG, PBG, HbA1c, and BMI.
Characteristics collection and laboratory measurements
Information on lifestyle, disease history, and medication use was obtained using standard questionnaires. A food frequency questionnaire was used to estimate the participants’ usual diet at baseline. The frequency ranged from times per day to times per week, month, or year. The sugar-sweetened beverages consumed were recorded in standard bottles (250 mL).
Height, weight, waist circumference, hip circumference, and blood pressure were measured using standardized methods. BMI was derived from weight in kilograms divided by the square of height in meters. The waist-to-hip ratio is the waist circumference divided by the hip circumference. Ultrasonography was used to assess fatty liver disease.
After fasting for 10 h, a 75-g oral glucose tolerance test (OGTT) was performed in the morning. Blood samples were collected during fasting and 2 h-post-glucose-load. For blood glucose, HbA1c, triglycerides (TG), total cholesterol (TC), low-density lipoprotein cholesterol (LDL-C), high-density lipoprotein cholesterol (HDL-C), alanine aminotransferase (ALT), aspartate aminotransferase (AST), gamma-glutamyl transferase (GGT) and serum creatinine measurements, the samples were sent to the central laboratory of Shanghai Institute of Endocrine and Metabolic Diseases. Serum fasting insulin levels were measured using an electro-chemiluminescence immunoassay (Roche Cobas e 601). The homeostasis model assessment for insulin resistance (HOMA-IR) was calculated as follows: FPG (mmol/l) × FINS (mU/L)/22.5. Homeostatic model assessment of β-cell function (HOMA-β) was calculated as FINS × 20/(FPG-3.5).
Definition and classification of diabetes subtypes
Prediabetes was defined as follows: 1) impaired fasting glucose (IFG): FBG 6.1–6.9 mmol/L and 2h-PBG < 7.8 mmol/L, or 2) impaired glucose tolerance (IGT): FBG < 6.1 mmol/L and 2h-PBG 7.8–11.0 mmol/L, or 3) IFG + IGT: FBG 6.1–6.9 mmol/L and 2h-PBG 7.8–11.0 mmol/L.
Diabetes was defined as follows: 1) FBG ≥ 7.0 mmol/L, and/or 2) 2h-PBG ≥ 11.1 mmol/L, and/or 3) HbA1c value ≥ 6.5%.
Participants with T2DM were classified according to fasting hyperglycemia (F-DM) or 2h-post-glucose-load hyperglycemia (2h-DM), or both (F-2h-DM) [17].
Serum polyol level measurement
Peripheral venous blood samples were collected after an overnight fast of at least 10 h and stored at −80 °C until assay. Samples were thawed on ice at 4 °C prior to preparation.
Quality control samples were prepared by aspirating and mixing equal amounts of each serum sample. 25 μL serum was pipetted into a 1.5 mL centrifuge tube, and then 170 μL pre-cooled methanol was added. The mixture was shaken at 1450 rpm for 15 min at 10 °C (MSC-100; Allsheng Instruments Co., Ltd., Hangzhou, China). After −20 °C for 20 min, the samples were centrifuged at 18,000 × g for 20 min at 4 °C (Microfuge 20 R, Beckman Coulter, Inc., Indianapolis, IN, USA). With a lyophilizer (Labconco, Kansas City, USA) 160 μL supernatant was lyophilized. Lyophilized powder reacted with 50 μL methoxamine solution at 37 °C for 2 h. Next, 50 μL MSTFA (Thermo-Fisher Scientific, Fairlawn, NJ, USA) was added, and the reaction continued for 1 h at 37 °C. All the standards (Sigma-Aldrich, St. Louis, MO, USA) were accurately weighed and prepared in water to obtain the individual stock solution at a concentration of 5.0 mg·mL−1. The appropriate amount of each stock solution was mixed to create stock calibration solutions.
Serum polyols were quantified using gas chromatography coupled with time-of-flight mass spectrometry (GC-TOF/MS) system (Pegasus HT, Leco Corp., St. Joseph, MO, USA) as previously described [18]. For separation, a Rxi-5Sil MS capillary column (30 m × 0.25 mm × 0.25 µm i.d., 0.25 μm film thickness; Restek Corporation, Bellefonte, PA, USA) was used. Helium was used as the carrier gas at a constant 1.0 mL/min flow rate. Derivatized samples (1 μL) were injected into the GC/MS instrument. The programmed column temperature was optimized for successful separation. The injection and transfer interface temperature were set to 270 °C. The source temperature was 220°C. Electron impact ionization (70 eV) was used for measurements in full scan mode (m/z 50–500). The acquisition rate was set to 15 spectra/s. The instrument was optimized every 48 h.
The original GC-TOF/MS data were processed using Chroma TOF software (v5.51, Leco Corp., USA) for peak integration, calibration, and quantification of each metabolite. The self-developed iMAP platform (v1.0, Metabo-Profile, Shanghai, China) was used for statistical analyses.
Statistical analysis
Continuous variables are shown as means ± standard deviation (SD) or medians (IQR) for skewed variables. Categorical variables are presented as numbers (proportions). Student’s t-test and Wilcoxon rank-sum test were used to compare continuous variables. For comparison of categorical data, the chi-square test or Fisher’s exact test was used.
As continuous variables, multivariate conditional logistic regression was used to assess the association between polyol levels and incident diabetes. Odds ratios (OR) with 95% confidence intervals [CI] were calculated. The first model was adjusted for matching variables, including sex, age, FBG, PBG, HbA1c, and BMI. The second model was further adjusted for fasting insulin levels, systolic blood pressure, diastolic blood pressure, hypertension history, and serum creatinine and ALT levels. The third model included the variables in Model 2 plus adjustments for current smoking status, alcohol consumption, and beverage intake. Baseline fasting xylitol levels were further grouped into tertiles. The unadjusted difference with a 95% CI was calculated between progressors and non-progressors. The odds of incident diabetes were calculated by comparing patients in the lowest tertile of xylitol levels. Subgroup analysis was conducted based on diabetes subtypes.
Spearman’s correlations were used to assess the relationship between fasting serum xylitol levels and changes in FBG, PBG, and HbA1c levels (follow-up levels minus baseline levels).
A two-sided P-value <0.05 was considered statistically significant. Statistical analyses were performed using SAS 9.3 software (SAS Institute, Cary, NC, USA).
Results
Characteristics of study participants at baseline
Table 1 shows the baseline characteristics of the 180 non-progressors and 180 progressors. Baseline age, sex, FBG, PBG, HbA1C, and BMI were well balanced between non-progressors and progressors. Lifestyle factors, including current smoking status, alcohol consumption, and beverage intake, were similar in each group. The progressors tended to have higher systolic blood pressure, diastolic blood pressure, and fasting insulin levels at baseline.
Fasting serum xylitol, sorbitol, and erythritol levels were assessed. Baseline xylitol levels in non-progressors were significantly higher than those in progressors (1.28 ± 0.25 vs. 1.19 ± 0.19, P <0.001) (Fig. 2). However, the sorbitol and erythritol concentrations did not differ between the two groups.
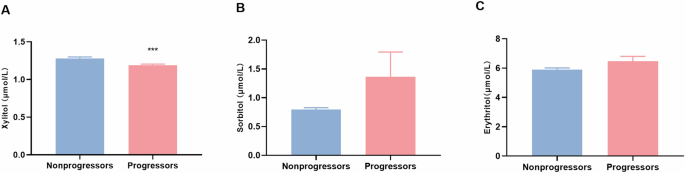
Comparison of baseline fasting serum xylitol (A), sorbitol (B), and erythritol (C) concentrations in non-progressors and progressors. Bars show the mean ± SD. ***p < 0.001.
Association of baseline serum xylitol levels with odds of prediabetes progressing to diabetes
A multivariate conditional logistic regression analysis was performed to clarify the association between polyols and diabetes progression. Baseline xylitol levels were associated with incident diabetes. In the matching variables adjusted Model 1, the estimated OR was 0.294 (95% CI 0.125–0.693). The association was consistent after further adjusting for fasting insulin levels, systolic blood pressure, diastolic blood pressure, hypertension history, serum creatinine, and ALT in Model 2 (0.279 [95% CI 0.115–0.674]). In addition, after adjusting for current smoking, alcohol consumption, and beverage intake at baseline in Model 3, an association was also observed (0.269 [95% CI 0.11–0.657]) (Supplemental Table 1).
The participants were then categorized into tertiles based on baseline fasting serum xylitol levels. Incident diabetes rates gradually decreased as the fasting serum xylitol tertile increased (Supplemental Fig. 1). Compared with the non-progressors, the progressors had lower proportions within the third tertile of xylitol levels (71/180 non-progressors [39.4%] vs. 49/180 progressors [27.2%]) and higher proportions within the first tertile of xylitol levels (45/180 non-progressors [25%] vs. 76/180 progressors [42.2%]). We further analyzed the association between xylitol tertiles and incident diabetes (Table 2). In Model 1, the estimated OR of diabetes for participants in the highest tertile of serum xylitol levels compared with that of those in the lowest tertile was 0.374 (95% CI 0.212–0.658). The final adjusted model had an OR of 0.338 (95% CI 0.182–0.628) in the highest tertile of serum xylitol levels.
Lower baseline fasting xylitol levels were associated with developed diabetes with isolated high fasting blood glucose
Compared with those in non-progressors, FBG and PBG levels were higher in progressors at 3.5 years follow-up than at baseline (Supplemental Table 2). Spearman correlation analyses further revealed that ΔFBG was negatively correlated with baseline fasting serum xylitol levels (r = −0.197, P <0.001). No correlation was observed between serum xylitol levels and ΔPBG or ΔHbA1c (Table 3). Progressors were divided into three subtypes according to FBG and PBG levels. The baseline fasting serum xylitol concentrations were lower in the F-DM and F-2h-DM groups than in the 2h-DM group (Fig. 3A).
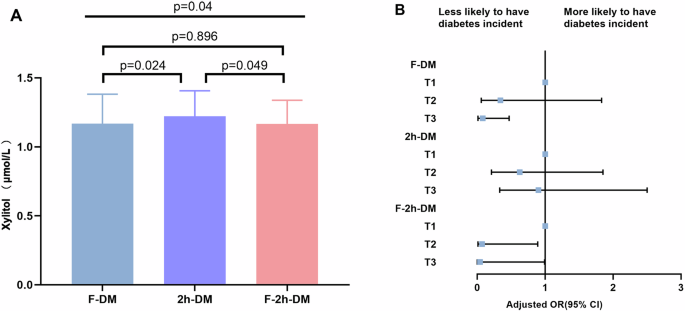
A serum xylitol levels of F-DM, 2h-DM, and F-2h-DM; B Forest plot of the association between xylitol levels and incident diabetes subtypes. The final model adjusted for gender, age, FBG, PBG, HbA1c, BMI, fasting insulin levels, systolic blood pressure, diastolic blood pressure, hypertension history, serum creatinine, ALT, smoking status, drinking status, and beverage intake.
The association between baseline fasting serum xylitol levels and incident diabetes was estimated across the three subtypes. Compared with the non-progressors, the proportion of F-DM was lower in the third tertile of xylitol levels (24/53 non-progressors [45.3%] vs.11/53 progressors [20.8]). In the fully adjusted model, the OR for the incidence of F-DM in the third tertile of xylitol levels was lower than that in the first tertile of xylitol levels (OR 0.08 [95% CI 0.014–0.467]). The decreased OR was also existed in the F-2h-DM group (OR 0.038 [95% CI 0.001–0.990]), but not in the 2h-DM group (OR 0.904 [95% CI 0.329–2.486]) (Fig. 3B and Supplemental Table 3).
Discussion
In this nested case-control study, we presented that the xylitol levels were lower in progressors than those in non-progressors. We demonstrated, for the first time, that elevated fasting serum xylitol levels were significantly associated with a lower risk of prediabetes progressing to diabetes, especially in patients with isolated fasting hyperglycemia.
Polyols are widely used as sugar substitutes in diabetic food formulations. However, little is known about the effectiveness of polyols in ameliorating diabetes progression. It has been reported that the circulating sorbitol and erythritol levels were higher in patients with type 2 diabetes mellitus [19, 20]. However, no significant differences were observed between non-progressors and progressors in terms of baseline serum sorbitol and erythritol concentrations in our study. While the baseline serum concentrations of xylitol were lower in progressors than in non-progressors after the 3.5-year follow-up. Xylitol has been reported to improve blood glucose levels in type 2 diabetes rats [21, 22]. Patients with diabetes consuming xylitol had 32.6% less insulin requirement [10]. Logistic regression analysis revealed that xylitol, not sorbitol or erythritol, was associated with incident diabetes. These results indicate that xylitol might have a protective effect against diabetes development.
It has been reported that intragastric xylitol was absorbed in a dose-dependent manner. Xylitol was barely detected in the circulation 3 h after the 7 g dose. It was detected in some participants after the comparatively higher doses (17 g dose and in all participants after the 35 g dose) [23]. Besides, Andrea et al. reported that there was no accumulation of xylitol in the circulation after they discontinued parenteral nutrition with xylitol and the serum levels returned to the baseline within 24 h [10]. In our study, we observed fasting xylitol levels in participants without extra xylitol intervention. When sugar-sweetened beverage consumption was adjusted in multivariate Model 3, the association between fasting serum xylitol levels and incident diabetes remained. In addition to food intake, endogenous xylitol is produced at approximately 5–15 g/day during the glucoronate–xylulose cycle [24]. Therefore, we speculate that fasting serum xylitol concentrations largely reflect endogenous xylitol production.
The glucoronate–xylulose cycle is primarily active in the liver and kidneys of mammals with the following reactions: glucuronate → L-gulonate →L-xylulose →xylitol →D-xylulose→Xylulose 5-P. Xylulose 5-P then enters the pentose-phosphate pathway and subsequently affects glucose metabolism in other pathways or continues to generate glucuronate [25]. Dehydrogenase plays an important role in this process. The deletion of the genes of glucuronate-xylulose cycle related enzymes could affect the xylitol yield [26]. One previous study has shown that serum fasting L-xylulose was elevated in diabetic patients [27]. Dicarbonyl/l-xylulose reductase (DCXR) is a highly conserved and phylogenetically widespread enzyme converting l-xylulose into xylitol. Low DCXR activity is implicated in age-related diseases including diabetes [28]. Therefore, the blockade of L-xylulose converting to xylitol is possibly involved in the diabetes progression.
Interestingly, elevated fasting xylitol concentrations were mainly correlated with improved fasting glycemia rather than with postprandial glycemia. After meal ingestion, multiple mechanisms are involved in glucose metabolism, including gastric emptying, intestinal glucose absorption, gastrointestinal hormones, and insulin secretion and action [29]. Xylitol has been reported to improve blood glucose levels through these mechanisms [30]. However, endogenous xylitol avoids gastrointestinal absorption and has less effect on gastrointestinal action. Fasting blood glucose levels are mainly determined by glycogenolysis and gluconeogenesis in the liver, which is also involved in endogenous xylitol metabolism. As mentioned above, xylitol participates in glycometabolism through the pentose-phosphate pathway. In a bioclock study, proteins within the pentose-phosphate pathway peaked during the circadian morning [31]. This suggests that endogenous xylitol is more effective in improving fasting hyperglycemia rather than postprandial hyperglycemia.
This study had several limitations. Firstly, it was a nested case-control study with a small sample size, which could not prove causality. Secondly, the detection method could not distinguish between endogenous and exogenous xylitol. Lastly, the roles of endogenous xylitol in the pathology of diabetes mellitus remain unclear.
In conclusion, we found that those with elevated fasting serum xylitol levels had a lower risk of progressing to diabetes. Importantly, we found that xylitol levels were negatively associated with changes in fasting glycemia. These findings suggest that fasting serum xylitol levels may serve as an important predictor and protective factor against diabetes development. However, to validate these findings, further prospective studies with larger sample sizes utilizing molecular probe techniques focused on hepatic carbohydrate metabolism intervened by xylitol are needed.


Responses