Emergence of exchange bias in van der Waals magnetic alloy CrxPt1−xTe2

Introduction
There is great interest in van der Waals (vdW) magnetic systems in part because they are highly tunable through an applied electric field1, strain2, chemical doping3,4, and through adjusting the carrier density5,6. However, air sensitivity is a common problem in such materials. For example, Fe3GeTe2 and CrGeTe3 oxidize on the order of minutes7,8, while other systems such as CrI3 liquefy even under an insulating cap9. Thus, the development of air-stable vdW magnets is an important goal for practical purposes.
Recently, CrxPt1−xTe2 (CPT) has emerged as a highly air-stable, out-of-plane vdW ferromagnet in bulk crystals10. CPT has the fascinating property that it self-organizes into an atomic-scale magnetic superlattice when the average Cr concentration (x) is above ~40%. While the Cr concentration is homogeneous for x < 40%, for higher concentrations, the thermodynamically stable phase has a Cr concentration that alternates each vdW layer between a high concentration (“Cr-rich”) and a low concentration (“Cr-poor”). For instance, for an average Cr concentration of 45%, the vdW layers alternate between ~65% for the Cr-rich layer and ~25% for the Cr-poor layer10. This could be viewed as an atomic-scale analog of metallic magnetic multilayers, which have exhibited rich phenomena such as exchange bias in hard/soft magnetic bilayers11, exchange spring magnets in hard/soft magnetic multilayers12, giant magnetoresistance13, and interlayer magnetic coupling14. This makes CPT an interesting material to study, but the magnetic properties of exfoliated samples have yet to be investigated.
In this paper, we report magneto-optical experiments on exfoliated multilayer CPT that reveal an unusual exchange bias effect that occurs without an adjacent antiferromagnetic (AFM) layer. Exchange bias, identified by the lateral shifting of the magnetic hysteresis loop, typically occurs in bilayers of a ferromagnetic (FM) and an AFM layer, where the AFM provides an effective magnetic field on the interfacial FM spins via quantum mechanical exchange interactions15,16. Therefore, observing exchange bias in CPT without an adjacent AFM layer is surprising. Notably, experiments show that exchange bias is present in samples with average Cr concentration x of 45% (“CPT-45%”) while absent for 35% (“CPT-35%”), which correlates with the appearance of layer-modulated Cr concentration for x ≥ 40%. To gain insight into the origin of the exchange bias, we perform Monte Carlo simulations of CPT-45% and find that key features of the experimental data, including the exchange bias shift, are recreated using exchange parameters determined from density functional theory (DFT) calculations. We find that the presence of FM and AFM intralayer couplings and sufficiently high Cr concentration within a vdW layer can cause some Cr moments to become frozen and not switch during a hysteresis loop simulation. These frozen moments, in turn, create a static exchange field that produces an exchange bias shift of the FM’s hysteresis loop, as observed in our experiments. The emergence of this unusual exchange bias effect highlights new possibilities for introducing and tuning magnetic properties in air-stable vdW magnetic materials via alloy concentration.
Results
Experimental results
The samples were mechanically exfoliated from bulk crystals of CPT. A detailed discussion of their synthesis, structural properties, and magnetic properties is provided in Huey et al.10. Here, we highlight relevant information and present characterization of samples used in this study. CPT was grown from stoichiometric mixtures of the elements using traditional quartz tube reactions for powders and slow cooling of the melt for crystals. Structural characterization by powder XRD and single-crystal XRD showed that the trigonal 1T P(bar{3}m1) structure of PtTe2 was maintained for x < 0.40. However, for 0.40 ≤ x ≤ 0.45, Cr/Pt site ordering between layers was observed, resulting in a two-layer 2T structure that retains P(bar{3}m1) symmetry as shown in Fig. 1a10. For Cr concentrations of 50% and higher, trace amounts of Cr2Te3 phases begin to appear. Figure 1b shows representative powder XRD scans for CrxPt1−xTe2 with x = 0, 0.35, 0.45. Rietveld analysis of the CPT powders produced a much better fit when Cr was alloyed onto the Pt site rather than intercalated onto the octahedral or tetrahedral hole in the van der Waals space. This matched the single-crystal diffraction analysis and confirmed the absence of Cr intercalation. The linear evolution of the lattice parameters with Cr concentration further confirmed alloy rather than intercalation behavior10. Importantly, in all samples studied here, no reflections of other CrxTey phases were observed, including CrxTe, CrTe, Cr2Te3, and Cr5Te8.

a Visualization of the Cr-45% structure. The top image shows the atomic structure, while the bottom image illustrates the alternating concentration of Cr in the van der Waals layers, with Pt, Cr, and Te atoms in yellow, blue, and red, respectively. b Powder X-ray diffraction of CPT-45% (red), CPT-35% (gray), and PtTe2 (yellow) shows the introduction of a new 001 peak for CPT-45%, indicating the doubling of the unit cell along the c-axis (perpendicular to the van der Waals layers). The broad hump observed at ~15° corresponds to a background signal from the sample holder. c Superconducting quantum interference device (SQUID) magnetometry measurements of hysteresis loops of bulk CPT-45% at several temperatures with field applied along the c-axis. d Optical microscope image of an exfoliated sample of CPT-45% on Si/SiO2 substrate. This sample is approximately 300 nm thick.
The doubling of the unit cell along the c-axis from 1T to 2T is evident by the emergence of an additional peak at 2θ ~ 8° (labeled ‘100’) in the x = 0.45 pattern that is absent for the x = 0.35 pattern of Fig. 1b. This expansion of the unit cell is due to partial site ordering of the metal atoms with one layer of the new cell being Cr-rich and the other being Cr-poor, as illustrated in Fig. 1a and reported previously in Huey et al.10.
To understand the magnetic behavior of CPT-45% bulk crystals, we measured magnetic hysteresis loops at several temperatures by superconducting quantum interference device (SQUID) magnetometry. For these measurements, the field was applied along the c-axis of the crystal. In Fig. 1c, the coercivity decreases as the temperature increases from 2 to 50 K. Above 50 K, the CPT-45% coercivity is nearly zero, and the nonlinear hysteresis loops persist up to about 180 K.
To further investigate the magnetic behavior of CPT-45%, we measured reflective magnetic circular dichroism (RMCD) on the exfoliated flakes, such as that shown in Fig. 1d. Details of the exfoliation and RMCD measurement are discussed in the “Methods” section. Figures 2, 3a, and 4 show the out-of-plane RMCD magnetic hysteresis loops for CPT-45% and CPT-35%, which exhibit contrasting behaviors.
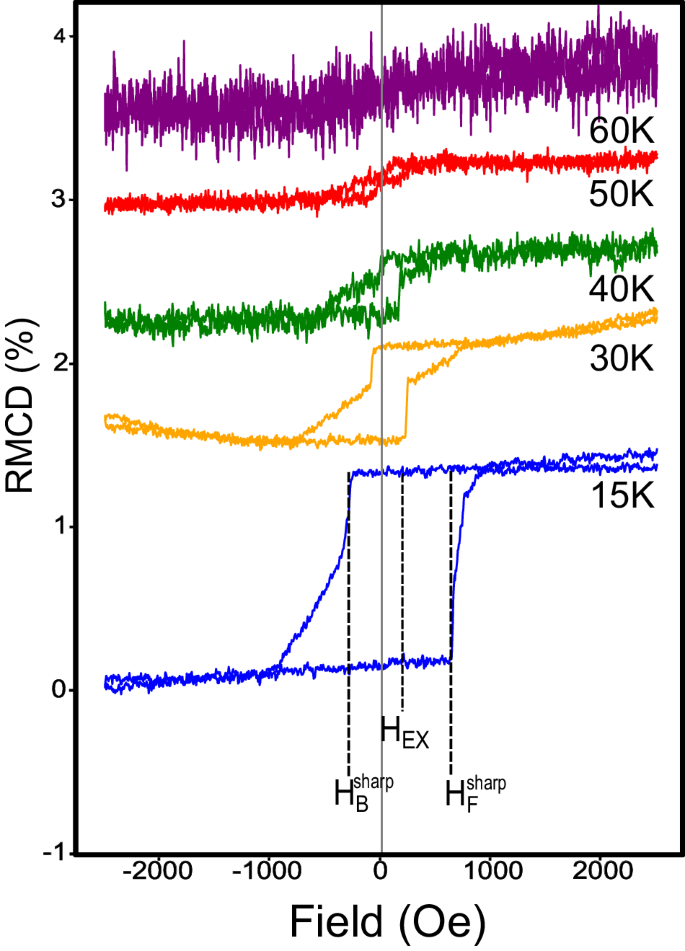
Dashed lines indicate the field of ({H}_{{rm {F}}}^{{{{rm{sharp}}}}}) and ({H}_{{rm {B}}}^{{{{rm{sharp}}}}}) in the hysteresis loop. The dashed line at the center of the sharp loop indicates the exchange bias field HEX.
In Fig. 2, a ~300 nm-thick CPT-45% sample was cooled from room temperature to low temperature with no applied magnetic field. At a temperature of 15 K (blue loop), the forward sweep shows a sharp switching of the magnetization at ({H}_{{rm {F}}}^{{{{rm{sharp}}}}} sim 650) Oe followed by a more gradual magnetization change. The backward sweep has another sharp switching at ({H}_{{rm {B}}}^{{{{rm{sharp}}}}} sim -290) Oe followed by a more gradual magnetization change. Considering just the sharp switchings, the hysteresis loop has an overall shift to the right, and we define an exchange bias field at the center (average) of the two sharp switchings, or ({H}_{{rm {EX}}}=({H}_{{rm {F}}}^{{{{rm{sharp}}}}}+{H}_{{rm {B}}}^{{{{rm{sharp}}}}})/2 sim) 190 Oe. The coercivity of the sharp switch decreases quickly and appears to vanish above 40 K. On the other hand, the gradual change persists to higher temperatures. At 50 K when the sharp switch is gone, we still see a gradual linear change between the saturation points. At 60 K and higher, we are unable to discern magnetic signals above the noise level. Specifically, the absence of sharp switching and the presence of drift in the MOKE signal makes it difficult to discern magnetic signals from the background.
Figure 3 illustrates the effect of field cooling on the exchange bias field. For these measurements, the sample was cooled from 300 K to base temperature in a constant applied magnetic field. Figure 3a compares two field-cooled hysteresis loops measured at 15 K. For a −3000 Oe field cool (blue), the forward sweep shows a sharp increase from saturation to an intermediate magnetization at ({H}_{{rm {F}}}^{{{{rm{sharp}}}}} sim 700) Oe followed by a gradual magnetization change until ~ 1030 Oe. The backward sweep has another sharp change at ({H}_{{rm {B}}}^{{{{rm{sharp}}}}} sim -260) Oe to an intermediate magnetization followed by a more gradual change in magnetization until ~−1030 Oe. This leads to an exchange bias field of HEX ~ 220 Oe. For a +3000 Oe field cool (red), the sharp switchings occur at ({H}_{{rm {F}}}^{{{{rm{sharp}}}}} sim 260) and ({H}_{{rm {B}}}^{{{{rm{sharp}}}}} sim -620) Oe, leading to an exchange bias field of −180 Oe. The reversal of HEX, when the cooling field is reversed, is the typical behavior for exchange bias. The saturation fields associated with the gradual magnetization reversal for both loops is ~±1030 Oe.
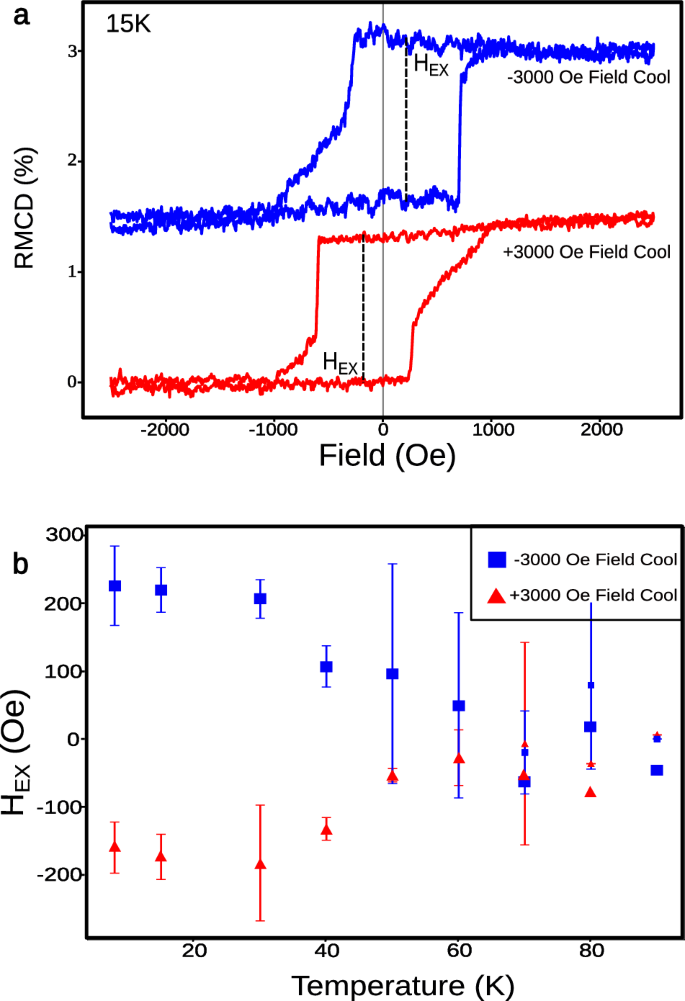
a Out-of-plane RMCD magnetic hysteresis loops at 15 K after field cooling in −3000 Oe (blue) or +3000 Oe (red) for CPT-45%. Dashed lines indicate the exchange bias field HEX. The hysteresis loops are offset for clarity. b Plot of the HEX as a function of temperature for negative field cool (blue data points) and positive field cool (red data points).
Lastly, we measured the exchange bias field as a function of temperature for both positive and negative field cooling (Fig. 3b). For these measurements, the samples were field-cooled, and then the temperature was increased and stabilized for each hysteresis loop. Apart from the opposite sign, similar behavior is observed for positive and negative field cooling. The magnitude of the exchange bias field decreases moderately from 15 to 60 K and disappears above 60 K. In contrast to zero-field cooling, the field cool causes the hysteresis loops to persist to higher temperatures (the data is shown in section S1 of the Supplemental Information, SI). The observed magnetic properties are consistent with the exchange bias that is normally observed in FM/AFM bilayers, but the origin of the effect in CPT is unclear since no AFM layer is present.
To gain further insight, we performed the same experiments on a ~300 nm thick CPT-35% sample (Fig. 4). Unlike for CPT-45% (Figs. 2 and 3a), we did not observe an exchange bias field for CPT-35% for both zero field cooling and field cooling. Figure 4 shows RMCD from a CPT-35% sample that was measured after field cooling in a +3000 Oe out-of-plane field. At 20 K (blue loop), the switching fields of the forward and backward sweeps are of the same magnitude, ~800 Oe, yielding a zero exchange bias field. The zero exchange bias persists at higher temperatures up to the disappearance of FM hysteresis at 60 K.
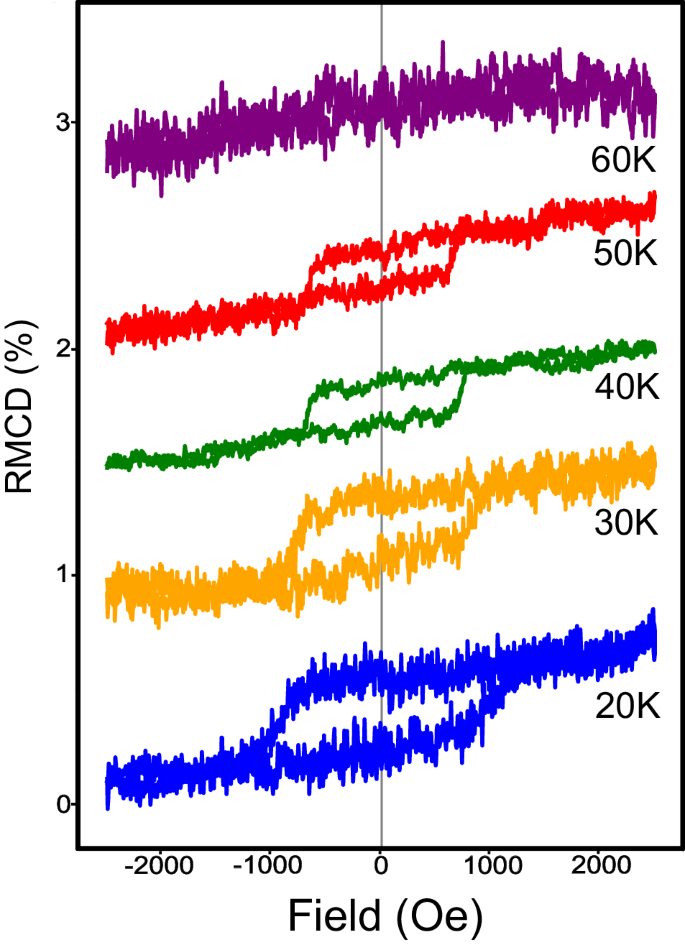
The sample was cooled in a field of +3000 Oe prior to these measurements.
The presence of exchange bias for CPT-45% and its absence for CPT-35% coincides with the presence or absence of modulated Cr concentration as shown in Fig. 1a and b. To investigate whether the modulated Cr concentration is connected to the emergence of exchange bias, we performed Monte Carlo simulations for the hysteresis loops of Cr0.45Pt0.55Te2 and Cr0.35Pt0.65Te2, as discussed in the following sections.
Monte Carlo simulations
We performed Monte Carlo simulations to develop insight into the origin of the exchange bias in the CPT-45% system. We model the system using a Heisenberg spin model under a Metropolis algorithm using a cone model17. Our standard simulation had 8 layers of 8 × 8 sites with periodic boundary conditions on a hexagonal lattice. We summarize the key points here and provide details of the procedure in the SI, section S2.
The system is modeled by the Hamiltonian
where ({hat{{{{bf{m}}}}}}_{i}) is the unit vector of a Cr magnetic moment, μ is the magnitude of a Cr magnetic moment in units of Bohr magnetons (i.e. μ, is dimensionless), the Jij terms are the pairwise exchange parameters, Bext is the external magnetic field, and K is the uniaxial anisotropy energy per Cr atom. For ({{{mathscr{H}}}}) in units of eV, the parameters Jij, Bext, and K are also in units of eV. The magnetic dipolar coupling is ignored. We included the interlayer exchange couplings of a Cr magnetic moment with its nearest-neighbor layers and next-nearest neighbor layers and treated the interactions in the mean field approximation. As discussed in the SI section S3, the exchange bias is roughly independent of interlayer exchange. For the intralayer exchange parameters and uniaxial anisotropy, we utilized values calculated for CrTe2 by DFT by Abuawwad et al.18. Because the dominant exchange interaction is suggested to be the super-exchange from the telluride bonds19, the alloy exchange should be similar to studies of CrTe2 exchange. We consider intralayer exchange parameters from the first to the fourth nearest neighbor pairs, which include ferromagnetic (J2, J3) and antiferromagnetic (J1, J4) couplings (see Table S1 of the SI for numerical values). Cr atoms were assigned a unitless magnetic moment vector ({hat{{{{bf{m}}}}}}_{i}) with a magnitude of 1, and Pt locations were assigned a moment vector with a magnitude of 0. We populated the magnetic moment sites on the model randomly based on the Cr concentration in each layer in the CPT-45%, where moments were assigned to sites with a 65% probability for Cr-rich layers and with a 25% probability for Cr-poor layers. These populations were determined from the composition indicated by the XRD results. The system was initialized with random moment directions at each site. To simulate the field cool, a uniform out-of-plane magnetic field was applied, and the simulation was run at 300 K. The simulation was run for ~10 × the number of steps needed for the system to reach a metastable state. This was repeated at the same applied field for decreasing temperatures eventually down to 1 mK, which was the temperature used for simulating the hysteresis loop. To generate a hysteresis loop, the magnetic field was varied in steps of 0.025 eV, and the simulation found a new metastable state at each step. We refer to a particular arrangement of Cr atoms as an ‘atomic configuration,’ a particular arrangement of Cr magnetic moment vectors as a ‘magnetic configuration,’ and a Monte Carlo simulation on a particular atomic configuration as a ‘run.’
We use the simulations to gain a qualitative understanding of the system. In the presence of uniaxial anisotropy K, the system relaxed into the ground state of an out-of-plane ferromagnet with in-plane magnetization, often on the order of ~1% of the overall magnetization.
Figure 5 shows representative hysteresis loops for the sum of all Cr-rich layers (left loop) and Cr-poor layers (right loop). Surrounding the loops are diagrams of the magnetic moment vector distributions at selected states around the hysteresis loop for the Cr-rich (R1–R5) and Cr-poor (P1–P5) layers. The hysteresis loops were obtained after field cooling from 300 K in a 200 meV field in the −z direction.
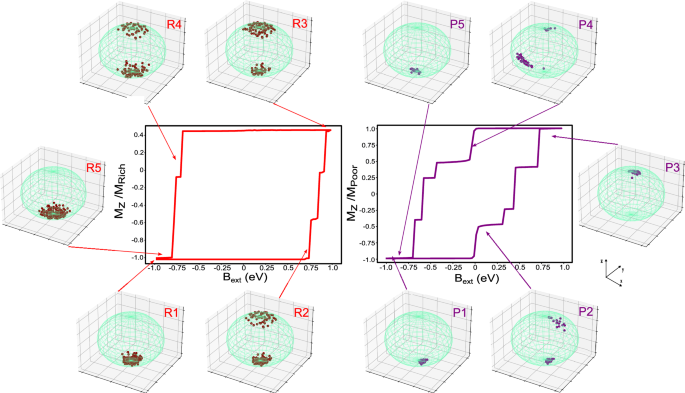
(Left) The simulated hysteresis (red) of the Cr-rich layer with labels for different points on the loop. The simulated magnetization of the combined alloy is recorded every 0.0125 eV. Surrounding the hysteresis loop and labeled with their positions on the loop is a representation of the distribution of Cr moments. Each dot on the green spheres is at the same azimuthal and polar angle as a moment in the simulation. We visualize the moment distribution at each point on the hysteresis loop. (Right) The simulated hysteresis loop (purple) of the Cr-poor layer is surrounded by illustrations of their angular distributions.
We first consider the hysteresis loop of the Cr-poor layer. The hysteresis loop begins in the −z saturated state (P1). As the field sweeps from −1 eV towards +1 eV, some moments in the Cr-poor layer begin rotation towards the +x-axis in addition to switching from −z to +z (P2). The Cr-poor layers rotate and switch toward saturation in the +z direction (P3). On the return sweep of the loop, the rotation takes a different path than the rotation of the forward sweep, rotating toward the −x-axis (P4). The differing paths contribute to differing slopes on the forward and backward loops, determined by the rotation path and the portion of the moments that flip instead of rotate. Finally, the poor layer returns to saturation in the −z direction (P5).
For the hysteresis loop of the Cr-rich layer, the moments switch suddenly in large groups, in contrast to the slow rotation of the Cr-poor layer. Beginning with moments aligned along −z (R1), sweeping the field from −1 to +1 eV causes the moments to switch rapidly (R2 is during the switch), and the magnetization reaches a saturation-like plateau at R3. Looking at the magnetic moment vector distribution at R3 shows that some of the moments are unable to switch and we refer to these moments as being “frozen.” On the backward sweep, the moments again exhibit a sharp switch at R4 and eventually become saturated along −z (R5). Notably, the switching fields on the forward sweep and backward sweep are not equal, so the loop has an exchange bias shift. The switching fields are determined by the initial magnetic configuration, which is determined by field cooling.
Not all of the randomly generated atomic configurations for CPT-45% exhibit frozen moments. Only about 15–20% generate exchange bias shifts in their hysteresis loops. However, once such an atomic configuration is found, subsequent runs of the Monte Carlo simulation reliably produce exchange bias shifts. In addition, if the cooling field is reversed for the same atomic configuration, the orientation of the frozen moments flips, and the HEX reverses sign. From this, we interpret HEX as originating from an effective exchange field generated by the frozen moments.
Discussion
An important question to consider is, how do the moments become frozen? Due to the presence of antiferromagnetic exchange interactions (J1 and J4, see SI Table 1), the ground state is not a simple ferromagnetic state with collinear moments. At the same time, strong antiferromagnetic order is also not observed in the moment vector distributions in Fig. 5. For instance, in the R1 and R5 distributions, the moments generally point along the −z direction, and there are no moments pointing near the +z direction, so there is not a strong antiferromagnetic state among the frozen moments. Thus, it is not necessary to have antiferromagnetic clusters to realize the exchange bias (this could be another possible scenario to generate exchange bias, but it is not supported by these simulations).
Instead, randomly distributed moments in the presence of both antiferromagnetic (J1, J4) and ferromagnetic (J2, J3) exchange couplings may produce a complex energy landscape replete with local energy minima due to the magnetic frustration. If these local energy minima were much deeper than the thermal energy and the Zeeman energy, then the moments would become frozen. This is analogous to a glassy transition in spin glasses, where spins become frozen below the transition temperature. In fact, there are a number of parallels to spin glass systems, including the induced exchange bias when adjacent to a ferromagnet20. But there are notable differences. In CPT-45%, spins exhibit spontaneous magnetization and switch in an external magnetic field, whereas spin glasses generally have zero net magnetization in the absence of an external field. Spin glasses are also generally the result of randomly distributed Ruderman–Kittel–Kasuya–Yosida (RKKY) interactions on coupled moments, whereas CPT-45% of moments interact through super-exchange. Furthermore, not all of the moments in CPT-45% are frozen. Thus, only a subset of moments are trapped in a local energy minimum, while the other moments are free to switch. These frozen moments act as pinned, uncompensated moments similar to those at the interface of ferromagnet-antiferromagnet and ferromagnet-spin glass interfaces.
To test the idea of a complex system with many local energy minima, we ran Monte Carlo simulations in an external magnetic field of 200 meV oriented along +z from an initial magnetic configuration where each moment points in a random direction.
We performed 10 runs at a simulation temperature of 1 mK with the same initial magnetic configuration and same atomic configuration (Fig. 6a and b). Figure 6b shows the evolution of the magnitude of the total magnetic moment of the system, where the magnitude is normalized to have a value of 1 when all the moments align (i.e., (| mathop{sum }nolimits_{i = 1}^{N}{hat{{{{bf{m}}}}}}_{i}| /N), where N is the number of Cr moments). In all 10 runs, the net moment gradually evolves to align toward the external field.
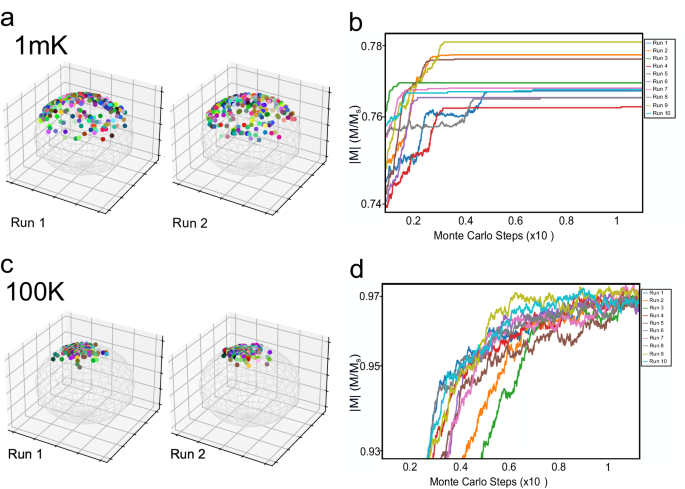
a, c We observe the distributions of moments for a specific atomic configuration where it settles into different magnetic configurations at 1 mK (100 K) under a +200 meV field. The moments of Cr sites are distributed on a pair of unit spheres. Each Cr site in the atomic configuration is represented by a unique color. The two spheres represent different magnetic configurations reached by the atomic configuration under different runs. b, d The magnitude of the magnetization for different runs (see legend) at 1 mK (100 K) as a function of Monte Carlo steps, in units of Cr moment per simulation cell (with 8 × 8 × 8 sites).
Interestingly, the total magnetic moment evolves to similar but distinct final values for each run, signifying different final magnetic configurations. Figure 6a shows the final angular distributions of Cr moments for two of the runs, where each Cr moment is represented by a unique color on the sphere. The final magnetic configurations in both cases have the moments oriented generally toward the +z direction of the applied field and have a relatively wide spread of vector components in the x and y directions. Comparing the colors of the spheres of the two runs shows that the system gets trapped in different local minima with different magnetic configurations for the final state.
In contrast, for a higher simulation temperature of 100 K (Fig. 6c and d), the total moment consistently reaches a similar value, and this value is larger than for the 1 mK simulations. At 100 K, thermal fluctuations allow the system to escape the local energy minima of the 1 mK simulation, and the moments are more well-aligned.
To summarize, these studies show that for low temperatures, the system becomes trapped in different final states with different magnetizations for each run of the simulation, indicating the presence of multiple local energy minima. At higher temperatures, there is sufficient thermal energy to escape the local energy minima and have magnetic moments that align better with the external field, yielding more similar values of final magnetization from run to run. These observations confirm the presence of a complex energy landscape with many local energy minima.
Another interesting question is, how does the presence of frozen moments depend on the Cr concentration? While we have not performed a comprehensive study, some characteristics are apparent. While the CPT-45% samples show exchange bias in both the simulations and experiments, the CPT-35% samples do not (Fig. 4 for experiment, Fig. S6 for simulation). Due to the composition modulation of the CPT-45%, the layer concentration of Cr is boosted to 65% for the rich layer, substantially higher than the uniform 35% for CPT-35%. The antiferromagnetic nature of J1 for the nearest neighbor coupling should enhance the frustration with increasing Cr composition, as this will increase the number of nearest-neighbor Cr atoms. This may provide some intuition for generating frozen moments as Cr concentration is increased. But this behavior should have a limit, as the x = 100% case corresponds to CrTe2 which behaves as a ferromagnet21 in the bulk. In this limit, the system is much less disordered.
Thus, we imagine a range of Cr concentrations with sufficient disorder and frustration to realize frozen moments and exchange bias. Further theoretical studies beyond the scope of this work are needed to identify the parameter space for realizing this type of exchange bias.
The Monte Carlo simulations are valuable because they provide insight into the exchange bias, but they should not be considered as a realistic model of the physical system. For example, since dipolar interactions are ignored, domain structures that might exist in experiments would not form in the simulations. Furthermore, magnetization reversal often occurs by domain wall motion, which is not captured well in our small simulation volume (8 × 8 × 8 atomic sites). In addition, our simulation simplifies exchange interactions significantly, especially when more complicated interlayer interactions may be important, as in similar systems21,22,23,24,25. Thus, we would not expect the simulations to capture all aspects of the experimental hysteresis loops. Nevertheless, the realization of frozen moments in the simulations provides a way to investigate the origin of the exchange bias.
Conclusion
In conclusion, our magneto-optic studies of the magnetic properties of exfoliated multilayer CrxPt1−xTe2 (CPT) have revealed a remarkable exchange bias effect in the absence of an adjacent antiferromagnetic (AFM) layer. The emergence of exchange bias in CPT-45%, but not in CPT-35%, correlates with the atomic-scale modulation of Cr concentration in the van der Waals layers, demonstrating unique magnetic behavior in air-stable van der Waals magnetic materials. Monte Carlo simulations reveal a possible microscopic origin of the emergent exchange bias. In simulated hysteresis loops exhibiting an exchange bias shift, we observe frozen moments within the Cr-rich layers of CPT-45%. These frozen moments arise from the complex interplay of intralayer ferromagnetic and antiferromagnetic couplings in layers with sufficiently high Cr concentration and generate a static exchange field. This exchange field results in an exchange bias shift in the ferromagnetic hysteresis loop. As exchange bias is an essential component for pinning reference ferromagnetic layers in giant magnetoresistance (GMR) and tunneling magnetoresistance (TMR), hard drive read heads26 and in spin-transfer torque random access memory (STT-RAM)27, the current findings expand scientific knowledge in technologically relevant phenomena. Moreover, this study provides valuable insights into the fundamental magnetic properties of CPT and similar van der Waals magnetic materials, creating novel pathways for engineering magnetic functionalities in two-dimensional materials for potential spintronics applications in information storage, processing, and magnetic sensing.
Methods
Sample preparation
Samples were mechanically exfoliated from bulk crystal using the scotch tape method in a glove box and transferred onto Si wafers with a 285 nm SiO2 layer. We used atomic force microscopy to measure the thickness of samples. Figure 1d shows a ~300 nm-thick CPT-45% sample, which is the typical thickness used in this study. We confirmed air stability by comparing optical microscope images within the glove box and after the sample had been removed to air. We observed no visible changes due to oxidation after extended air exposure (>1 week).
RMCD characterization
We placed the samples in a Montana Instruments magneto-optic cryostat with an internal mirror set-up to measure hysteresis using an out-of-plane field. We measured reflective magnetic circular dichroism (RMCD) on the exfoliated flakes using a 532 nm continuous wave laser with a power of 135 μW. A Mitutoyo 50 × objective focused the beam to a ~2–3 μm spot size. A photoelastic modulator was used to modulate the helicity of the excitation beam between left and right circularly polarized light at a frequency of ~50 kHz, and the intensity I of the reflected beam was detected by a photodiode whose amplifier outputs a voltage V proportional to the intensity. A lock-in amplifier was used to measure the modulated photodiode voltage, yielding a lock-in signal ({V}_{{rm {lock-in}}}=frac{{V}_{{rm {RCP}}}-{V}_{{rm {LCP}}}}{2sqrt{2}}) since the lock-in returns the RMS variation and VRCP−VLCP is the peak-to-peak variation (i.e. double the amplitude). Thus, the RMCD ratio is (frac{{I}_{{rm {RCP}}}-{I}_{{rm {LCP}}}}{{I}_{{rm {RCP}}}+{I}_{{rm {LCP}}}}=frac{{V}_{{rm {RCP}}}-{V}_{{rm {LCP}}}}{{V}_{{rm {RCP}}}+{V}_{{rm {LCP}}}}=frac{2sqrt{2}{V}_{{rm {lock-in}}}}{2{V}_{{rm {DC}}}}), where VDC is the average DC photodiode signal. To obtain hysteresis loops, we started at −2500 Oe, ramped up to 2500 Oe (forward sweep), and back down to −2500 Oe (backward sweep) while measuring RMCD, and averaged over several loops. For some loops, a linear background has been subtracted for the forward sweep and the backward sweep to compensate for signal drift.
Responses