Endosomal pH is an evolutionarily conserved driver of phenotypic plasticity in colorectal cancer

Introduction
Perturbation of pH dynamics, manifested by cytoplasmic alkalization and extracellular acidosis, has long been established as a hallmark of cancer metabolism1. In contrast, the roles of endosomal pH modulation in tumour progression are incompletely understood, despite mounting evidence linking a key endosomal pH regulator Na+/H+ exchanger NHE9 (gene name SLC9A9) to several cancers2,3. Investigations into the evolutionary origins of the Na+/H+ exchanger (NHE) family revealed that NHE9 belongs to an intracellular clade that regulates organellar pH, which is ancient and distinct from the plasma membrane NHE that regulates cytosolic pH4. NHE9 is a transport nanomachine predicted to have an exceptionally high exchange rates of ∼1500 ions per second that could explain its associations with a plethora of human diseases besides cancer, such as autism, neurodegeneration, and coronavirus disease (COVID-19)5,6,7,8,9,10,11. Mechanistically, NHE9 functions as an evolutionary conserved dominant leak pathway or a tunable valve for endosomal protons, counteracting the activity of the proton pumping V-ATPase to precisely set the luminal pH8,9,10,11.
Given the importance of endosomes as a hub in cancer cell signalling, endosomal pH emerges as an important regulator of trafficking and turnover mechanisms, as well as cell-microenvironment communications and responses to a variety of cues such as hypoxia, nutrient availability, and signals from stroma and immune cells2,3. Endosomal NHEs may regulate intracellular vesicle traffic by modulating soluble N-ethylmaleimide-sensitive factor attachment protein receptor (SNARE) signalling, which has been found to support exosome secretion, invadopodia formation, and increased membrane traffic in transformed cells12,13,14. However, how subtle changes in endosomal pH impose specific gene expression programs that can determine aggressiveness or therapeutic response, and whether endosome reprograming in response to micro-environmental signals such as inflammation or cell intrinsic signals such as oncogene activation acts as a master regulator of phenotypic plasticity is poorly understood.
Colorectal cancer (CRC), noted for its aggressive phenotype and metastatic potential15, is an attractive model for dissecting the complex relationships between endosomal acid base homeostasis and tumour progression. A genome-wide scan for CRC susceptibility genes identified a linkage to chromosome 3q, with SLC9A9, the gene encoding NHE9, being one of the candidates16. Studies on mutation and single-nucleotide polymorphism analysis also revealed a link between NHE9 and CRC15,17. Stronger evidence emerged from studies demonstrating that high expression of NHE9 in primary CRC is associated with increased liver metastases18. Interestingly, the NHE9 promoter is one of the top ten hypo-methylated promoters in colon cancer19, and NHE9 has also been reported as a direct target of miRNA let-7f, a known tumour suppressor in CRC20,21. These observations led us to consider a broader role for endosomal pH in CRC. Combining experimental and computational analysis, we recently demonstrated that NHE9-mediated endosome alkalinisation is a pseudostarvation-induced invasion state that contributes to the maintenance of repressed cyclic AMP (cAMP) levels in the cytosol in CRC cells19.
Deciphering the molecular mechanisms underlying the invasiveness and adoption of a tumour-initiating phenotype of NHE9-high CRC cells is crucial to understanding the intricate link between endosomal pH and cancer progression. Here, by constructing and simulating the dynamics of a minimal regulatory network featuring established interactions among regulators of epithelial to mesenchymal transition (EMT), we show that NHE9 delays the transition to a mesenchymal state, enabling cancer cells to maintain hybrid E/M phenotypes with migratory and invasive traits. We validated our model prediction by stably transducing CRC cells with NHE9-encoding SLC9A9 and employed RNA-sequencing analysis for deconvolution of transition trajectories on a two-dimensional EMT plane. Taken together, our findings support the notion that NHE9-driven phenotypic plasticity along the invasion-metastasis cascade leads to successful invasion and expansion of cancer cells at distant sites. Rational targeting of endosomal pH opens up new avenues for cancer therapy.
Results
NHE9 regulates endosomal homeostasis to sustain colorectal cancer cell fitness
As an initial approach to understanding the relationship between NHE9 and phenotypic parameters that drive cancer evolution, we interrogated data from the NCI-60, a panel of 60 human tumour cell lines derived from different tissues of origin. Curiously, the epithelial marker was the most inversely associated phenotypic trait with NHE9 expression, suggesting relatively low expression of NHE9 among NCI-60 epithelial consensus (NEC) cell lines22 (Fig. 1a). Indeed, the NCI-60 gene expression profile for NHE9 is nearly a mirror image of CDH1/E-cadherin (and hence of NEC genes in general), and the pattern of selectively low NHE9 expression may be a signature for the epithelial character of human tumour cells (Supplementary Fig. 1a).

a Volcano plot depicting the association of NHE9 levels with phenotypic parameters that drive cancer evolution based on the NCI-60 database. b Gene effect scores for the NHE9 and NHE6 from CRISPR knockout screens in colorectal cancer (CRC) cell lines. Scores were normalised so that nonessential and essential genes had median scores of 0 and -1 across cell lines, respectively. c Mutation frequencies of NHE9 and other cancer drivers in each of the hypermutated CRC samples from the TCGA database. For each tumour, microsatellite instability (MSI) status, MLH1 silencing, as well as mutational status are indicated as per the legend above. d Lollipop plot of NHE9 mutations identified in hypermutated CRC samples. The x-axis represents the amino acid positions of NHE9. e Side (left) and top (right) views of the dimer of the NHE9 transport domain, coloured according to the degree of ConSurf conservation, with green to purple denoting variable to conserved amino acid positions. NHE9 mutations found in hypermutated CRC are shown as alpha-carbon spheres. The conservation colour bar is displayed at the bottom. f NHE9 expression in CRC relative to healthy control samples (GSE4107) represented as scatter plots displaying mean ± SD. g Overview of all three EMT scoring metrics. The illustration was created with BioRender. h Scatter plots depicting the relationship between NHE9 expression and all three EMT scores in CRC and healthy control samples (GSE4107). P values were calculated by Pearson’s correlation (a, h) and unpaired, two-tailed t test (f). See related Supplementary Fig. 1.
We further explored data from CRISPR knockout screens of CRC cell lines to determine whether NHE9 is essential for phenotype-specific dependence. As shown in Fig. 1b, NHE9 knockout in CRC cell lines resulted in negative gene effect scores, suggesting that gene deletion inhibited cell growth and/or caused cell death. Notably, the median gene effect score for NHE9 (SLC9A9) is close to 1, suggesting that it is an essential gene regulating proliferative fitness23 (Fig. 1b). By contrast, deletion of the related endosomal NHE6 (SLC9A6) isoform produced a median gene fitness effect score close to 0, suggesting that it is a nonessential gene23 (Fig. 1b).
We next interrogated the Cancer Genome Atlas (TCGA) database to assess the role of tumour-specific mutations in NHE9 in CRC. Intriguingly, in the more common non-hypermutated class of CRC, NHE9 is rarely mutated, accounting for around 0.5% of cases15. In stark contrast, in hypermutated CRC, which accounts for around 16% of all cases of CRC, NHE9 is one of the most frequently mutated targets, accounting for 31% of cases, on par with some of the most well-known cancer drivers15 (Fig. 1c). Importantly, NHE9 mutations associated with hypermutated CRC localise throughout the coding frame, including the membrane-embedded transport domain and the C-terminal cytoplasmic tail (Fig. 1d, e). Most of these mutations are predicted to result in dysregulation of transport function, as assessed by evolutionary conservation (ConSurf) and structure-function approaches (Fig. 1d, e and Supplementary Fig. 1b).
Recently, we have demonstrated significant upregulation of NHE9 expression in CRC patient samples and in the azoxymethane/dextran sodium sulfate (AOM/DSS) mice model of CRC relative to nonneoplastic tissue19. To extend and translate these findings, we sought to determine whether heightened NHE9 expression during the normal-to-malignant evolution of colorectal epithelium corresponds with an EMTed phenotype. We derived EMT scores using three independent metrics, 76GS, MLR, and KS, based on human and mouse transcriptome profiles. Significantly, increased expression of NHE9 during tumorigeneses was strongly correlated with EMT scores and associated with the acquisition of mesenchymal traits, as indicated by a reduced 76GS score but increased MLR and KS scores in both CRC patient samples and the AOM/DSS mouse model of CRC (Fig. 1f–h and Supplementary Fig. 1c–f). Collectively, these results suggest that NHE9 expression levels are associated with an EMTed phenotype and may be a prognostic factor in CRC.
NHE9-induced Ca2+ signals dynamically tune epithelial-mesenchymal plasticity
Cellular pH and calcium homeostasis are tightly intertwined, serving fundamental roles in cell metabolism as well as the regulation of cell fate and function24. We recently discovered that heightened expression of NHE9 in CRC cells alkalinizes endosomal lumen and induces transcriptomic signatures corresponding to increased cytoplasmic Ca2+ levels19. We also found a strong correlation between NHE9 expression and Ca2+ signalling scores in primary and metastatic CRC patient samples19. These results are consistent with independent studies demonstrating that NHE9 and NHE6 mediated regulation of endosomal pH modulates cytoplasmic Ca2+ levels in neurons25,26. Crucially, our experimental findings suggested that elevated NHE9 expression induces Ca2+ signalling and promotes the acquisition of an E/M hybrid state in CRC cells19. We sought to broaden these observations by developing a mathematical model that can contribute to decode the effect of NHE9 on EMT dynamics.
On the basis of our experimental and computational analysis from previous studies, we constructed a minimal regulatory network describing how NHE9-mediated regulation of Ca2+ signalling is coupled to the acquisition of a hybrid E/M state27. Here, we focus on how the regulators including miR-200, ZEB, SNAIL, and CDH1 control the E/M phenotype (Fig. 2a). Additionally, based on previous studies, we incorporate a feedback loop in which NHE9 levels are regulated by Let-7f, a tumour suppressor miRNA controlled by SNAIL20,21,28 (Fig. 2a). We hypothesized that Ca2+ serves as a central molecular switch for epithelial-mesenchymal plasticity and is critical for cell migration.
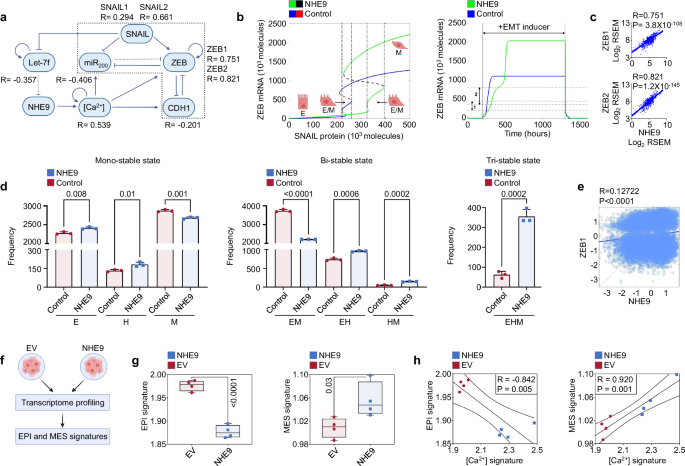
a Schematic depiction of the NHE9-coupled EMT circuit. The core regulatory network is boxed. Dotted line represents micro-RNA mediated regulation. The correlation coefficients between NHE9 expression and different regulators in the EMT circuit derived from CRC samples in the TCGA database are displayed. Scatter plots are shown in Supplementary Fig. 2. b Mathematical model predicts that NHE9 promotes acquisition of a hybrid E/M state. Bifurcation diagrams comparing ZEB mRNA levels for increasing EMT-inducing signal (SNAIL levels) in the NHE9-coupled EMT circuit (solid blue and dotted red curve) to the control or core EMT circuit (solid green and dotted black curve). Note that continuous curves represent stable steady-state solutions, while dotted lines represent unstable solutions (left). Temporal dynamics of ZEB mRNA levels in an epithelial cell exposed to a high level of EMT-inducing signal (SNAIL) for core (blue) and NHE9-coupled (green) EMT circuits. The numbers 1 and 2 denote hybrid E/M regions of the core and NHE9-coupled EMT circuits, respectively (right). c Scatter plots depicting the relationship of NHE9 with ZEB1 (top) and ZEB2 (bottom) mRNA in CRC samples from the TCGA database (n = 592). Each plot shows the linear fit and 95% confidence interval, Pearson’s correlation coefficient (R), and P-value. d Bar graph depicting frequencies of different stable phases for the NHE9-coupled EMT circuit compared to the control EMT circuit obtained across parameter sets generated for three independent RACIPE replicates. The error bars reflect standard deviation. See text for details. e Scatter plot depicting the association between NHE9 and ZEB1 levels in the minimal model calculated from RACIPE analysis. f Schematic of the experimental protocol after transduction with the indicated plasmids. g Plots of epithelial signature (EPI) and mesenchymal signature (MES) scores of colorectal cancer cells with NHE9 expression versus EV control. Lower EPI scores and higher MES score upon NHE9 expression indicate a loss of epithelial nature and a gain of mesenchymal status. h Scatter plots depicting the relationship between [Ca2+] signature scores (as measured by ssGSEA) and EPI and MES signatures. Each plot shows the linear fit and 95% confidence interval, Pearson’s correlation coefficient (R), and P-value. The illustrations were created with BioRender. P values were calculated by Pearson’s correlation (c, e, h) and unpaired, two-tailed t test (d, g). See related Supplementary Figs. 2, 3.
We built a mathematical model to describe the dynamic crosstalk between NHE9 and the EMT regulatory circuit using a set of coupled ordinary differential equations. Bifurcation diagrams calculated in response to varying SNAIL levels (an external EMT-inducing signal) demonstrated that in the presence of heightened levels of NHE9, the cell maintained a hybrid E/M phenotype over a wider range of SNAIL levels (Fig. 2b). The temporal dynamics of a cell in response to an EMT-inducing stimulus indicated that a cell that began in an epithelial state (low ZEB) progressed first to a hybrid E/M state and subsequently to a mesenchymal state (high ZEB). More interesting trends were seen in the presence of elevated NHE9 levels that slowed the transition to a mesenchymal state (Fig. 2b). Our modelling studies are consistent with experimental observations that elevated Ca2+ signalling contributes to a hybrid E/M state and promotes migration and invasion of cancer cells29.
For further validation of the model, we determined associations between NHE9 expression and different parameters of the EMT circuit in CRC samples from the TCGA database. Accordingly, we observed a significant positive correlation between NHE9 expression and the [Ca2+] signature, as well as the expression of mesenchymal genes (SNAIL1/2 and ZEB1/2), and a significant anticorrelation with the expression of the epithelial gene CDH1 and tumour suppressor miRNAs (miR-200 and Let-7f) (Fig. 2a–c and Supplementary Fig. 2a–f). Importantly, the steady state levels of ZEB mRNA were higher in the NHE9 coupled EMT circuit than in the core EMT circuit (Fig. 2b). This finding is consistent with a strong linear correlation between NHE9 and ZEB mRNA (Pearson correlation: ~0.8) in CRC samples from the TCGA database (Fig. 2c).
To evaluate the robustness and consistency of the minimal model, we employed a computational method known as random circuit perturbation (RACIPE) analysis30. RACIPE generates an ensemble of mathematical models that correspond to a network topology and then utilises statistical tools to investigate the robust dynamical behaviour of a network circuit30. Using an ensemble of 10,000 parameter sets generated by RACIPE, we observed that the EMT regulatory network topology can result in one (mono-stable), two (bi-stable), or three (tri-stable) steady states (Fig. 2d). Importantly, similar to the deterministic simulation, we see that NHE9 induces a significant increase in the frequency of the hybrid E/M states. Of note, while the frequency of monostable E phase increased in the NHE9-coupled circuit, the frequency of monostable M and EM (coexistence of E and M states) phases decreased. Additionally, the frequency of EHM (coexistence of E, hybrid E/M, and M states) phase increased significantly in the presence of NHE9 (Fig. 2d). These findings suggest that the NHE9-coupled EMT circuit enriches hybrid states and allows for coexistence and potential switching between the epithelial, mesenchymal, and hybrid E/M phenotypes.
Given our finding that NHE9 expression was strongly linked with ZEB expression in CRC patient samples (Fig. 2c), we investigated the association between NHE9 and ZEB across parameter sets obtained from independent RACIPE replicates. Consistent with the patient data, we found that the model simulation showed a positive correlation between NHE9 and ZEB1 levels (Fig. 2e). However, the degree of association was lower in the minimal model than in patient data, highlighting the inherent complexity of biological systems and the possibility that NHE9 regulates ZEB levels via additional mechanism(s). For instance, NHE9 activity has been shown to have a pan-specific effect on the membrane persistence of multiple receptor tyrosine kinases, including the epidermal growth factor receptor, which can independently upregulate ZEB1 expression, promoting EMT and CRC metastasis2,3,31. Taken together, our findings suggest that NHE9, via multiple mechanisms, may improve the robustness of networks to regulate signal transduction and cell fate decision-making and enhance cellular plasticity between epithelial, hybrid E/M, and mesenchymal states to meet the demands of continuous proliferation and survival.
We next performed genome-wide transcriptome profiling of CRC cells (Caco-2) with lentiviral mediated expression of NHE9 or empty vector (EV) control by RNA sequencing and quantified the enrichment of epithelial (EPI) and mesenchymal (MES) signatures (Fig. 2f). This representation on a two-dimensional (2D) E/M plane enables the deconvolution of transition trajectories independently32. Strikingly, CRC cells expressing NHE9 showed a significant decrease in EPI signature and a significant increase in MES signature compared to cells expressing EV, suggesting both a loss of epithelial traits and a gain of mesenchymal ones with higher NHE9 expression (Fig. 2g). Additionally, when cells expressing NHE9 or EV were plotted together, the EPI signature showed a strong negative correlation with the [Ca2+] signature, whilst the MES signature showed a strong positive correlation, suggesting that Ca2+ signalling might influence both the epithelial and mesenchymal nature of cells (Fig. 2h).
EMT is a complex and nonlinear process in which cells can take different trajectories to differing degrees, and the loss of epithelial traits does not always fully couple with the gain of mesenchymal ones32. To ascertain this, we calculated EMT scores using three metrics (76GS, MLR, and KS) that employ distinct gene lists associated with epithelial and mesenchymal characteristics to provide a score that specifies the placement of samples along the epithelial-hybrid-mesenchymal continuum33. Strikingly, when cells expressing NHE9 or EV were plotted together, the EPI signature correlated strongly with all three EMT scores, whereas the MES signature had modest or no significant correlation with the three EMT scores (Supplementary Fig. 2g, h). This would suggest intriguing trends in the trajectory of CRC cells with NHE9 expression on the 2D EMT plane that lose epithelial characteristics following EMT induction but do not gain mesenchymal traits to a similar extent, making the resultant phenotype a hybrid E/M population endowed with increased metastatic potential. Consistently, our experimental findings from preclinical in vitro and in vivo mouse xenograft models revealed that higher NHE9 levels in CRC cells resulted in collective invasion, tumour podia, and tumour buds at the protrusive front, all of which are adverse prognosticators and morphologic hallmarks of the hybrid E/M state19. Clinically, higher NHE9 levels showed poor survival particularly among the Consensus Molecular Subtype (CMS) 4 subtype hybrid E/M-enriched CRC tumours34 (Supplementary Fig. 2i). Furthermore, analysis of the TCGA data for pH and Ca2+-related pathways revealed a significant linear relationship between NHE9 expression and activity scores for Ca2+ import, Ca2+ transport, and proton transmembrane transport in CRC tumours, supporting the results of the mathematical analyses (Supplementary Fig. 3a–c). These data collectively suggest that CRC cells fine-tune their NHE9 levels and regulate Ca2+ signals as they proceed through EMT, enabling hybrid E/M cells to develop motility-invasive properties.
NHE9 expression in colorectal cancer associates with tumour cell migration
From a clinical perspective, metastasis is the leading cause of treatment failure and of cancer-related deaths35,36,37. We previously assessed the primary vs. metastasis transcriptomic landscape in patient tumours and found that NHE9 levels were significantly higher in metastatic CRC and strongly correlated with EMT scores19. Because the hybrid E/M state is predicted to promote tumour cell migratory capacity and metastatic potential38,39, we next explored the relationship between NHE9 expression and migration signatures that could reflect the overall metastatic process and distant colonization. For this, we determined the activity (as measured by ssGSEA; see Material and Methods) of three independent gene sets: one from the gene ontology resource (GO cell migration) and two curated datasets from Wu et al. 37 (Wu cell migration) and Cheung et al. 35. (circulating tumour cell). To offer an accurate and reliable evaluation, we analysed three independent CRC patient databases with small (GSE16125; n = 36), intermediate (GSE28722; n = 125), and large (TCGA; n = 637) sample sizes.
We first confirmed that NHE9 levels correlate with at least two of the three EMT scores across all three databases and pairwise comparisons revealed a significant positive correlation between NHE9 and mesenchymal genes (Fig. 3a, b and Supplementary Fig. 3d, e). Next, the activity levels of three independent migration gene sets demonstrated a strong positive association with NHE9 expression across all three databases, with Pearson correlations as high as 0.81, highlighting NHE9 as a potential metastatic regulator in CRC (Fig. 3c and Supplementary Fig. 4a–c). These findings are consistent with our experimental observations that CRC cells with elevated NHE9 levels exhibited greater collective cell migration in scratch wound healing assays and invasive growth in in vitro and in vivo mouse xenograft models19. Furthermore, in line with our experimental findings that NHE9 suppresses cAMP levels and promotes hybrid E/M traits in CRC cells19, we found strong correlation between NHE9 expression and the activity levels of partial EMT (pEMT), EMT, and cAMP-inhibited gene sets (Fig. 3c and Supplementary Fig. 4a–c). Interestingly, clustering analysis revealed that pEMT and EMT generated the most similar activity levels, consistent with the fact that both represent different degrees of the same spectrum. On the other hand, cAMP-activated gene set generated the most distinct activity levels, consistent with the observation that cAMP signalling is supressed in CRC with high NHE9 expression19 (Fig. 3c).
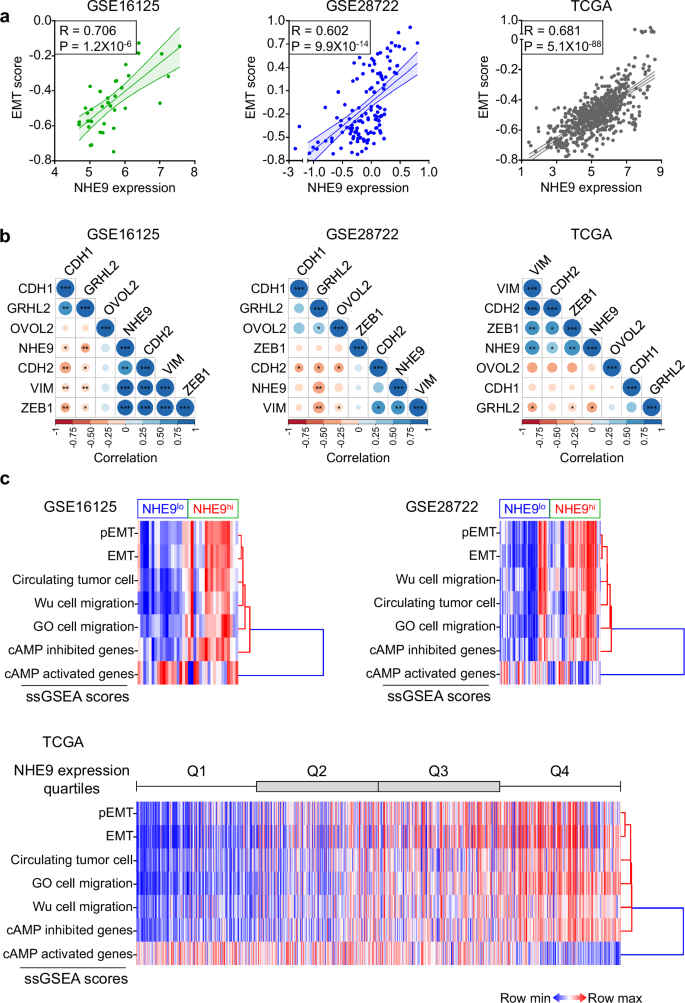
a Scatter plots depicting the relationship between NHE9 expression and EMT scores (KS) in CRC samples from the GSE16125 (n = 36) (left), GSE28722 (n = 125) (centre), and TCGA (n = 637) (right) databases. Each plot shows the linear fit and 95% confidence interval, Pearson’s correlation coefficient (R), and P-value. b Pairwise Pearson’s correlation between NHE9 and EMT regulatory genes in CRC samples from the GSE16125 (left), GSE28722 (centre), and TCGA (right) databases. Pearson’s correlation value for each gene pair is represented by the size of the circle, filled with the corresponding colour from the colour bar at the bottom. *P < 0.05, **P < 0.01, ***P < 0.001. c Hierarchical clustering and heat map (from low (blue) to high (red)) of the activity levels (ssGSEA scores) of three independent migration gene sets as well as partial EMT (pEMT), EMT, cAMP inhibited, and cAMP activated gene sets in CRC samples from the GSE16125 (top left), GSE28722 (top right), and TCGA (bottom) databases. Note enrichment of migration signatures in tumours with higher (NHE9hi) versus lower (NHE9lo) NHE9 expression levels. See related Supplementary Figs. 3–5.
Our analysis of bulk transcriptome datasets highlighted associations between NHE9 expression, EMT, and tumour cell migration. To determine if these relationships are maintained even at the individual-cell level, we examined single cell RNA sequencing (scRNA-seq) data from colorectal cancer (GSE13257). The scRNA-seq data were filtered for the epithelial compartment, and ‘CMSCaller’ function was used to classify cells into four subtypes (CMS1-4)40 (Fig. 4a). Intriguingly, we observed that the antagonism between epithelial and mesenchymal axes was mostly prominent at the single cell level in the CMS4 subtype (Fig. 4b). Consistent observations were made in single-cell analysis of EMT scores (76GS, MLR, and KS) (Fig. 4c–e). Since Na+/H+ exchangers are estimated to have very high transport rates of ∼1500 ions/s6, even small changes in NHE9 expression can have important functional consequences. Intriguingly, we observed heterogeneity in NHE9 expression within CMS subtypes, with expression being significantly higher in CMS4, the most mesenchymal subtype40 (Fig. 4f). This is in line with the finding that increased NHE9 levels were associated with poor patient survival in the CMS4 subtype of CRC tumours (Supplementary Fig. 2i). Thus, we focused our subsequent analysis on cells classified to belong to CMS4 subtype. We first confirmed that NHE9 levels correlate with EMT scores, and pairwise comparisons demonstrated a significant positive correlation between NHE9 and the MES signature (Fig. 4g). Expectedly, NHE9 expression correlated significantly with the activity levels of the pEMT and EMT gene sets (Fig. 4h). Importantly, two of the migration signatures – GO cell migration and circulating tumour cell – showed a strong positive correlation with NHE9 expression (Fig. 4h), reinforcing our findings from the bulk-level analysis. Also, we found a strong association between NHE9 expression and the activity of the cAMP-inhibited gene set (Spearman correlation: 0.847) (Fig. 4h), suggesting that our experimental findings that NHE9 suppresses cAMP levels are maintained even at the single-cell level.
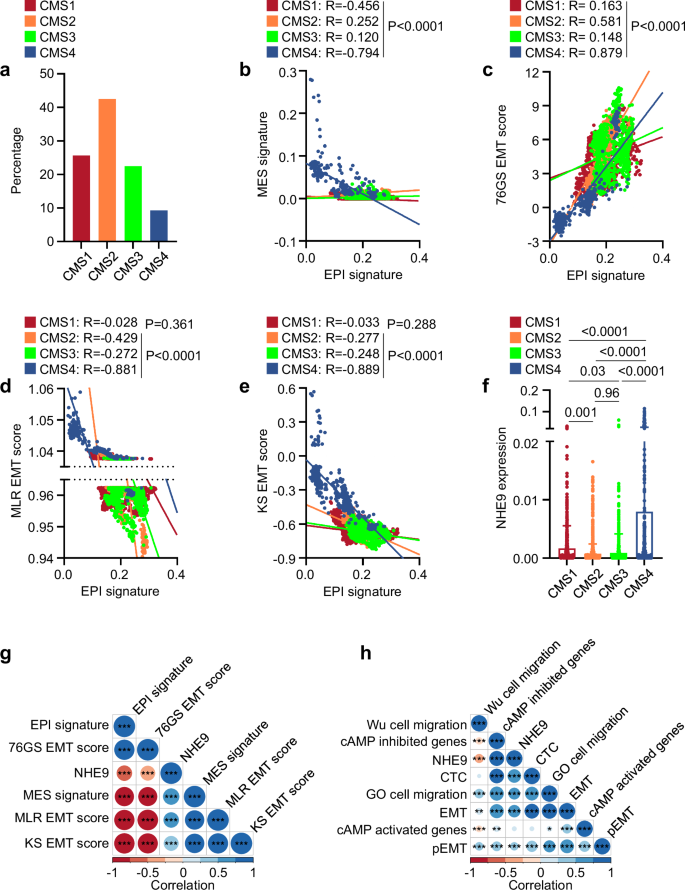
a Bar graph depicting the percentage of epithelial cells classified as CMS1, CMS2, CMS3, and CMS4 subtypes. b Scatter plot depicting the CMS subtype-wise association between EPI and MES signatures. c–e Scatter plot depicting the CMS subtype-wise association between EPI signatures and 76GS (c), MLR (d), and KS (e) EMT scores. f Bar graph depicting heterogeneity in NHE9 expression among CMS subtypes. Note significant high expression of NHE9 in CMS4 than other subtypes. The error bars reflect standard deviation. g Pairwise Spearman correlation of NHE9 with EPI and MES signatures and EMT scores (76GS, MLR, and KS) in CMS4 cells. Correlation value for each comparison pair is represented by the size of the circle, filled with the corresponding colour from the colour bar at the bottom. *P < 0.05, **P < 0.01, ***P < 0.001. h Pairwise Spearman correlation of NHE9 with three independent migration gene sets (GO cell migration, Wu cell migration, and circulating tumour cell or CTC) as well as partial EMT (pEMT), EMT, cAMP inhibited, and cAMP activated gene sets in CMS4 cells. Correlation value for each comparison pair is represented by the size of the circle, filled with the corresponding colour from the colour bar at the bottom. *P < 0.05, **P < 0.01, ***P < 0.001. The analysis was performed on the GSE13257 dataset. P values were calculated by Spearman correlation (b–e, g, h) and one-way ANOVA (f).
Finally, to corroborate these results, we examined survival outcomes. We identified that CRC patients with upregulation of NHE9 had significantly poor overall and metastasis-free survival (Supplementary Fig. 5a). We note that patients with low NHE9 expression survived strikingly longer, with a median survival of 1200 days, in contrast to 285 days in patients with NHE9 upregulation (Supplementary Fig. 5a). Like NHE9, CRC patients with lower EMT state had better overall and metastasis-free survival. In contrast, there were no survival differences for the related endosomal NHE6 (Supplementary Fig. 5b, c). Additionally, tumour NHE9 expression significantly correlated with distant metastasis rather than local recurrence in CRC patients (Supplementary Fig. 5d). Collectively, and combined with our findings, showing NHE9 levels driving invasive growth in vitro and in vivo, our results define NHE9 as a positive regulator of colorectal cancer metastasis, consistent with its key role in endosomal function and vesicle trafficking.
Evaluation of tumour hypoxia and comparison with NHE9 expression profiles
Tumour hypoxia is linked to aggressive disease and therapeutic resistance41. To analyse the association of hypoxia with the process of EMT, we compared trio of transcriptomics-based scoring metrics, namely Buffa, Ragnum, and Winter hypoxia scores41, with three EMT scores (76GS, MLR, and KS) in CRC samples from the TCGA database. Notably, hypoxia scores from each of these independent signatures were strongly correlated with one another, as were EMT scores, demonstrating the consistency and robustness of these scoring metrics that would result in similar classifications (Supplementary Fig. 5e). Strikingly, we observed that hypoxia scores exhibited a weak or no significant association with the three EMT scores, as well as activity levels of pEMT, EMT, and the three independent migration gene sets (Supplementary Fig. 5e, f). This trend appears unexpected as per the canonical EMT paradigm wherein hypoxia-driven activation of HIF-1α is thought to drive EMT and other related processes42. However, EMT is a multidimensional process that is tumour-type and context-dependent, with multiple trajectories in terms of molecular and functional alterations32. Also, HIF-1α activation is not limited to hypoxic conditions, hence the link between EMT and hypoxia response is ambiguous42,43. Importantly, studies in CRC have shown that EMT occurs more commonly at the invasive front (tumour-stromal interface), where nutrient limitation is unlikely to be a driving force for migration, as opposed to the hypoxic core44.
We further examined the relationship between NHE9 expression and three hypoxia scores, which uncovered an intriguing inverse association (Fig. 5a). Of note, stepwise decreasing Buffa, Ragnum, and Winter hypoxia scores were observed from low-intermediate-high NHE9 expression groups, whereas this trend is not observed for related NHE6 (Fig. 5a and Supplementary Fig. 5g). Collectively, these findings would predict heterogeneity of NHE9 expression levels: low in poorly vascularized core tumour regions but high near the tumour edge, where cancer cells are in close juxtaposition with the tumour-associated stroma.
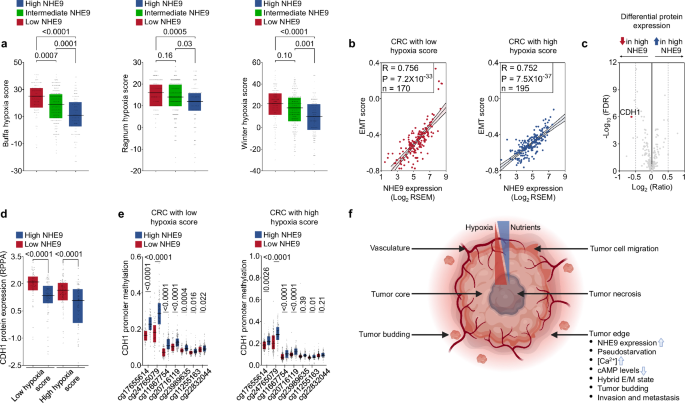
a Box plots of Buffa, Ragnum, and Winter hypoxia scores in CRC samples from the TCGA database, sorted as low (Q1), intermediate (Q2, Q3), or high (Q4) NHE9 expression categories. b Scatter plots depicting the relationship between NHE9 expression and EMT scores (KS) in CRC samples from the TCGA database, sorted by median hypoxia score (Buffa) into low (left) and high (right) hypoxia score groups. c Volcano plot depicting differentially expressed proteins in CRC with low and high NHE9 expression in samples from the TCGA database with hypoxia data available. d Box-plots demonstrating that downregulation of CDH1 protein expression in CRC with high NHE9 was comparable between high and low hypoxia score groups in the TCGA database. e Box-plots demonstrating that CDH1 promoter hypermethylation in CRC with high NHE9 was comparable between high and low hypoxia score groups in the TCGA database. The x-axis shows the CpG island probes. f Schematic representation of a solid tumour organization with the characteristic tumour necrosis with dead cells, hypoxic tumour core, and vascularised tumour edge that forms the invasive front with migratory cells and tumour buds. Tumor cells in the periphery are proposed to have elevated levels of NHE9, which induces [Ca2+] and suppresses cAMP levels, associating with pseudostarvation and the hybrid E/M state that drives the invasive capability of malignant tumours. The illustration was created with BioRender. P values were calculated by one-way ANOVA (a), Pearson’s correlation (b), and unpaired, two-tailed t test (d, e). See related Supplementary Fig. 5.
We next stratified tumours into high and low hypoxia score groups and found that NHE9 expression had a strong positive correlation with EMT scores in both categories (Pearson correlation: ~0.75), suggesting that the impact of NHE9 on EMT appears to be independent of hypoxia status (Fig. 5b). To investigate further, we examined three-tier (methylome, transcriptome, proteome) data from TCGA, which revealed CDH1 as one of the top downregulated proteins in CRC with high NHE9 expression and “cellular movement” as the top molecular and cellular function regulated by NHE9 expression (Fig. 5c–e and Supplementary Fig. 5h). Importantly, we found that the loss of e-cadherin, an essential hallmark of EMT22, as demonstrated by decreased CDH1 protein expression and CDH1 promoter hypermethylation in CRC with high NHE9 expression, was comparable between the high and low hypoxia score categories (Fig. 5d, e). Together, these observations suggested that the EMT score system had a superior predictive value for tumour metastasis and that the mechanisms driving NHE9-mediated cancer progression may be independent of the hypoxic status of tumour cells.
Discussion
Given that endosomes play a multitude of roles in cellular function and that an NHE9-high state correlates with invasiveness in CRC, understanding how endosomal pH regulates tumour progression is critical for developing effective targeted therapies. Previously, we showed that loss of function of related NHE6 causes hyperacidification of endosomes and amyloid metabolism defects associated with Alzheimer’s disease45,46. In contrast, we recently reported that gain of function in NHE9 results in excessive luminal alkalization in CRC cells19. Here, we sought to broaden these observations by employing a computational modelling framework to demonstrate a crucial and previously understudied relationship between NHE9 expression and the gene expression programs that underpin hybrid E/M phenotypes and cellular plasticity. Recent conceptual and experimental studies have shown that EMT is not a binary process as previously assumed, but can progress through multiple stable hybrid E/M states with a higher tumour-initiation potential than cells in epithelial or mesenchymal states38,39. In this context, our findings have several important implications for the clinical management of cancer.
First, evolutionarily conserved starvation/pseudo-starvation model has emerged as a major driving force for cancer invasion47. In response to nutrient limitation, the yeast Saccharomyces cerevisiae, upregulates Nhx1, the human NHE9 ortholog, enhances endocytosis, and switches from budding to invasive pseudohyphal growth, a phenotypic transition likely dependent on endosomal pH that may be considered a conserved hallmark of the starvation response48,49,50. In light of this, increased NHE9 expression in cancer cells, even in nutrient-rich environments such as the invasive front at the tumour edge (Fig. 5f), may represent a pseudo-starvation state adapted to evade migration-related stresses and adhere to niches conducive to survival during metastatic outgrowth. The availability of glucose can regulate the pro-proliferative Wnt/β-catenin pathway in CRC cells51. We previously discovered an evolutionarily conserved mechanism for glucose limitation-mediated regulation of endosomal NHE expression48. Further studies are needed to characterize the role of nutrient limitation and hypoxia in the regulation of NHE9 in vitro and in vivo. Increasing NHE9 expression may provide cancer cells with a competitive advantage in low nutrient and oxygen environments and tumour xenografts.
Second, together with data demonstrating Ca2+-dependent suppression of cAMP levels facilitating trophoblast cell invasion during placental development52 and studies revealing intriguing parallels between invasion in placentation and cancer53, our findings may suggest a conserved mechanism that triggers invasive behaviour in CRC and other tumours such as glioblastoma, wherein both NHE9 upregulation and cAMP suppression have been shown to play important roles19,54,55 (Fig. 5f). Using experimental analysis and mathematical modelling, we recently demonstrated that NHE9/cAMP axis-mediated feedback regulation of endosomal pH is a pseudo-starvation mechanism that conserves resources and ensures system robustness19. In contrast to previously described pseudo-starvation-induced invasion states in cancer that primarily invoke translation reprogramming47, our findings show an association with therapeutically amenable organellar function. From a translational perspective, our observations provide a rational, mechanistic basis for repurposing approved drugs, such as metformin, which functions via endosomal pH56,57, as well as the development of pH-rebalancing nanoparticles and screening for high affinity, selective NHE9 inhibitors to target the cellular microenvironment in cancer.
Third, our data have broader relevance in light of the emerging ‘teams’ of nodes network design principle for epithelial-mesenchymal plasticity driving cellular decision-making, nonlinear transition dynamics, and cell fate canalization58. When cells begin with an epithelial phenotype, the networks have a high team strength, resulting in a low frequency of hybrid states. Importantly, NHE9 exhibits a strong association with genes in the mesenchymal team and an anti-correlation with genes in the epithelial team19. The precise pH-sensitive regulation of specific signalling cascades and transcriptional networks remains to be determined. We suggest that pathological endosome alkalinisation caused by NHE9 upregulation in epithelial cells could help overcome the ‘resistance’ to escape a terminal phenotype by reducing team strength and enhancing the frequency of hybrid states for the same degree of perturbation. Finally, the emerging role of NHE9 in cancer onset and progression raises the possibility that endosomal reprogramming may enable tumour cells to mount a two-armed adaptive response: (i) modulating cell-microenvironment interactions by altering surface expression of receptors and adhesion molecules, and (ii) driving endocytosis to increase nutrient supply to support high biosynthetic demand. In this regard, a better understanding of these specific adaptations and the ensuing metabolic vulnerabilities could gear the development of new therapeutic strategies that target endosomal pH to prevent metastatic spread.
Methods
Mathematical modelling of the EMT circuit
Based on our experimental findings19, we constructed a minimal regulatory network that illustrates how NHE9-induced Ca2+ signalling is linked to the EMT regulatory circuit composed of miR-200, ZEB, SNAIL, and CDH1. This setup extends the mathematical models developed earlier27,59. To investigate how Ca2+ regulates EMT, we focused on its established downstream target, the transcription factor nuclear factor of activated T-cell (NFATc), which regulates miR-200, ZEB, and CDH1, and is known to be a metastasis driver in colorectal cancer27,60. Increased cytosolic [Ca2+] activates the calcineurin/ NFATc pathway, which, in addition to its roles in normal physiology, is crucial for tumour growth and progression27,60. In our model, we also introduced a feedback loop in which Let-7f, a tumour suppressor miRNA controlled by SNAIL, regulates NHE9 levels20,21,28. We built a mathematical model to describe the dynamics of these regulators with coupled ordinary differential equations (ODEs). The level of a molecular species (X) is described via a chemical rate equation that assumes the generic form:
Where the first term of the equation signifies the basal rate of production (({g}_{X})); the terms multiplied to ({g}_{X}) represent the transcriptional/translational/post-translational/other regulations due to interactions among the species in the system, as defined by the Hills function ({H}^{S}left(A,{A}_{0},n,lambda right)). The term ({k}_{X}X) accounts for the rate of degradation of the species (X) based on first order kinetics. The parameters were adopted from previously published literature for the molecular species of the EMT regulatory circuit, as well as NHE9, Let-7f, and NFATc (Ca2+) interactions and are provided in Supplementary Table 1. The temporal dynamics of the species of the circuit (miR-200: ({mu }_{200}), Snail: (S), Zeb: (Z), E-cadherin: (E), NFATc: (N), Let-7f: (l7), NHE9: ({nh})) are modelled by a system of ODEs 1-7, as illustrated below.
Where,
mzL(μ200) is the total translation rate, mzYm(μ200) is the total ZEB mRNA active degradation rate and mzYμ(μ200) is the total miR active degradation rate. Calculations of the same were done as defined by Lu and Jolly et al. 59.
HS is the shifted Hill function, defined as
λ is the fold change from the basal synthesis rate due to protein B. λ > 1 for activators, while λ < 1 for inhibitors.
RACIPE analysis
The underlying design principles of the NHE9-coupled EMT network were analysed using the random circuit perturbation (RACIPE) algorithm, as previously described19,30. The algorithm generated 10,000 mathematical models, each with a different set of parameters. Each model was given a hundred initial conditions, and all steady state solutions were compiled to determine the phases. The phenotype of a steady state solution is determined by the z-scores of ZEB and miR-200. zzeb < 0 and zmir-200 > 0 indicates an epithelial state; zzeb > 0 and zmir-200 > 0 indicates a hybrid state; and zzeb > 0 and zmir-200 < 0 indicates a mesenchymal state.
Cell culture and transcriptomic profiling
NHE9-GFP and emptor vector expression were introduced to Caco-2 (HTB-37) human colorectal adenocarcinoma cells using FUGW vector-based lentiviral packaging and expression, as previously described in ref. 19. RNA was extracted using the Qiagen RNeasy Mini kit (#74104), and its purity and integrity were determined. Raw sequencing data were obtained using the Illumina HiSeq, and their quality was assessed using FastQC and MultiQC software. The QC-passed reads were aligned to the GRCh38.p7 human reference genome using the STAR v2 aligner, and PCR and optical duplicates were identified and removed using the Picard tools. Read counts were used to calculate gene expression levels using the featureCounts function and the edgeR package was utilized for differential expression analysis.
EMT scores
The 76-gene EMT score (76GS) was calculated using a weighted sum of gene expression values from 76 gene signatures, where the weight represents the correlation coefficient of the given gene with E-cadherin expression levels. The Multinomial Logistic Regression (MLR) score was calculated using an iterative algorithm that considered the expression levels of 23 genes (3 predictors and 20 normalizers). The two-sample Kolmogorov Smirnov test (KS) score was calculated using cumulative distribution functions (CDFs) generated for each of the two signatures (E and M), and the greatest difference between these CDFs was utilized as the test statistic33.
ssGSEA scores
Single-sample Gene Set Enrichment Analysis (ssGSEA) scores were calculated using the GSEApy module. We used KEGG_CALCIUM_SIGNALING_PATHWAY, GOBP_CALCIUM_ION_TRANSPORT, GOBP_CALCIUM_ION_IMPORT, GOBP_PROTON_TRANSMEMBRANE_TRANSPORT, CAMP_UP.V1_UP, CAMP_UP.V1_DN, HALLMARK_EPITHELIAL_MESENCHYMAL_TRANSITION, and GOBP_CELL_MIGRATION gene sets from The Molecular Signatures Database (MSigDB) database. The partial EMT (pEMT) gene set was curated from Puram et al. 36. and used as signatures for ssGSEA scoring. Other a priori defined gene sets used are from Wu et al. 37. (Wu cell migration) and Cheung et al. 35. (circulating tumour cell). The epithelial (EPI) and mesenchymal (MES) signatures used to derive KS EMT score were employed separately as gene sets to determine transition trajectories in a two-dimensional (2D) EMT plane32.
Clinical, cell line, and mouse data
Patient and mouse data were obtained from the following databases: GSE4107, GSE16125, GSE28722, and GSE31106. Data from the TCGA, NCI-60, and DepMap CRISPR fitness databases were extracted from the GDC Portal/cBioPortal, CellMiner, and UALCAN portals, respectively. Survival analysis was performed by the Kaplan–Meier plotter and PROGgeneV2 platforms. Pathway analysis was performed using the Ingenuity Pathway Analysis (Qiagen) software.
Single cell analysis
Single cell data from the GSE13257 database was log-normalised using scanpy with a scaling factor of 10,000. To account for the sparsity of single cell data, imputation was performed using the python implementation of the MAGIC algorithm. The annotations from deposited data were used to subset out the epithelial cells for further analysis. The Consensus Molecular Subtype (CMS) subtypes were assigned by using the CMSCaller package in R. Scoring of the activity level of the gene signatures were done using the AUCell package in R.
Mutation analysis
Structure-driven assessment of NHE9 mutations was carried out by generating a three-dimensional structure based on horse NHE9 (PDB ID: 6Z3Y) and imposing evolutionary conservation scores to it using the SWISS-MODEL and ConSurf web servers, respectively. The MutationTaster algorithm was employed for functional prediction of genetic variants.
Data analysis
Data analysis was performed with GraphPad Prism 9, and the statistical tests employed are listed in the figure legends.
Responses