Existing seafood traceability tools are insufficient for enforcing import restrictions

Changes in aquatic food trade following annexation of Crimea
Russia began an annexation of Ukraine’s Crimean Peninsula on March 18, 2014, sparking international backlash11. In total, 39 nations imposed sanctions by freezing Russian assets, seizing Russian property, and banning exports to Russia of military technology and dual-use goods, including oil exploration and production equipment12,13. In response, Russia imposed countermeasures, including an agricultural embargo that prohibited food imports, including seafood products, from sanctioning nations14.
Analyzing consumption of Russian-caught seafood following the 2014 round of sanctions, we find that unfriendly countries initially moderately reduced total consumption of Russian seafood (9.7%) in 2015–2016 compared to 2013–2014 (Fig. 1b). Direct imports of Russian seafood by these countries then remained largely flat after 2016 but total consumption of Russian caught seafood increased due to increased consumption of products which moved through an intermediate country, as occurs with foreign processing (Fig. 1b). However, it is notable that the most important change in the Russian trade patterns occurred in 2007–2008 as most of the increase in exports at this time are exports to China, primarily Alaska pollock and other whitefish. China primarily acts as a third country processor of this fish, which it imports under a low-tariff special economic zone for export-processing and exports these products to other countries15.

Changes in consumption of Russian seafood products by (a) countries that did not impose any sanctions (friendly countries) and b countries that did impose sanctions against Russia (unfriendly countries). Changes in Russia’s seafood consumption (c) from Russia-friendly countries and d Russia-unfriendly countries. Direct imports are in gold, and imports from an intermediate partner are in teal. Russia-unfriendly countries include the following countries (as isc3c codes), with all others included in Russia-friendly countries: ALB, AUS, AUT, BEL, BGR, CAN, CHE, CYP, CZE, DEU, DNK, ESP, EST, FIN, FRA, GBR, GRC, HRV, HUN, IRL, ISL, ITA, JPN, LTU, LUX, LVA, MDA, MLT, MNT, NLD, NOR, POL, PRT, ROM, SVK, SVN, SWE, UKR, and USA.
Friendly countries decreased consumption of Russian products 18.9% in 2014 compared to 2012–2013, but their consumption quickly rebounded, exceeding the pre-2014 value by 25% in 2020 (Fig. 1a). Meanwhile, Russia reduced consumption of seafood from unfriendly countries by 59% over the same period (Fig. 1d), resulting in a moderate decrease in total import level (35%) as imports were partially replaced with imports from friendly countries, which increased 43.5% from 2015 to 2019 (Fig. 1c). In summary, while the Russian market for seafood products from unfriendly countries contracted, Russia’s total imports as well as exports of its own products were essentially unaffected. The increased imports from friendly countries illustrates the adaptability of the global seafood market to readily fill the gap in Russian seafood imports.
Since 2014, the US and its allies have continued imposing sanctions focused on the banking and energy industries as well as on individual Russian oligarchs16. However, after Russia invaded Ukraine in February 2022, the US imposed sanctions targeting other major Russian economic sectors and prohibiting importation of Russian seafood17 (EO 14068). Russia responded with additional countermeasures, expanding its seafood import ban to include canned fish, sturgeon caviar, mollusks and other aquatic invertebrates18. Despite international restrictions, Russia remained a major seafood producer and exporter, with the US importing over $300 million of Russian red king crab in a single month preceding US import restrictions that went into effect in 202219. Industry reporting on the patterns we demonstrate here prompted calls by industry and policymakers in the US for measures specifically targeting Russian seafood in the 2022 round of sanctions.
Challenges to US enforcement of import restrictions
While it is too early to obtain complete data on the impact of the 2022 US import restrictions against all Russian-harvested seafood, examining the existing structure of seafood trade between the two countries can shed significant light on the extent to which Russia will still be able to access the U.S. market via third intermediary countries. It is widely understood that significant quantities of Russian seafood products destined for the US market undergo processing in China, a major processor of seafood products sourced from many countries15. In 2020 alone, an estimated 894 Russian companies exported seafood to China, totaling over 15.3 billion USD20. This not only affects the ability of the US to enforce existing import prohibitions on Russian seafood products, but it also intersects with US supply chains, as US-caught products, including some of the same Russian-caught species, undergo processing in China9,15.
A central challenge in enforcing import restrictions is the lack of systematic country of harvest documentation. Information on the country of harvest is only regularly available for imported seafood when the products are subject to a trade policy specifically requiring this reporting. Without these additional reporting requirements, information on where imported products were produced is limited to US and international trade standard definitions across all industries, which states a good’s country of origin represents the last country where a product has been “substantially transformed” (i.e., changed in a way that affects its product trade code)21. This means Russian-caught fish—as well as fish caught by the US and other countries—that are processed in China are considered a product of China. The original country of harvest is therefore presented in non-standardized ways or omitted altogether from packaging. Consequently, enforcing import restrictions related to the country of harvest is particularly difficult when a large percentage of the products are processed in foreign countries. To determine the relevance of such mechanisms, we estimate flows through intermediate partners back to the country of harvest with the ARTIS database at the national level, which uses a mass-balance model that accounts for foreign processing linked to bilateral trade data7.
We find that for 2015–2019, 96% of Russian-harvested seafood consumed in the US was imported from a country other than Russia, with 89% moving through China (Fig. 2a). The top five species by weight were Alaska pollock (Gadus chalcogrammus), Atlantic cod (Gadus morhua), pink salmon (Oncorhynchus gorbuscha), haddock (Melanogrammus aeglefinus), and Pacific cod (Gadus macrocephalus), which collectively made up 88% of US consumption of Russian products by volume (Fig. 2b). Importantly, US fleets target these same species, and a portion of the landings are also processed in China. Therefore, we compared the volumes of these species imported by the US from China to China’s Russian and non-Russian sourcing of these species to provide a range for the quantity of Russian seafood entering the US via China (Fig. 2b). While US imports of Atlantic cod, Pacific cod, and haddock from China could possibly be derived from US-sourced fish without incorporating Russian-harvested products, we estimate that the US imported at least 45,000 and 22,000 tonnes of Russian-sourced Alaska pollock and pink salmon, respectively, via China in 2020 (Fig. 2c). However, unless Chinese processors perfectly segregate Russian products from products from other sources, the actual volume of Russian imports would be above the minimum estimate for each species.
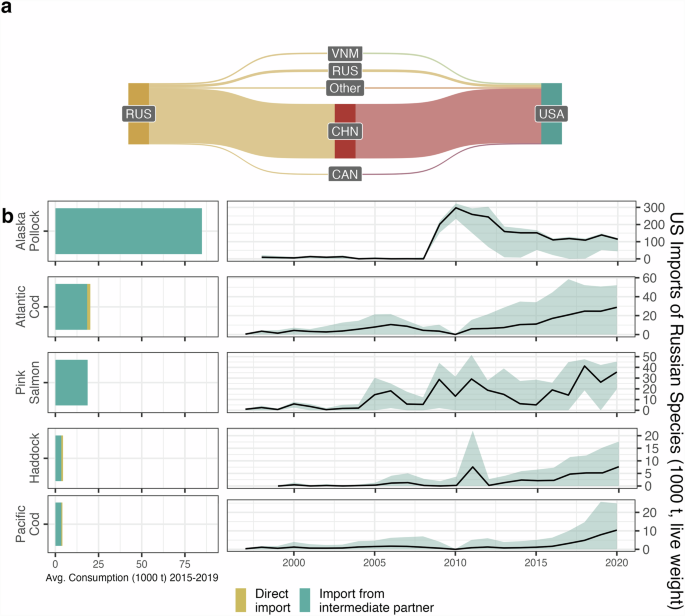
a Direct and indirect flows of Russian seafood products into the US for 2015–2019. Countries are represented by their iso3c code (RUS = Russia, VNM = Vietnam, CHN = China, CAN = Canada, USA = United States). b Top species imported by the US produced by Russia, total for 2015–2019 and the range of Russian-sourced seafood (represented by shaded band) imported by the US via China; the black line represents the proportional estimate. Note that Russian crab trade is undercounted here as a result of trade reporting issues for products transshipped by, or in transit through, intermediate countries (see ref. 45 for more on this issue).
Based on these ranges, we estimate with ARTIS that 44.3–100% of Alaska pollock and 41.1–94.8% of pink salmon imported by the US from China is Russian harvested, by volume. Important context for these figures though is that despite the large quantity of imported Alaska pollock, the US market overall is still dominated by domestic products. We estimate that over 90% of Alaska pollock consumed in the US in 2020 was landed by the US, with a small fraction undergoing foreign processing. Conversely, we estimate that the majority of pink salmon (56.9%) consumed in the US in 2020 was landed by foreign countries and nearly 20% was US caught and foreign processed.
Tools for improving traceability
The case of Russian seafood and the associated obstacles for enforcing import restrictions highlights the broader challenges of identifying where seafood is harvested. Connecting seafood to the country of harvest is a matter of the product’s traceability, or “the ability to access any or all information relating to that which is under consideration, throughout its entire life cycle, by means of recorded identifications”22. This information represents claims related to the products’ life cycle, which can subsequently be investigated to verify the accuracy of the claims. Existing systems for documenting the country of harvest for seafood products vary in the extent to which they support traceability efforts and can broadly be grouped into 1) consumer-facing labeling requirements and 2) catch certificates and/or chain-of-custody documentation requirements.
Labeling related to the source country for a product generally falls within importers’ country-of-origin labeling requirements, such as the US Country of Origin Labeling (COOL) law. In the US, all products of foreign origin are required by Customs and Border Protection to include a legibly marked country of origin. Some products have additional individual labeling regulations—for example, the US Food and Drug Administration provides guidance that only Alaska pollock (Gadus chalcogrammus) caught in Alaskan waters is permitted to be marketed as Alaska pollock. However, as noted above, country of origin does not equate to the country of harvest when products undergo third-party processing. Altering country-of-origin labeling rules to include country of harvest would represent a significant change, with nontrivial challenges when fishery products from different countries commingle during processing or a product includes ingredients sourced from different countries (e.g., prepared frozen meals). However, existing country-of-origin labels provide insufficient information for enforcing import restrictions or for consumers to avoid Russian-harvested seafood, and other challenges such as illegal, unreported, and unregulated (IUU) seafood. More generally, this issue inhibits consumer efforts to follow existing sustainability guides, which vary according to country of harvest.
The second set of systems are catch and supply chain documentation programs. The US has four primary programs that monitor seafood imports: the Tuna Tracking and Verification Program, the Highly Migratory Species International Trade Program, the Antarctic Marine Living Resources Program, and the Seafood Import Monitoring Program (SIMP). SIMP requires importers of specific product-species combinations to report data elements such as harvest fishing zone, country of harvest, and the harvest vessel flag; it has the broadest coverage, focusing on 13 species groups considered at high risk of IUU and/or mislabeling23,24. In 2023, SIMP-listed species represented an estimated 43% of US seafood imports, by weight25. While SIMP includes some top “direct” US imports of Russian-harvested seafood including red king crab and cod, it does not include many other Russian-harvested seafood species, including king crab species other than red king crab, as well as all snow crab species, in addition to two of the top US “indirect” imported species sourced from Russia, Alaska pollock and pink salmon (Fig. 2). Moreover, partial coverage of species by SIMP leaves opportunities to import products under incorrect species names and product codes to avoid the regulation, though importing under false product code would itself represent a customs violation under Section 484 of the Tariff Act of 1930. In addition to these programs, some seafood products fall under the FDA Food Safety Modernization Act, which has supply chain recordkeeping requirements to enable faster identification and removal of foods posing a health threat, but there is full or partial exemption for the harvest stage.
Given the lack of existing tools to universally identify the country of harvest for seafood products, the Biden administration issued an executive order in December 2023 targeted at strengthening the import ban by requiring importers to declare that imports falling under certain trade codes are free of Russian products, even if substantially transformed outside of Russia26 (EO 14114). EO 14114 places the burden of verification on the importer and requires importers to self-certify that, in the case of seafood, their product was not caught within “waters under the jurisdiction of the Russian Federation” or by “Russia-flagged vessels”26. While this requires importers to document one claim related to the provenance of seafood products (Russian-harvested or not Russian-harvested), such a claim is difficult to verify without requiring other key data elements that can be used to investigate the claim or adopting environmental forensic tools to verify claims. As of this writing, the US Customs and Border Protection has proposed a new information collection measure to support E.O. 1411427.
Scientific tools are also improving to facilitate verifying country of origin claims. Most notably, emerging tools include rapid species and population identification by DNA sequencing and geographic and production method provenancing by stable isotope analysis28,29. Species identification by DNA barcoding of the mitochondrial DNA is well established30 and has been used extensively to detect seafood fraud31, including in gadid32 and salmonid33 species. With the advancement of molecular genetic tools, this basic species identification is being expanded to include (i) rapid tools that can be used in the field, (ii) forensic analysis of trace samples, (iii) high throughput screening, and (iv) identification not only of species but also of population. Rapid identification tools, some contained in handheld devices34, are crucial to establish probable cause and allow seizure of fish products for more extensive analyses. Metabarcoding of tissue traces and dust can be used to analyze dust and scraps in fish processing plants and markets35. With increased throughput of modern sequencing techniques, hundreds or thousands of samples can be processed relatively quickly36. Species can therefore be identified by DNA at points of entry, from tissue traces and dust, or with extremely high throughput relatively easily.
One of the most useful developments for verifying country of harvest claims is the identification of spatially segregated populations within species, made possible by the identification of highly discriminatory genetic markers from genome sequencing37. The primary issue in such approaches is whether the distribution of distinguishable populations conform to countries’ fishing grounds or not. For example, Atlantic cod caught by Russian fleet should stem from the Barents Sea, whose cod can be easily distinguished from NW Atlantic cod in US waters by several distinct chromosome inversions38. In Pacific cod, on the other hand, major populations within US (Gulf of Alaska, Bering Sea, Spies, et al. 2021) and South Korean waters38 can be identified using single or few genetic markers, but northern Bering Sea cod are exploited by both US and Russian fleets and country of origin of these fish can therefore not be determined. Accurate identification therefore depends on the extent of population structure of the species in relation to jurisdiction of interest, and in general is more feasible in coastal (e.g., cod) or anadromous species (e.g., pink salmon)39 than in pelagic species with high dispersal (e.g., pollock, tuna, squid)40.
Conclusion
Establishing where seafood was caught or farmed may seem like a simple task, given its centrality in ensuring sustainable management. However, as illustrated above, seafood routed through intermediate countries masks the country of harvest when no further traceability systems are in place. Given the incomplete coverage of key data element (e.g., country of harvest) reporting requirements for most countries, it is clear that existing traceability systems are inadequate for meeting current sustainability and trade-related foreign policy objectives. However, we also argue that the necessary tools exist and that, when operationalized together, these tools can improve seafood traceability.
SIMP represents an important step for the US to ensure the legality and sustainability of its imports and is currently undergoing a comprehensive review to seek input from stakeholders and strengthen its “impact and effectiveness”41. Toward meeting this objective, our work supports three recommendations. First, to meet sustainability and trade-related policy objectives, NOAA could expand SIMP to cover all species (i.e., all products in HS Chapter 3, those products in Chapter 16 under 1604 and 1605, along with fishmeal). Partial coverage allows inadvertent and intentional pathways by which prohibited, IUU-caught, and/or misrepresented seafood can enter US markets. Further, partial product coverage means there is not the required reporting and recordkeeping that would be necessary to broadly detect prohibited trade beyond time-consuming and expensive individual audits and investigations. The data reporting requirement is an important tool for both enforcement and compliance purposes because it provides supply chain data that can be checked using data analysis as well as forensic/identification testing. However, given industry concerns around the burden of the recordkeeping requirement, there may be opportunities to expand the reporting requirement with either a partial or more slowly phased-in recordkeeping requirement for lower risk species.
Second, strengthening the impact and effectiveness of SIMP, especially with any program expansion, necessitates that the administration and Congress direct US agencies to prioritize SIMP implementation and enforcement and that they provide the necessary funding for staffing, training, technology, and engagement with producer and processing countries. Additional resources are not only needed for any expansion of SIMP, but also to implement real-time analysis of SIMP data and for testing to validate and verify reported data. Another key investment area relates to improving recordkeeping and the audit process to minimize costs, as this has been a major concern expressed in public comments.
Third, making data reported as part of the SIMP program publicly available would improve transparency and enable academic and private research focused on improving seafood traceability. While we recognize it is unlikely that the most detailed level of reported data will be made available due to concerns about the proprietary nature of the information, there is a level of aggregation that can protect that interest while enabling greater transparency. Publicly available data would allow non-federal researchers to develop novel methods for detecting risk of infractions, which could complement NOAA’s internal risk assessment models and support companies evaluating IUU and mislabeling risk within their own supply chains. It would also create opportunities for external evaluations and paths to build public appreciation for the program, as well as support consumers to make informed choices regarding the provenance of their seafood. Even without making SIMP data public, there are opportunities for NOAA to seek partnerships within academia and others to develop new methods for risk detection.
A promising sign for seafood traceability is the European Union’s Regulation (EC) No. 1005/2008 on addressing IUU seafood imported into the Union. The EU catch documentation requirement covers all imported seafood, and the harvest vessel flag state must validate catch certificates in order to follow the product throughout the market and trade channels42. There have been discrepancies in the handling of enforcement by individual states and until recently there was limited public transparency42. However, the new amendment requires mandatory use by 2026 of the EU IUU catch certificate database (CATCH) by EU importers, with strong encouragement for use by non-EU exporters. Although CATCH does not necessarily allow for public-facing transparency, it does provide access to third-party country operators and authorities.
The complex and global nature of seafood supply chains necessitates global strategies to improve transparency. However, to maximize effectiveness and minimize costs of species and geographical expansions of seafood import monitoring programs, it is important to coordinate the standards and ensure data systems are interoperable. Existing programs already lay this foundation, as some companies voluntarily adhere to the Global Dialogue on Seafood Traceability data standards and thus enable data transformations to fulfill US SIMP and EU catch certificate reporting requirements. Outside of country-specific reporting requirements, international monitoring of seafood trade can be improved through further improvements in the taxonomic specificity of harmonized system codes15,43,44. Finally, supply chains participating in certification programs such as the Marine Stewardship Council demonstrate that categories of seafood can remain segregated even through processing stages. While some specific goals and incentives for these certification programs are distinct from existing import monitoring programs, they address analogous challenges and thus may be useful templates for improvements. Further, to the extent these public and private programs can complement and align with one another, there are likely opportunities to reduce implementation costs.
Regardless of the specific motivation—whether countries want to ensure their trade restrictions are working, as in the case of Russian fish, or whether they want to ensure in general that their seafood is not mislabeled or caught illegally, unsustainably, or by forced labor—having robust and reliable traceability is essential. As the EU updates its program, the US reviews its own, and other countries, such as Australia, Japan and South Korea, consider adopting new seafood import programs, there is a prime opportunity to align not only the reporting requirements, but also ensure the data can be shared among countries. Each additional piece of information countries make available will improve the picture of our global seafood. Improving the quantity, resolution, and availability of global data on seafood supply chains will leave fewer shadows to hide those who are engaging in harmful activities and create necessary assurances for consumers that the seafood they eat aligns with their values.


Responses