Exploring effects of platelet contractility on the kinetics, thermodynamics, and mechanisms of fibrin clot contraction
Introduction
When a blood vessel is injured, platelets, 2–4 µm anucleate cell fragments circulating in blood, accumulate at the site of injury to form a provisional plug. This plug is reinforced by a 3D network of polymeric proteinaceous fibrin fibers, the end product of blood clotting, which helps to stabilize the blood clot and stop bleeding (this process is referred to as hemostasis)1,2. After the protective blood clot has formed, it undergoes contraction, i.e., volumetric shrinkage, driven by the activated platelets. During clot formation, thrombin-activated platelets within the clot extend membrane protrusions (filopodia) that attach to adjacent fibrin fibers. These filopodia contract actively due to the intracellular actin-myosin traction force machinery, pulling on the fibrin fibers, which results in the fibrin fibers’ bending and shortening3. During this process, the overall size of the clot is substantially reduced, which makes the clot denser and less porous, to better seal the injury.
In many pathological conditions, an unwanted obstructive blood clot called a thrombus is formed inside a blood vessel in vivo. The thrombus can also undergo contraction driven by the same mechanism that includes platelet contractility and the interaction of contracting platelet protrusions with the fibrin network. Contraction makes the thrombus more compact, thus rendering the thrombotic mass less obstructive, enlarging the blood vessel lumen and restoring the local blood flow. Other pathophysiological consequences of thrombus contraction include the altered sensitivity to enzymatic dissolution4 and increased mechanical stability or resistance to rupture, therefore preventing life-threatening thrombotic embolism5,6. Overall, blood clot contraction plays a significant role in hemostasis and thrombosis and many disorders related to blood clotting7. Therefore, understanding the mechanisms of clot contraction is important for developing strategies to control bleeding or thrombotic complications in various medical areas, including surgery, trauma care, cardiovascular medicine, obstetrics, hematology, etc.
The ability of blood clots to contract depends on various factors that include platelet contractility, the composition of the clot, serum viscosity, and other intrinsic and environmental factors that modulate clot contraction8. Another important determinant of platelet contractility is the platelet count, since platelets are the essential force-generating component of blood clots. The normal platelet counts in adult humans ranges from 150,000 to 450,000 platelets per one microliter of whole blood corresponding to about double the values in platelet-rich blood plasma without red blood cells9. Individuals with low platelet counts, a condition known as thrombocytopenia, might have impaired clot formation and contraction8,10. Conversely, patients with high platelet counts, a condition known as thrombocytosis, might exhibit enhanced clot formation and contraction if platelet function is not compromised. Therefore, predicting the blood clot contraction dynamics at various platelet counts is clinically important.
Most of the knowledge about clot contraction has been gleaned from experimental observations that have objective limitations related mainly to the complex multifactorial nature of the clot contraction process. Indeed, the structural complexity of the 3D-fibrin fiber network with imbedded platelets, the kinetics of filopodia extension-retraction and their interactions with the fibrin fibers, and the mechanical response of fibrin fibers to the contractile stress makes it difficult to explore the clot contraction process using experiments alone. Furthermore, many characteristic features of blood clots and their dynamic structural and mechanical properties cannot be measured directly. The empirical boundaries can be expanded by combining the experimental approaches with accurate computational models to explore numerically the clot contraction process. The main challenges, however, are to capture the physical processes involved in clot contraction with structural and mechanistic details, including high spatial and temporal resolutions, which are inaccessible experimentally. Meaningful simulations of clot contraction must be realistic (with no or minimal simplifying assumptions and approximations), must follow the contraction dynamics of a “thermodynamically large” fibrin clot (formed by thousands of platelets and fibrin fibers) over a long enough contraction time, and must be predictive.
Prior computational studies of clot contraction focused on the mechanical aspects most important for contraction and the role played by clot components11,12,13,14,15,16,17,18,19. Several theoretical studies explored thermodynamic aspects of clot contraction12, and the difference between the asynchronous versus asymmetric behavior of platelets during clot contraction20,21. More recently, two clot structure-based computational models have been proposed to probe the dynamics of clot contraction21,22,23,24. Notwithstanding these modeling efforts, the driving forces and mechanisms of structural rearrangement of the contracting blood clots are still not well understood. The challenge is to be able to simulate the clot of large enough size (so that its properties are size-independent), while also preserving structural details for fibrin fibers and platelets. Once parameterized against the experimental structural, kinetics and mechanics data available, such models can then be used to predict the response of clots to various pathological condition and therapeutic interventions25,26,27,28.
We employed the Stochastic Reaction-Diffusion-Dynamics model (SRDDM)25,26, which combines mechanical kinematics and biochemical kinetics (filopodia extension-retraction, filopodia-fibrin association-dissociation reactions), thermal motion of platelets in the fibrin fiber network, and Langevin dynamics-based representation of the mechanical processes, which include stretching and bending of fibrin fibers due to contractile stress in the fibrin network, and other force-dependent interactions, such as platelet-fibrin fiber interactions and formation of inter-fiber cohesive bonds. The SRDDM was mapped into the ClotDynaMo framework. The important features of ClotDynaMo are: 1) detailed clot structural resolution (down to fibrin fibers connected with 3- and 4-degree nodes, platelets, filopodia, and fibrin-filopodia non-covalent linkages); 2) realistic kinetics of the filopodia extension-retraction cycles; 3) the large size of the fibrin clot reconstructed in silico (~2 × 106 µm3); and 4) biologically relevant 15–20 min long contraction timescale. Because we consider experimental validation of theoretical models essential for their accuracy and predictive power in practical applications, we parameterized our model using the experimental data presented in this work or published earlier3. We also developed a continuum model of clot contraction following our prior publication29. In this model, the 8-chain model of polymer elasticity extended to fibrin gels incorporates active forces due to platelet contractility. The mechanics (through active forces) depend on the platelet count and microscopic variables (e.g. filopodia length), and the contraction kinetics depends on serum viscosity.
We perform the ClotDynaMo based experiments in silico to explore the influence of plasma viscosity and several important quantitative characteristics of platelet contractility, such as filopodia extension-retraction speed, filopodia traction force, and length of filopodia, on the kinetics, thermodynamics, and mechanisms of the fibrin clot contraction. The results obtained reveal the following: i) clot-size dependence of the kinetics of clot contraction, ii) variation of the kinetic rate and final extent of contraction on serum viscosity, iii) effects of various degrees of platelet activation, iv) minimum clot size required for determining accurate thermodynamics, v) large contributions from the entropy reduction to the free energies of fibrin clot contraction, and vi) nuanced differences identified in the mechanisms of clot contraction that depend on platelet contractility. These results helped us formulate a thermodynamic “optimal contraction principle”, according to which the fibrin clot is viewed as a complex multi-component dynamical system that contracts by maximizing the clot volume change (biological function) while also minimizing the free energy of contraction (energy requirement). The continuum model predictions for the kinetics of fibrin clot contraction and dependence of contractive stresses in the fibrin network for different values of platelet counts are in good agreement with experiments and simulation.
Results
Experimental studies of the kinetics of fibrin clot contraction and structure of a contracted clot
Macroscopic 80-µl fibrin clots were formed by addition of thrombin to fresh citrated human PRP containing ~1,000,000, 450,000 or 100,000 platelets per 1 µl, and changes in the clot size were tracked optically over 20 min (Fig. 1a). The contraction kinetics (Fig. 1b) was quantified using two parameters: i) the rate of clot shrinkage measured as the slope of the kinetic curve and ii) the final extent of contraction reaching a plateau at the 20 min point as the relative reduction in clot size (%) compared to the initial state. The comparative averaged numbers clearly show that both the rate (Fig. 1c) and final extent (Fig. 1d) of clot contraction depend directly on the platelet counts, with the effect on the rate being the most pronounced. The kinetics of volumetric clot shrinkage have been complemented with the ultrastructural changes during clot contraction revealed with scanning electron microscopy. The fibrin network in the uncontracted clot is isotropic with random orientation and mostly uniform distribution of fibrin fibers; sparse single platelets are visualized in the clot (Fig. 1e). The same clot after contraction has a highly non-uniform structure with the large platelet-fibrin agglomerates, in which fibrin fibers are mostly bundled and oriented towards the single and aggregated platelets (Fig. 1f). Unlike in the uncontracted clot, the overall structure of the contracted clot is very dense with extremely low porosity.
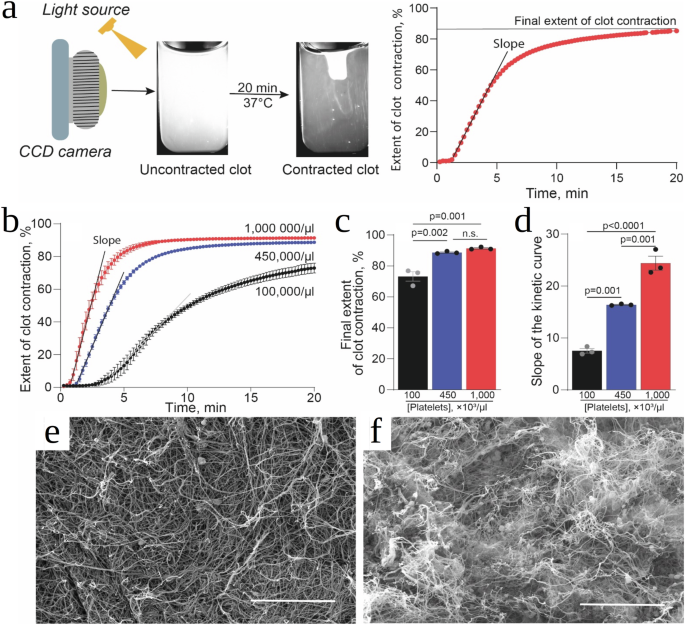
a A PRP sample pre-activated by thrombin (80 μl) was placed into a plastic cuvette pre-lubricated with a detergent to prevent sticking to the walls and allowed to clot and contract, followed by the photographic registration of the dynamic clot size (left). The serial clot images were converted to a kinetic curve, which shows the extent of clot contraction as a function of time (right). The clot contraction kinetics were characterized by the slope of the kinetic curve (reflecting the rate of clot contraction) and the final extent of contraction at 20 min after addition of thrombin. b Experimental kinetic curves of thrombin-induced clot contraction in platelet-rich plasma containing normal (blue, 450,000/µl), reduced (black, 100,000/µl), and elevated (red, 1,000,000/µl) platelet counts. c, d Comparative averaged numbers for the final extent of clot contraction (c) and the slope of the kinetic curves reflecting the rate of clot contraction (d) at various platelet counts. Results are presented as mean ± SEM ((n=) 3). e, f Representative scanning electron micrographs of clots from the same PRP sample (450,000 platelets/µl) showing a fibrin-platelet meshwork before (e) and after (f) contraction. Scale bars are 15 µm.
Stochastic reaction-diffusion-dynamics model of fibrin clot contraction
In our prior studies25,26, we formulated the general Stochastic Reaction-Diffusion-Dynamics model of biological processes (SRDDM; Fig. 2a), which describes the coupled mechanical system’s components, chemical degrees of freedom for biochemical reactions and thermal displacements for biological particles in the system’s volume (Fig. 2a). Here, we use the SRDDM approach to focus on the phase of “active contraction”.
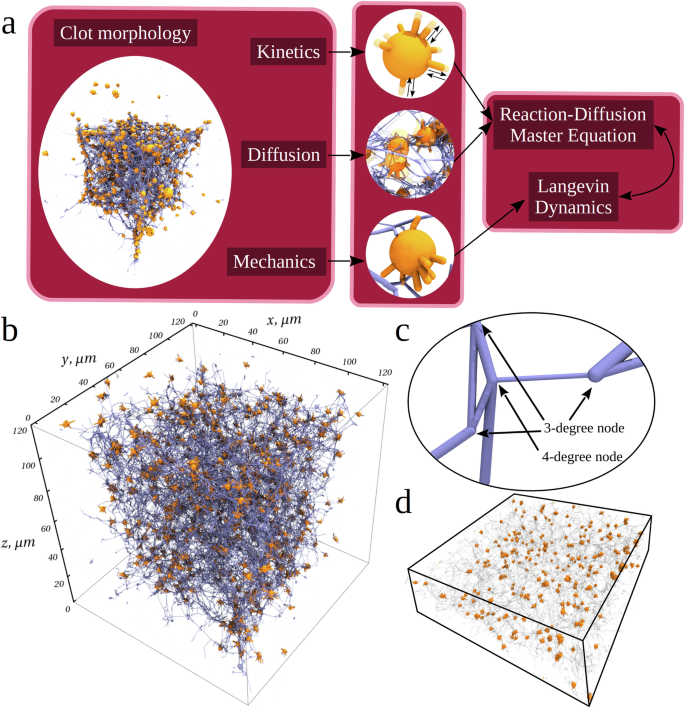
a The SRDDM requires the initial input available from experiment (distributions of the fibrin fiber lengths and diameters, density of 3- and 4-degree nodes, platelet count, platelet size, etc.) to describe the fibrin clot structure and shape and geometry of spatial arrangements of different components. The SRDDM couples the kinematics (cyclic extension-retraction of filopodia protrusions), kinetics (formation-dissociation of bonds between platelet filopodia and fibrin fibers), mass transport (translocation of fibrin fibers and platelets), and mechanics (interaction between platelets and fibrin fibers, bending of fibrin fibers, fibrin densification, associations of platelets). Kinetics and transport are described using the stochastic reaction-diffusion formalism, whereas mechanics is described using the Langevin dynamics (Methods). The model parameters also include the number of filopodia per platelet, speed of filopodium extension-retraction, the on- and off-rates for formation and dissociation of non-covalent bonds between platelets and fibrin fibers, as well as the mechanical force field, which includes stretching and bending rigidities of fibrin fibers, filopodium length and diameter, filopodium traction force (list of parameters is in Supplementary Table 1). b Initial configuration of the 120 µm × 120 µm × 120 µm fibrin clot reconstructed as described in Methods. Small orange spheres with thin orange protrusions represent platelets with filopodia inside the 3D fibrin network represented by thin blue lines converging at 3- and 4-degree nodes. There is a total of ~780 platelets in a fibrin network formed by ~5.1 × 10⁴ fibrin fibers; there is a total of ~3.4 × 10⁴ nodes, of which ~2.9 × 10⁴ are 3-degree nodes and ~5.5 × 10³ are 4-degree nodes. Each platelet has 8 filopodia extending and contracting in random directions at each time point. c A close-up view of the fibrin network depicting the fibrin fibers of different lengths and diameters (see Supplementary Fig. 1) forming the 3-degree and 4-degree nodes (indicated by the arrows). d A 40 µm cross-section of the central portion of fibrin clot (from panel b) showing the initial distribution of platelets (orange spheres) in the fibrin network (transparent cylinders).
Model components
The fibrin fibers are represented as cylinder segments with varying lengths and diameters (Supplementary Fig. 1)30. These segments connect a pair of nodes forming a 3D fibrin network characterized by the 3-degree and 4-degree nodes (branchpoints in fibrin network). We used the experimental densities of the 3- and 4-degres nodes, ({rho }_{3}=) 0.02 µm−3 and ρ4 = 0.00379 µm−3 (Supplementary Table 1)30. To make the fibrin fibers bend and stretch, each fiber is divided into four connected cylinders of equal length to accommodate smoother bending. We used the experimental values of fibrin fiber stretching modulus Er = 11.5 MPa and bending modulus Eθ = 14.5 MPa (Supplementary Table 1)31. The activated platelets are soft spheres with R = 1.5 µm radius, which corresponds roughly to their natural size3. There are n = 8 filopodia per one platelet with diameter d = 0.42 µm (Supplementary Table 1)3 that undergo reversible extension with the speed vext and retraction with the speed vret (Fig. 2a). The filopodia and fibrin fibers are mutually adhesive. The filopodia-fiber bonds are represented by spherical beads connected by harmonic springs. Experimental movies show that when a filopodium touches a fibrin fiber, it attaches to it almost immediately3, which corresponds to a large on-rate kon32. These attachments form due to the non-covalent interaction of fibrin molecules with activated integrin αIIbβ3 on the filopodium33. When the filopodium begins to retract, it exerts a force (Supplementary Table 1)3, pulling the fibrin fibers towards the platelet body. Experimental movies show that the platelet-fibrin bonds rarely dissociate during the filopodium retraction (~0–30 s)3, which corresponds to a small off-rate koff.
Filopodia extension-retraction kinetics
Following the experimental results, we model the kinetics of extension and retraction of platelet filopodia using equal extension and retraction speeds, i.e. (v={v}_{{ext}}={v}_{{ret}}=) 0.1 µm/s (Supplementary Table 1). We set the frequencies of extension and retraction ({omega }_{{ext}}={omega }_{{ret}}=) 106 s−1 to correspond to ({v}_{{ext}}={v}_{{ret}}=) 0.1 µm/s (Supplementary Table 1), and we use Δl = 10−7 µm as the length increment. Each filopodium protrudes from the platelet surface in a random radial direction from the platelet center. We set the extension of filopodia (filopodia length) to the experimental value l = 2.8 µm (Supplementary Table 1)3. Each filopodium connects to only one fibrin fiber. We set the total number of filopodia that extend/retract per platelet to n = 8 (Supplementary Table 1), which is the most probable number of filopodia per platelet3. When a filopodium retracts, another filopodium starts to extend in a random direction.
Filopodia-fibrin interaction kinetics
When an extending filopodium reaches a fibrin fiber, strong non-covalent bonds form. The probability of platelet-fibrin fiber bond formation is described using the stochastic kinetics approach (Methods). Experiments show that the platelet-fibrin bonds form immediately when filopodia and fibers come into contact (Supplementary Table 1), after which the filopodium begins to retract, thereby pulling on a fibrin fiber. We set the traction force per single filopodium to the experimental 1 nN value (Supplementary Table 1)3. The force application results in the force-induced bending of the fibrin fibers, and their pulling towards the platelet body by filopodia results in accumulation of fibrin mass on or near the platelet surface leading to fibrin densification. Experiments show that filopodium-fiber bond dissociation events are rare3. Considering the rapid association between fibrin fibers and filopodia and rare dissociation of the filopodia from the fibrin fibers observed experimentally3, we set the on-rate and off-rate to kon = 6 s−1 and koff = 0.6 s−[132,34 (Supplementary Table 1).
Mechanics of fibrin clot
We introduce the potential energies for fibrin fibers, platelets, and filopodia, for their mechanical interactions (between fibrin fibers, between platelets, between platelets and fibrin fibers), and the linkages (filopodia-fiber bonds) they form. The mechanical energy U(r) (force field; Eq. (8)) for the fibrin clot configuration r is specified in terms of the positions of all N mechanical components (i.e. fibrin fibers, platelets, and filopodia), ({boldsymbol{r}}={{boldsymbol{r}}}_{1},{{boldsymbol{r}}}_{2},ldots ,{{boldsymbol{r}}}_{N}). (Uleft({boldsymbol{r}}right)) is the sum of potential energies for mechanical components and non-covalent linkages they form. ({U}_{{fib}}({{boldsymbol{r}}}_{{fib}},{theta }_{{fib}})), ({U}_{p}({{boldsymbol{r}}}_{p},{{boldsymbol{r}}}_{f})), and ({U}^{{att}}({{boldsymbol{r}}}_{{fib}},{{boldsymbol{r}}}_{f})) are the potential energies for fibrin fibers, for platelets, and for the linkages between the fibrin fibers and platelets’ filopodia, where ({{boldsymbol{r}}}_{{fib}}), ({{boldsymbol{r}}}_{p}), and ({{boldsymbol{r}}}_{f}) are the 3D position vectors for fibrin fibers, platelets, and filopodia, respectively, and ({theta }_{{fib}}) is the angle between two fibrin cylinders connected in series. ({U}_{{fib}}({{boldsymbol{r}}}_{{fib}},{theta }_{{fib}})) accounts for fibrin fibers forming the fibrin network including fiber-fiber interactions, which result in formation of cohesive bonds and subsequent compaction of the fibrin fibers into unstructured fibrin agglomerates on the surface of platelets. ({U}_{p}({{boldsymbol{r}}}_{p},{{boldsymbol{r}}}_{f})) accounts for platelets embedded in the fibrin network including associations of single platelets into larger groups (secondary clusters). ({U}^{{att}}({{boldsymbol{r}}}_{{fib}},{{boldsymbol{r}}}_{f})) considers formation of the platelet-fibrin attachments. The model also describes the excluded volume interactions between fibers, between platelets, and between fibers and platelets.
Dynamics of the whole (bulk) fibrin clot contraction is generated by solving the Langevin equations of motion for all the mechanical components (fibrin fibers, platelet bodies, and filopodia) using the fibrin clot force field (Methods). This enables us to describe the dynamic mechanical processes, including the platelet filopodia pulling on the fibrin fibers, bending, kinking and stretching of fibrin fibers, development of platelet clumps, and association of fibrin fibers into thicker bundles, resulting in a dramatic volume reduction of the fibrin clot as a whole.
Validation of fibrin clot contraction model
The initial 3D structure of the 120 µm × 120 µm × 120 µm fibrin clot was generated (as described in SI) to preserve: i) the length and diameter of the fibrin fibers; ii) the densities of the 3-degree and 4-degree nodes; and iii) the spatial distribution of platelets and iv) platelet count (see Supplementary Table 1). The 3D-structure of the fibrin clot with the initial clot volume is ({V}_{0}=) 1.7 × 106 µm3 is displayed in Fig. 2b.
Dynamic structural remodeling of fibrin network
We carried out the simulations of fibrin clot contraction for the normal 450,000/μl platelet count and the experimental values of model parameters (Supplementary Table 1) to correlate the results obtained in silico and in vitro (Figs. 3 and 4). Structure snapshots before and after 15 min of the contraction show shrinkage of the fibrin clot from all 6 cubic faces towards the cube center, which is accompanied by a dramatic >9-fold reduction of the clot volume (Fig. 3a; see also Supplementary Movie 1) to the final volume V = 1.9 × 105 µm3. These results are in full agreement with the experimental findings for the active contraction phase3. We also profiled the mean area of compacted fibrin on the platelet surface, the area of platelet associations, and the average platelet velocity as functions of the time of contraction, obtained from the simulations, with the same characteristics, extracted from the experiments. Supplementary Fig. 2 shows very good agreement in all three cases. Therefore, the model correctly captures: 1) the fibrin compaction into fiber bundles and their accumulation on the surface of platelets (Figs. 3b and 1f; see also Supplementary Movie 2); 2) reduction of the platelet-platelet distances and association of single platelets into larger groups of two, three, and more platelets (Fig. 3c; see also Supplementary Movie 3); and 3) translocation of the platelets towards the center of the fibrin network (Fig. 3d).
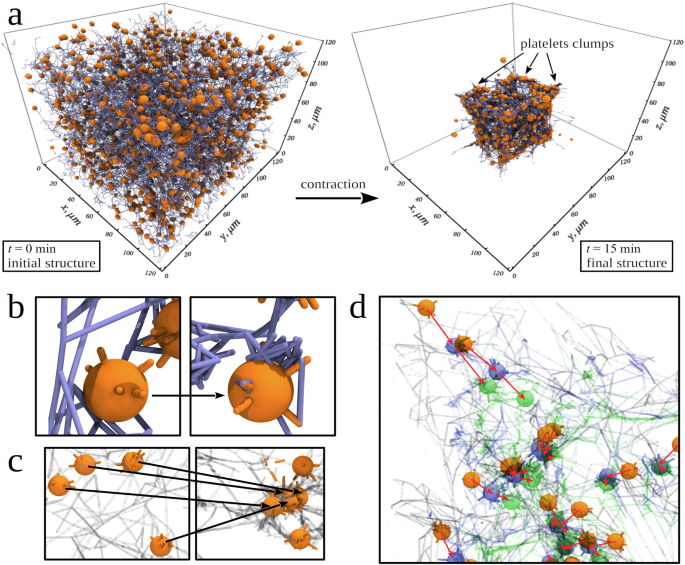
a Snapshots of the initial intact structure ((t=) 0 min) and final contracted structure after (t=) 15 min of contraction of the cubic fibrin clot formed by fibrin fibers (blue cylinders) and activated platelets (orange spheres) with protruding filopodia (orange cylinders). The final contracted structure shows qualitatively the dramatic size reduction, fibrin network densification, and platelet associations. b A close-up view of the fibrin network at (t=) 0 min and (t=) 4 min, showing fibrin fibers accumulating on the surface of a platelet. c Snapshots of platelets at (t=) 0 min and (t=) 4 min, illustrating the platelet association. d A close-up view of one corner of the fibrin network, showing platelets before contraction (orange), and after 4 min (blue) and 10 min (green) of clot contraction. Red arrows help visualize displacements of individual platelets. In (c, d), fibrin fibers are visualized as transparent cylinders.
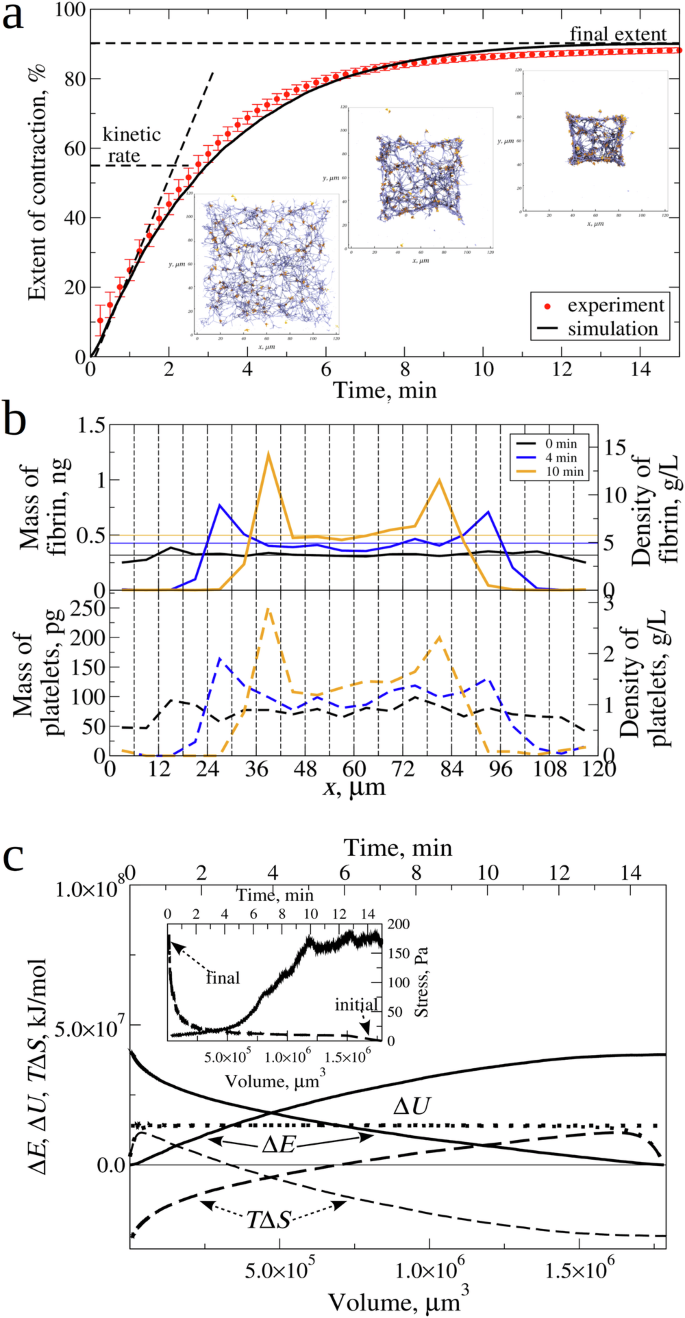
a Experimental curve (red data points) and simulated (experimental reference) curve (solid black lines) of clot contraction in platelet-rich plasma with a normal (4.5 × 10⁵/µl) platelet count, showing the kinetic rate (K) and final extent of contraction (C) (see Table 1). The insets are snapshots of the central 20 µm square cross-section of the intact fibrin clot before contraction (at (t=) 0) and after (t=) 4 min and (t=) 10 min of contraction. The snapshots show fibrin fibers (blue cylinders) and platelets (orange spheres) with the filopodia arms (orange cylinders). b The mass and density distributions of the fibrin network (upper panel) and platelets (lower panel), corresponding to the simulated kinetic curve (a), profiled along the (x)-axis of clot length. The 120 µm length of the fibrin clot was divided into 20 3D-bins of equal size (6 µm × 120 µm × 120 µm), and the values of mass/density were calculated for each bin. We see the initial uniform distribution before the contraction (at (t=) 0; black line), and non-uniform distribution due to network densification and platelets association and mass shift towards the clot center after (t=) 4 min (blue line) and 10 min (orange line) of contraction. In the upper panel, thin horizontal lines show the average density of fibrin network across the clot length. c Changes in the free energy (Delta E) (solid curves), entropy (TDelta S) (dashed curves), and mechanical energy (Delta U) (dotted curves) profiled as functions of time (t) (the upper (x)-axis) and clot volume V (the bottom (x)-axis). The inset shows the contractile stress (the right (y)–axis) for the fibrin clot contraction as a function of (t) (upper (x)-axis) and (V) (bottom (x)-axis).
Kinetics of fibrin clot contraction
We correlated the experimental and simulated kinetic curves of the fibrin clot contraction, where we compared the extent of clot contraction, (frac{left({V}_{0}-Vleft(tright)right)}{{V}_{0}}) ((Vleft(tright)) is the clot volume at time t), as a function of the time of contraction t. In Fig. 4a, the experimental and simulated kinetic data practically collapse on the same curve. The snapshots of the 20 µm central cross-section of the clot taken at different t = 0, 4 min, and 10 min time points from the simulations (Fig. 4a) can be compared with the experimental SEM images (Fig. 1e, f). We analyzed the mass and density profiles (along the x-axis of length) for the fibrin network and for the platelets corresponding to the t = 0 min, 4 min, and 10 min time points. Fig. 4b shows the uniform distributions of mass and density for fibrin network and platelets before fibrin clot contraction (t = 0) vs. non-uniform mass/density distributions after 4 min and 10 min of contraction, reaching their maximum values near the clot center. This is highly consistent with the ultrastructural alterations of the contracted clot observed using scanning electron microscopy (Fig. 1f). A ~ 1.5-fold increase in the average density of the simulated fibrin network after the 10 min of contraction agrees with an experimental 1.4-fold increase24.
Mechanics of fibrin clot contraction
We compared the experimental and simulated data for the mechanics of the fibrin clot contraction. For the simulated data displayed in Fig. 4a, we calculated the total contractile stress σ experienced by the fibrin clot during contraction and profiled it as a function of time of contraction t and as a function of the clot volume V. The σ vs. t profile (the inset to Fig. 4c) shows that the maximum stress ({sigma }_{max }) accumulated in the fibrin clot by the end of the contraction process reaches the ~150 Pa stress level. This agrees very well with the experimental data3. We converted the simulated σ vs. t profile into the σ vs. V profile (the inset to Fig. 4c). The integral (int sigma {dV}) can be evaluated to calculate the total work of contraction w, and to access the thermodynamic state functions.
To summarize, we have obtained a very good qualitative and quantitative agreement between the experimental and simulated data for dynamic structural remodeling of the fibrin network (Fig. 3), and for the kinetics (Fig. 4 and Supplementary Fig. 2) and mechanics (Fig. 4c) of fibrin clot contraction. These multiple points of agreement validate the computational model.
Dependence of contraction kinetics on fibrin clot size
In the two recent computational studies, the initial clot volume was set to ~5.6 × 104 µm324 and to 8.6 × 105 µm321. For comparison, the initial clot volume used in the experiment (Fig. 1a–d) is much higher (80 mm3), and so there is a question whether the kinetics of fibrin clot contraction depends on the clot size. In the simulations, we set ({V}_{0}) to 5 × 104 µm3, 2.2 × 105 µm3, 3.7 × 105 µm3, 8.6 × 105 µm3, 1.7 × 106 µm3, 3.4 × 106 µm3 and to 9.1 × 107 µm3. For each value of ({V}_{0}), we calculated the average kinetic rate of contraction K and the final extent of contraction C. Both K and C are graphically defined in Figs. 1b and 4a; K quantitates how rapidly the contraction occurs; and C shows how complete the contraction is. The results presented in Supplementary Fig. 3 show that the kinetic rate K strongly depends on the initial clot size for V0 < 1.5 × 106 µm3 and is independent of the initial clot size for V0 > 1.5 × 106 µm3, and that the final extent of contraction C is independent of the initial clot size. Hence, the kinetics of clot contraction (K and C) for the macroscopic clot with V0 = 25–100 mm3 can be studied using the microscopic clot with V0 > 1.5 × 106 µm3, since the kinetic rates and final extensions are quite similar. We used the cubic 1.7 × 106 µm3 fibrin clot to explore the dynamics of clot contraction.
Dependence of kinetics of fibrin clot shrinkage on serum viscosity
To explore how fibrin clot contraction depends on the viscosity of plasma (serum) η, we performed the ClotDynaMo simulations (at 37 °C temperature) in which we varied the serum viscosity by setting η to 1.0 cP, 1.1 cP, 1.2 cP, and 1.3 cP (3 runs per each value of η), while constraining the other model parameters to their values listed in Supplementary Table 1. Because the choice of values of the model parameters accumulated in Supplementary Table 1 correspond to the simulated kinetic curve which best fits the experimental kinetic curve of the fibrin clot contraction (see Fig. 4a) used as a reference point for model validation (see previous section), we refer to these parameters (values) (Supplementary Table 1) as “experimental reference parameters (values)”. The kinetic curves are compared in Fig. 5a, and the values of K and C are accumulated in Table 1. Interestingly, varying η changes the kinetic rate K, but does not affect the asymptotic level C (see the inset to Fig. 5a). K decreases from 4.2 × 10⁻³ s−1 to 3.2 × 10⁻³ s−1 ( ~1.5-fold drop) while (C) fluctuates around the ~89–90% when (eta) is increased from 1.0 cP to 1.3 cP. Hence, (K) strongly depends on (eta), but (C) is independent of (eta).
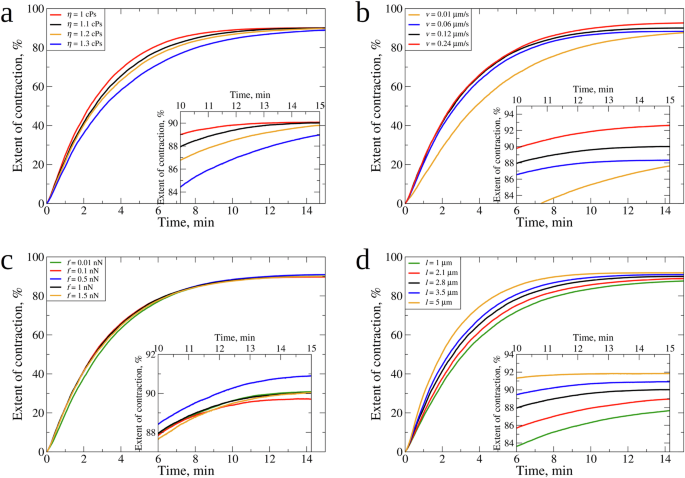
Compared are the simulated kinetic curves obtained for different values of (a): serum viscosity: (eta =) 1.0 cP, 1.1 cP, 1.2 cP, and 1.3 cP; b filopodia extension-retraction speed: (v=) 0.01 µm/s, 0.06 µm/s, 0.12 µm/s, and 0.24 µm/s; c: filopodia traction force: (f=) 0.01 nN, 0.1 nN, 0.5 nN, 1.0 nN, and 1.5 nN; and (d) filopodia length: (l=) 1.0 µm, 2.1 µm, 2.8 µm, 3.5 µm, and 5.0 µm. In panels (a–d), the insets magnify the last 5 min dynamics of fibrin clot contraction (Table 1). Color denotation is provided for each graph. In panel (a–d), the same kinetic curve obtained for the experimental reference parameters (see Fig. 4a and Supplementary Table 1), is shown in black color.
Dependence of kinetics of fibrin clot shrinkage on contractile activity of platelets
Since the fibrin network shrinkage is driven by platelet traction forces that are transmitted to fibrin fibers by platelet filopodia30, we explored how platelet contractility affects the kinetics of clot contraction. By modulating the input parameters of platelet contractility, including mechanics and kinematics of filopodia, we mimicked various degrees of platelet activation determined by the strength of an activating stimulus and platelet reactivity. In a previous study, the effect of the number of filopodia on the kinetics of fibrin clot contraction was explored24. Here, we probed the importance of several other quantitative characteristics of platelet contractile activity. In the ClotDynaMo-based simulations at 37 °C temperature, we separately varied the speed of filopodia extension-retraction (v) between 0.01 µm/s, 0.06 µm/s, 0.12 µm/s, and 0.24 µm/s, the filopodia pulling forces (f) between 0.01 nN, 0.1 nN, 0.5 nN, 1.0 nN, and 1.5 nN, and the filopodia length (l) between 1.0 µm, 2.1 µm, 2.8 µm, 3.5 µm, and 5 µm, while setting the other model parameters to their experimental reference values (Supplementary Table 1). We used the simulated kinetic curves (Fig. 5a–d) to compare the values of (K) and (C) (see Table 1). Increasing (v=) 0.06 µm/s two-fold (to 0.12 µm/s) and four-fold (to 0.24 µm/s) barely affects (K), which increases from 3.5 × 10⁻³ s−1 to 3.8 × 10⁻³ s−1 (8% increase), and (C), which fluctuates around 88–92%. Decreasing (v) six-fold from 0.06 µm/s to 0.01 µm/s results in ~1.5-fold drop in (K) (to 2.3 × 10⁻³ s−1), and (C) does not change much (~88%), respectively. Next, increasing (f) from 0.1 nN, to 0.5 nN, to 1.0 nN, and to 1.5 nN does not result in substantial changes in the kinetics and extent of clot contraction, since neither (K) (= 3.7–3.8 × 10⁻³ s−1) nor (C) (= 88–90%) change much. Decreasing (f) ten-fold from 0.1 nN to 0.01 nN changes (K) and (C) only slightly – to 3.3 × 10⁻³ s−1 and 90%, respectively. Finally, increasing (l) from 1 µm to 2.1 µm, to 2.8 µm to 3.5 µm, and to 5 µm results in an increase in (K) from 3.0 × 10⁻³ s−1 to 5.0 × 10⁻³ s−1 and a 3% increase in (C) from 88% to 92%. These results reveal correlations between the kinetic rate (K) and final extent (C) of the fibrin clot contraction and platelet contractility characteristics: (K) strongly depends on (l), but weakly depends on (v) and (f); (C) depends on (l), and weakly depends on (v) and (f) (Fig. 5 and Table 1).
Predictions of continuum model for higher and lower platelet counts
We assume that (tau (eta )) and (q(l)) are linearly dependent on their corresponding parameters and that (pleft(cright)) saturates at high platelet counts. This provides a good fit to the simulation data for (c=) 450,000/µl. Specifically, we find that
At a low platelet count, the expression for (pleft(cright)) can be approximated as linear in (c) which is reasonable because force is an additive quantity. At high values of the platelet count the contraction saturates because fibrin fibers and platelets have finite size and the expression for (pleft(cright)) (Eq. (1)) accounts for this. A linear dependence of (tau) on (eta) is also reasonable since the time constant in simulations is likely governed by frictional forces in the relative motion of fibers and serum, or on the drag coefficient between fibers and serum which depends linearly on the serum viscosity (eta). With the functional forms (Eqs. (1)-(3)) specified, we were able to predict the fibrin clot contraction behavior with a set of values for (eta) and (l). Supplementary Fig. 4 and Supplementary Fig. 5 show the extent of contraction as a function of time. The initial slope (kinetic rate (K)) and final extent of contraction (C) for the platelet count of 450,000/µl is accurately captured by the continuum model. The model predictions for (K) and (C) for higher and lower platelet counts are displayed in Fig. 6, which shows that higher values of (eta) lead to slower (K) for all values of the platelet count, since fibrin fibers and platelets move slower through more viscous serum liquid. Longer filopodia length (l) increase both (K) and (C) for all platelet count values.
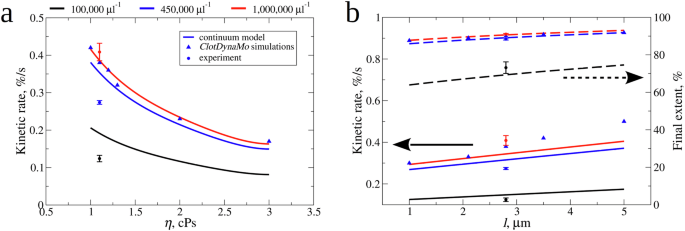
Shown are the values of kinetic rates (K) obtained experimentally (spheres), from ClotDynaMo simulations (triangles), and from continuum model (solid lines) vs. (a): serum viscosity (eta) and (b): filopodia length (l) (left (y)-axis). Also shown are the values of final extent of contraction (C) obtained experimentally (spheres), from ClotDynaMo simulations (triangles), and from continuum model (dashed lines) vs. filopodia length (l) (panel b; right (y)-axis). The continuum model-based predictions were made for three different values of platelet count: 100,000 µl−1 (black curves), 450,000 µl−1 (blue curves), and 1,000,000 µl−1 (red curves).
Changes in thermodynamic state functions associated with fibrin clot contraction
We calculated the time- and volume-dependent changes in the free energy (Delta E), the internal energy (Delta U), and the entropy (TDelta S) (Fig. 4c) as described in SI. The changes in these quantities associated with the complete clot contraction (to the final volume (V={V}_{f})) are accumulated in Table 2. Both (Delta E) and ({|T}Delta {S|}) increase with (t), which correlates with the time-dependent ascending kinetic curves, and decrease with (V), which correlates with the descending (sigma)–(V) curve. The smaller the volume of fibrin clot, which progressively shrinks over time (t), the higher is (sigma), and the larger is (w). This means that (Delta E), (Delta U), and (TDelta S) all gradually increase with the increasing (t) and with the decreasing (V). Interestingly, (Delta U) levels off in the first 1–2 min of contraction and remains relatively small during the contraction process. We arrive at the same conclusions by inspecting changes in thermodynamics state functions for the complete clot contraction, (Delta E=) 3.9 × 10⁷ kJ/mol, (TDelta S=) −2.6 × 10⁷ kJ/mol, and (Delta U=) 1.3 × 10⁷ kJ/mol (Table 2). These numbers imply that the fibrin clot contraction is mainly driven by the entropy changes.
We explored the influence of serum viscosity and platelet contractile activity on the thermodynamics of fibrin clot contraction. The free energy change (Delta E), the internal energy change (Delta U), and the entropy change (TDelta S) shown in Fig. 7 as functions of (t) and (V). The values of (Delta E), (Delta U), and (TDelta S) for the complete clot contraction are accumulated in Table 2. While the time profiles of (Delta E), (Delta U), and (TDelta S) show variation for variable (eta), the volume profiles of (Delta E), (Delta U), and (TDelta S) practically collapse on the same curves (Fig. 7a). This confirms our findings from the analysis of kinetic curves, namely that, while (eta) affects the kinetics of fibrin clot contraction, it does not affect the thermodynamics, and, hence, the mechanisms of the fibrin clot contraction (Fig. 7a). The results of simulations with variable extension-retraction speed (v), platelet traction force (f), and filopodia length (l) showed that these platelet contractility characteristics affect to different extents the kinetics and thermodynamics of contraction (Fig. 7b–d; Table 2). The entropy changes ((TDelta S)) provide large 48.8-94.9% contributions to the free energy changes ((Delta E)), with the internal energy changes ((Delta U)) accounting for 6.1–51.2% of (Delta E) (Table 2).
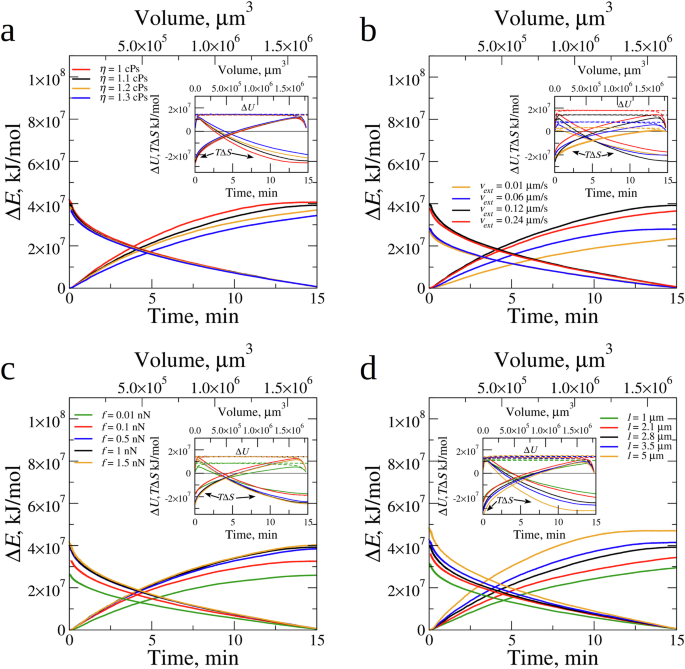
Changes in the free energy (Delta E) profiled as functions of contraction time (t) (the bottom (x)-axis) and clot volume (V) (the upper (x)-axis) for different values of (a): serum viscosity (eta), (b): filopodia extension-retraction speed (v), (c): filopodia traction force (f), and (d): filopodia length (l). The insets show the changes in the internal energy (Delta U) (dashed lines), and entropy (TDelta S) (solid lines) profiled as functions of (t) (the bottom (x)-axis) and (V) (the upper (x)-axis). In each (a–d), the time and volume profiles obtained for the experimental reference parameters (see Fig. 4a and Supplementary Table 1), is shown in black color.
Changes in (l) result in proportional changes in (Delta E), (TDelta S) and (Delta U), all increasing with (l) (Fig. 7d; Table 2). We found subtle nuances in the variation of (Delta E), (Delta U), and (TDelta S) with (v) and (f). Consider examples for (Delta E) and (TDelta S) (Fig. 7b, c). When (v) increases from 0.01 µm/s to 0.06 µm/s (six-fold) and to 0.12 µm/s (twelve-fold), the profiles of (Delta E) and (TDelta S) shift higher up (Fig. 7b) and the values of (Delta E) and (TDelta S) for complete clot contraction increase (Table 2). Yet, the subsequent (two-fold) increase in (v) from 0.12 µm/s to 0.24 µm/s results in time and volume profiles to shift down (rather than up; see Fig. 7b), and (Delta E) and (TDelta S) for complete clot contraction to decrease (Table 2), implying the non-monotonic dependence on (v). When (f) increases from 0.01 nN to 0.1 nN (ten-fold) and to 0.5 nN (fifty-fold), the profiles of (Delta E) and (TDelta S) shift higher and higher (Fig. 7c) and the values of (Delta E) and (TDelta S) for complete clot contraction increase (Table 2). Yet, when (f) increases further from 0.5 nN to 1.0 nN (two-fold) and to 1.5 nN (three-fold), the profiles of (Delta E) and (TDelta S) barely shift (Fig. 7c) and (Delta E) and (TDelta S) for complete clot contraction increase very little (Table 2). Hence, various aspects of platelets’ contractility affect the energetics of fibrin clot contraction in different ways.
Energetics of fibrin clot contraction explains the contraction mechanism
We inspected the time profiles of the mechanical energy (Delta U) (Supplementary Fig. 6), which show that (Delta U) level off during the 0.5–1 min of the fibrin clot shrinkage, implying that initially, the work performed on the fibrin network by the filopodia traction forces is spent on loading mechanically the fibrin clot; later on (>0.5–1 min), the work performed results in the purely entropic contraction of the fibrin network (i.e. clot shrinkage at (Delta U-) const). This results in fibrin fiber accumulation on the platelet surface and platelet-platelet association, which leads to fibrin network densification and clot size reduction. For the 120 µm × 120 µm × 120 µm fibrin clot with ({V}_{0}=) 1.7 × 106 µm3 initial volume formed at the 450,000/µm platelet count, the volume fraction of fibrin fibers and platelets are 3.3% and 0.6%, respectively. After the 15 min of fibrin clot contraction, the clot volume reduces to 1.9 × 105 µm3, and the concentration of fibrin fibers and platelets increase to 40.9% and to 31.2%, respectively. Yet, these changes are due, mainly, to the large entropy reduction ((TDelta S, <,) 0) and to only a small energy increase ((Delta U >) 0; Table 2). For example, (TDelta S) and (Delta U) account, respectively: for 61.2–69.1% and 30.9–38.8% of (Delta E) for the (eta =) 1.0–1.3 cP variation, for 60.9–71.6% and 28.4–39.1% of (Delta E) for the 0.01–1.5 nN variation in (f), and for 64.1–70.0% and 32.4–44.2% of (Delta E) for the (l=) 1–5 µm variation (Table 2). (TDelta S) and (Delta U) are the largest for very slow (v=) 0.01 µm/s ((TDelta S=) 93.9% and (Delta U=) 6.1%) and very fast (v=) 0.24 µm/s ((TDelta S=) 48.8% and (Delta U=) 51.2%; Table 2).
We used energy decomposition to identify the types of dynamic structure remodeling of the fibrin network. The mechanical energy function ({U}_{{fib}}) (Eq. (4)) contains the energies associated with fiber stretching (({U}_{{fib}}^{{str}})), fiber bending (({U}_{{fib}}^{{bend}})), and fiber-fiber interactions including formation of cohesive bonds and compaction of the fibrin network (({U}_{{fib}}^{{rep}})); ({U}_{p}) contains information about the energy of platelet associations. Hence, the energies that large values (colored in blue in Supplementary Table 3) correspond to are the types of structure alterations that facilitate variations in (eta), (v), (f), and (l). For example, a small increase in (eta) barely changes potential energy terms, which implies no changes in the mechanism of the fibrin network remodeling. By contrast, increasing (v) by 2 orders of magnitude leads to a five-fold increase in (Delta {U}_{{fib}}^{{str}}) and a ~ 10–fold increase in (Delta {U}_{p}), implying that the fibrin fiber stretching (rather than bending) and platelet associations (without formation of inter-fiber bonds) facilitate the fibrin clot contraction at faster (v). The 2-orders of magnitude variation in (f) results in the large (15–20-fold) increases both in (Delta {U}_{{fib}}^{{str}}) and ({Delta U}_{{fib}}^{{rep}}) and in the 20-fold increase in (Delta {U}_{p}), meaning that fibrin fiber stretching and platelet associations (with formation of fiber-fiber bonds) dominate the clot contraction at stronger (f). Increasing (l) by several-fold leads to the 3-fold increase in (Delta {U}_{{fib}}^{{str}}) and 4-fold increase in ({Delta U}_{{fib}}^{{rep}}), implying that fibrin fiber stretching and formation of inter-fiber bonds (without platelet associations) control the clot contraction for longer (l).
Discussion
Blood coagulation results in the formation of a blood clot that undergoes profound structural remodeling known as clot contraction or retraction. Blood clot contraction has been shown to occur not only in vitro, but also in vivo; therefore, it is a pathogenic mechanism with increasing evidence for its importance in hemostasis and thrombosis. Since blood clot contraction is driven by activated platelets, it is important to understand how different qualitative and quantitative characteristics of platelet function affect the kinetics, thermodynamics and structural mechanisms of blood clot contraction. Knowledge of the structural and biomechanical mechanisms of platelet-induced contraction of blood clots is important to understanding other cellular processes driven by non-muscle contractility and cytoskeletal dynamics.
We developed the structurally detailed, physically realistic and thermodynamically accurate mechanobiological SRDDM-based computational framework to model blood clot contraction in silico (Fig. 2a). The model provides a full 3D representation of platelet-driven clot contraction (Figs. 2b and 3a), and takes into account: 1) realistic geometry of the fibrin clot (clot size and shape); 2) length and diameter variations of fibrin fibers (Supplementary Fig. 1 and Fig. 2c); 3) densities of 3- and 4-degree nodes connecting fibrin fibers into the fibrin network (Supplementary Table 1); 4) bending and stretching deformations of individual fibrin fibers (Supplementary Table 1); 5) experimental spatial distribution of platelets embedded in the fibrin network (Fig. 2d); 6) platelet count and platelet size (Fig. 2d); 7) flexible filopodia protrusions emanating from the platelet’s surface (Fig. 3b); and 8) number, length, and diameter of filopodia (Supplementary Table 1). Furthermore, the model extends beyond the previous modeling attempts21,22,23,24 by incorporating: 9) kinetics of repeated cycles of filopodia extension in random directions and retraction towards the platelet body (Figs. 2a and 3b; Supplementary Table 1); and 10) kinetics of non-covalent filopodia-fibrin association and dissociation (Supplementary Table 1). In addition, the model describes a computationally reconstructed fibrin clot of a relatively large size that contains ~780 platelets with flexible filopodia arms and ~5 × 10⁴ fibrin fibers (Fig. 3a). This large size advantage makes the model: 11) accurate both kinetically and thermodynamically, and so in the simulations described below the dynamics of fibrin clot contraction does not depend on clot size (Supplementary Fig. 3). This is the first study that focuses on calculating the accurate thermodynamic properties of the clot contraction process. Moreover, the model simulates 12) fluctuations and densification of the fibrin network (Fig. 3b) and translocation of platelets from the clot periphery to the center (Fig. 3c, d).
We mapped the model into the ClotDynaMo framework for experiments in silico on the clot contraction process. The input for computer simulations with ClotDynaMo is provided by the structure file, kinetics file, force field file, and configuration file. The structure file carries information about the initial size, shape and the 3D arrangement of platelets in the fibrin network (Fig. 2b–d and Supplementary Table 1). The kinetics file contains information about filopodia length and diameter, filopodia extension-retraction speed, and the filopodia-fibrin reversible interactions (on- and off-rates; Supplementary Table 1). The force-field file carries information about the mechanical parameters for the fibrin clot, including the fibrin fiber stretching and bending moduli, filopodia traction force (Supplementary Table 1), and several other parameters (Supplementary Table 2). Finally, in a configuration file, a user specifies the number of iterations of the Langevin Dynamics algorithm, simulation time step, temperature of simulations, and serum viscosity (Supplementary Table 2). In the Langevin Dynamics (mechanics module of ClotDynaMo; Fig. 2a), forces are computed for each mechanical component of the model, leading to dynamic changes in their 3D coordinates. At the same time, the Reaction-Diffusion Master Equation assesses potential reactions, such as filopodia attachments to and detachments from a fibrin fiber, extension and retraction of individual filopodia, etc. (Fig. 2a). Subsequently, ClotDynaMo generates outputs for specific time points, which are saved in the coordinate file (specifying positions for all particles – fibrin fibers and platelets) and energy file (containing energy values for all potential energy terms and for all particles). In all experiments in silico, we simulated the process of fibrin clot contraction for 15 min (Fig. 4a), which is comparable with the real time frame of fibrin clot contraction (Fig. 1). It takes ~250 h of wall-clock time to generate a few ~15 min trajectories of the dynamics of fibrin clot of initial volume ({V}_{0}=) 1.7 × 106 µm3 on high-end graphics cards GeForce RTX 4090 (see SI).
We performed the ClotDynaMo simulations of contraction of a cubic fibrin clot with initial volume ({V}_{0}=) 1.7 × 106 µm3 and normal 450,000/μl platelet count, using the experimental reference values of model parameters (Supplementary Table 1). We have obtained a very good qualitative agreement between the experimental data and ClotDynaMo-based simulation data for: i) the fibrin compaction into fiber bundles accumulated near or on the surface of platelets; ii) the association of immobilized fibrin-attached platelets into secondary clusters; and iii) the platelet translocation to the center of the fibrin network (Fig. 3). We have obtained a very good quantitative agreement between the experimental and simulated time profiles for: iv) the extent of contraction of the bulk fibrin clot (Fig. 4a); v) the mean area of compacted fibrin (Supplementary Fig. 2a; Supplementary Movie 2); vi) the area occupied by platelet clumps (Supplementary Fig. 2b; Supplementary Movie 3); and vii) the average single platelet moving velocity (Supplementary Fig. 2c). We also demonstrated a very good agreement between the experiment and simulations vii) for the mechanics of fibrin clot contraction (see the inset to Fig. 4c). These points of qualitative and quantitative agreement achieved between the results of experiments in vitro and in silico on fibrin clot contraction validate the computational model we have developed.
We explored, for the first time, the influence of serum viscosity and several important quantitative characteristics of platelets’ contractility, such as filopodia extension-retraction speed, filopodia traction force, and filopodia length, on the kinetics, energetics, and structural mechanisms of the fibrin clot contraction. Thermodynamics is an important aspect of the clot contraction process that has received little attention in previously published studies. Therefore, we explored the time- and clot volume-dependent changes in the thermodynamic state functions, including the total work performed by contracting platelets, internal (mechanical) energy, and entropy associated with contraction of the fibrin network. The main results obtained for the normal platelet count (450,000/μl) are the following: 1) the kinetics of fibrin clot shrinkage shows the clot size dependence and is defined by serum viscosity and contractile activity of platelets; 2) the mechanics and energetics of fibrin clot shrinkage is driven to a larger extent by changes in the contraction entropy and to a smaller extent by changes in mechanical energy; and 3) the thermodynamics and structural mechanisms of fibrin clot contraction depend on contractile activity of platelets, but not on serum viscosity. In what follows, we discuss the biological relevance of these findings.
The kinetics of clot contraction is strongly dependent on the clot size below the ({V}_{0}approx) 1.5 × 10⁻³ mm3 clot volume and is independent for (V > {V}_{0}=) 1.5 × 10⁻³ mm3 (see Supplementary Fig. 3). Hence, the future modeling efforts must consider the fact that the size of the simulated clot directly affects the accuracy of the kinetics and thermodynamics calculations, and hence, influences the main conclusions and model predictions. For this reason and to enhance the predictive power of our model, the clot size simulated in this work was the largest compared to previously published models. Because the clot size is limited by the size of the blood vessel where it was formed, this finding also implies that the rate of clot contraction depends on the size and type of the blood vessel obstructed by the clot. Perhaps this is one reason that some of the most clinically serious thrombosis occurs in relatively large (although not the largest) arteries, such as heart attacks in the coronary arteries and stroke in the middle cerebral arteries.
The kinetic rate of clot contraction is dependent on serum viscosity (eta) (Fig. 5a and Table 1). This can be understood using poro-elastic arguments based on Darcy’s law and a linear relation between pressure and deformation (see SI). A low Darcy constant for in vitro plasma clots has long been associated with (pro)thrombotic patients. An increase in (eta) is expected to decrease the rate of clot contraction (Fig. 5a). The normal reference range for serum viscosity is 1.4–1.8 cP (1.0 being the viscosity of water)35. Clinical symptoms usually are not seen before the viscosity reaches 4 cP, and patients with hyperviscosity syndrome usually present with a plasma/serum viscosity greater than 5 cP. Certain pathological conditions can alter blood viscosity, e.g., dehydration can increase viscosity by increasing protein concentration in blood and causing a hyperviscosity syndrome. Hence, our results suggest that blood hyperviscosity can potentially impair contraction of clots and thrombi in vivo. In addition to variations in systemic whole blood and plasma viscosity, local viscosity of serum within and around a clot can be increased because activated platelets secrete more than 300 substances from their intracellular granules36.
The continuum model developed in this study provides quick-and-easy insights into the effects of various parameters of platelet contractility on the kinetics of fibrin clot contraction without having to perform expensive experiments or simulations. For example, the continuum model predictions for the rate of contraction (K) as a function of platelet count, filopodia length (l) and serum viscosity (eta) are in good agreement with experiments in vitro and in silico. The trends in the final extent of clot contraction (C) are also captured well by the continuum model, although a better agreement would require a better choice of the functional forms for (pleft(cright)) and (qleft(lright)), which is not so straight-forward. In this study, we assumed a simple exponential dependence of the contractile force (f) on the platelet count (c), but this dependence is more complex because platelet aggregates are expected to behave differently from individual platelets. In addition, the size distribution and spatial locations of the platelet aggregates are not known, etc. Nonetheless, the continuum model can be used to select parameter ranges for more detailed ClotDynaMo simulations. The continuum model is also useful since it can seamlessly account for the contractile effect of platelets in the studies of clot poro-(visco)-elasticity and fracture.
A surprising and important result obtained from the analysis of the thermodynamics of fibrin clot contraction is that, for the range of model parameters ((eta), (v), (f), and (l)) used in this study (Table 2) the entropic contribution ((TDelta S)) accounts for a large percentage (~49–94%) while the mechanical energy changes ((Delta U)) accounts for a small percentage (~6–51%) of the free energy changes ((Delta E)) associated with the fibrin clot contraction (Table 2 and Fig. 7). Scaling up to the experimental 100 mm3 fibrin clot with 450,000/µl platelet count at 37 °C, the total free energy change for fibrin clot contraction comes to 2.24 TJ/mol, of which ~67% (1.51 TJ/mol) is due to the clot entropy change and only ~33% (0.73 TJ/mol) is due the internal energy change. This means that clot contraction is an ‘entropic process’, i.e. it is mostly driven by changes in the entropy associated with dynamic remodeling and densification of the fibrin network with embedded and aggregating platelets, rather than changes in the energy. The fact that clot contraction is driven primarily by entropy changes suggests that the process is driven by structural remodeling and compaction of a blood clot. This makes clot contraction different from most biochemical and cellular processes and chemical reactions that are mostly enthalpy dependent.
Another interesting result is that the energetics of clot contraction depends on contractile activity of platelets but not on serum viscosity: The stress vs. volume diagrams (Fig. 4c) and energy vs. volume diagrams (Fig. 7) revealed that the free-energy changes ((Delta E)), entropy changes ((TDelta S)) and mechanical energy changes ((Delta U)) are quite sensitive to variations in (v), (f) and (l), which characterize the platelet contractility alterations (Fig. 7b–d; Table 2), but are insensitive to variation in serum viscosity (eta) (Fig. 7a; Table 2). Let us consider an example of the free-energy changes. Increasing the filopodia extension-retraction speed (v) from 0.01 µm/s to 0.12 µm/s (twelve-fold) results in the (Delta E) increase from 2.28 × 10⁷ kJ/mol to 3.87 × 10⁷ kJ/mol; yet, further increasing (v) from 0.12 µm/s to 0.24 µm/s results in a small (Delta E) decrease from 3.87 × 10⁷ kJ/mol to 3.63 × 10⁷ kJ/mol (Table 2; Fig. 7b). Hence, the dependence of (Delta E) on (v) is not trivial and is non-monotonic. Since larger (v) implies more frequent filopodia extensions-retractions (and larger number of extension-retraction cycles), we conclude that hyperactivation of platelets above a certain level does not necessarily result in greater fibrin clot contraction. Increasing the filopodia traction force (f) 100-fold from 0.01 nN to 1.0 nN results in the (Delta E) increase from 2.54 × 10⁷ kJ/mol to 3.87 × 10⁷ kJ/mol (~50% increase), but further increasing (f) 1.5-fold from 1.0 nN to 1.5 nN results in a small (Delta E)-increase from 3.87 × 10⁷ kJ/mol to 3.97 × 10⁷ kJ/mol (~3% increase; Table 2 and Fig. 7c). Hence, dependence of (Delta E) on (f) is non-linear and implies that stronger platelet traction enhances clot contraction, but only to a small extent. Under physiological conditions, the restricted mechanical efficacy of activated platelets can be associated with the limited expression of adhesive integrins and other molecules involved in mechano-transduction, suggesting that the platelet-driven clot shrinkage has internal limitations.
ClotDynaMo enables one to use energy decomposition analysis to probe how platelet contractility variations trigger different structural transformations that accompany clot contraction and how the platelet contractility-dependent changes alter the mechanisms of dynamic biomechanical structure remodeling (see Supplementary Table 3). These mechanisms’ differences might lead to formation of blood clots and thrombi with quite diverse structure and composition, as found for ex vivo human thrombi37. We compared the final fibrin clot structures from 15-min long ClotDynaMo based simulations of the fibrin clot contraction obtained for the experimental reference parameters (Fig. 8, Supplementary Table 1 and Fig. 4a), but with slower extension-retraction speed (v=) 0.01 µm/s, with stronger contraction force (f=) 1.5 nN, and with longer filopodia extension (l=) 5 µm (as compared with the experimental reference case; see Supplementary Table 1). Even a visual inspection shows the following structural differences or absence thereof (Fig. 8a): decrease in (v) (from 0.12 µm/s to 0.01 µm/s) results in the shrunken fibrin network formed by less bent and less stretched fibrin fibers forming a much smaller number of cohesive inter-fiber bonds (Fig. 8b); increasing (f) (from 1 nN to 1.5 nN) does not result in substantial differences in the final clot structure (Fig. 8c); and increasing (l) (from 2.8 µm to 5 µm) results in formation of the fibrin network with a large number of inter-fiber bonds mediating fibrin compaction into fiber bundles on the surface of platelets and with association of a large amount of single platelets into groups of several (two, three, four, and more) platelets (Fig. 8d).
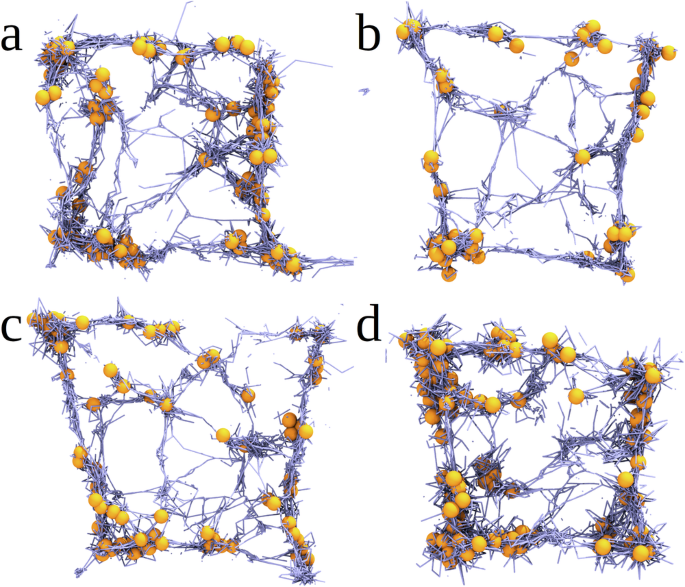
Shown are the snapshots of the central 10 µm square cross-section of the fibrin clot after (t=) 15 min of clot contraction obtained from the ClotDynaMo simulations (a): for experimental reference parameters (see Supplementary Table 1 and Fig. 4a), and for the following cases: (b): slow filopodia extension-retraction speed (v=) 0.01 µm/s showing the fibrin network formed by less bent and less stretched fibrin fibers forming a much smaller number of cohesive inter-fiber bonds; (c): stronger filopodia traction force (f=) 1.5 nN displaying no substantial differences in the final clot structure; and (d): longer filopodia length (l=) 5 µm showing the fibrin network with a large number of inter-fiber bonds and with great extent of platelet association.
One can ask how efficient is clot contraction? We calculated the amounts of total volume change (Delta V={V}_{0}-{V}_{f}), where ({V}_{f}) is the (final) fibrin clot volume, and the fibrin clot contraction efficiency (upsilon =(frac{Delta V}{{Delta V}_{max }})times 100 %) in per cent of the maximum possible clot volume reduction ({Delta V}_{max }={V}_{0}-{V}_{{exc}}), where ({V}_{{exc}}) is total excluded volume (sum of volumes of all the platelets and all the fibrin fibers). Table 1 shows that while the (upsilon)-value corresponding to experimental reference parameters (Fig. 4a) attains a high 93.8% extent of contraction, increasing the filopodia length (l) (from 2.8 µm to 5 µm), decreasing the filopodia traction force (f) (from 1 nN to 0.5 nN), and increasing the filopodia extension-retraction speed (v) (from 0.12 µm/s to 0.24 µm/s) results in a higher (upsilon =) 94.7-95.7%, (upsilon =) 94.7%, and (upsilon =) 96.4%, respectively (Table 1). Based solely on the contraction efficiency differences, we might conclude that contraction of the fibrin clot formed at a normal 450,000/µl platelet count is not the most efficient. This observation motivated us to next examine the energetics of clot contraction efficiency by calculating the energy density for fibrin clot contraction, ({rho }_{E}=frac{Delta E}{Delta V}), where (Delta E) is the total free energy change for contraction (Table 2). Smaller values of (Delta E) and larger values of (Delta V) mean lower values of ({rho }_{E}), implying higher energy efficiency. While the ({rho }_{E})-value corresponding to the kinetic curve obtained with experimental reference parameters (Fig. 4a and Supplementary Table 1) attains a low 11.5 kJ/µm−3·mol−1 energy density, increasing (eta) or decreasing (v) or (f), or (l) all result in lower ({rho }_{E}) (Table 2). Again, based solely on the energy cost argument, we might conclude that contraction of the fibrin clot obtained at a normal platelet count (450,000/µl) is not the most efficient. However, by comparing pairs of values (({rho }_{E}), (upsilon)) in Tables 1 and 2 we see that most pairs have high contraction efficiency but low energy efficiency (large (upsilon) and ({rho }_{E})) or high energy efficiency but low contraction efficiency (small (upsilon) and ({rho }_{E})), and a few pairs have high contraction efficiency and energy efficiency (large (upsilon) but small ({rho }_{E})).
This can be better understood by inspecting the scatter plot of (upsilon) vs. ({rho }_{E}) data presented in Fig. 9. The top left blue rectangle is the region of high contraction efficiency and high energy efficiency, which contains the pair of (upsilon) and ({rho }_{E}) values obtained for the kinetic curve (Fig. 4a) with experimental reference parameters (denoted by the star in Fig. 9). This analysis demonstrates the “optimal contraction principle”: the fibrin clot is a complex system that contracts by maximizing the clot volume change (biological function) while also minimizing the free energy of contraction (energy requirement). That the simulated kinetic curve obtained with experimental reference parameters exhibits adherence to this principle – maximizing biological function while minimizing energy expenditure – is not surprising, since it represents the current evolutionary endpoint of this ancient and important biological process. It is worth noting that most of the model points and the experimental reference parameters point (star) appear to be well correlated to a linear fit line (Fig. 9). The importance of this observation is the following. Since the ClotDynaMo model is parameterized with experimentally derived parameters and fits the experimental clot contraction data well, these model derived points ought to represent a potential range of human clinical clot behaviors. Therefore, the model predicts that future clinical studies of normal patients’ clot contraction behavior should be distributed along the Fig. 9 linear fit line. Interestingly, studies of human patients exhibiting abnormal clot contraction behavior may possess experimental parameters outside the normal physiological range; such samples may be expected to deviate from this linear fit line region.
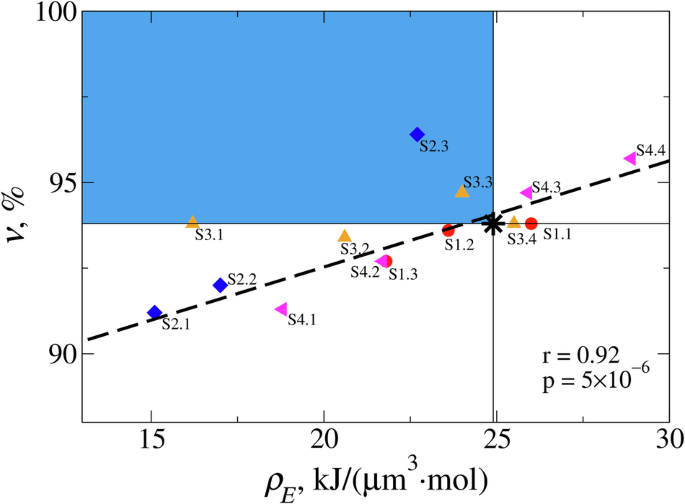
Shown is the scatter plot of the volume contraction efficiency (upsilon =(frac{Delta V}{{Delta V}_{max }})times 100 %). vs. energy density ({rho }_{E}=frac{Delta E}{Delta V}) for different values of solution viscosity (eta) (data points S1.1-S1.3; red circles), filopodia extension-retraction speed (v) (data points S2.1-S2.3; blue diamonds), filopodia traction forces (f) (data points S3.1-S3.4; orange triangles), and filopodia lengths (l) (data points S4.1-S4.4; pink triangles). The pair of values of (upsilon) and ({rho }_{E}) obtained for the experimental reference parameters (Fig. 4a and Supplementary Table 1) is shown as a black star. The identity of data points is explained in the last column in Tables 1 and 2. Thin horizontal and vertical lines divide the graph into the four quadrangles describing the fibrin clots with low efficiencies (upsilon) and ({rho }_{E}) (bottom right), high (upsilon) but low ({rho }_{E}) efficiencies (top right), low (upsilon) but high ({rho }_{E}) efficiencies (bottom left), and high (upsilon) and ({rho }_{E}) efficiencies (top left; colored in blue). Black dashed line shows the result of linear regression (also shown are the Pearson correlation coefficient (r) and the (p)-value).
In future modeling applications, ClotDynaMo can be used to simulate clots of different sizes, shapes and geometries (spheres, cylinders, and more complex forms). It could be particularly important to simulate clots with the realistic geometries of human in vivo clots in specific blood vessels, since it is impossible to do experiments with humans and the results might help to predict clinical outcomes in those blood vessels in thrombotic or bleeding patients. For example, it is known that some of the most clinically severe thrombosis occurs in certain locations in relatively large arteries, such as heart attacks in the coronary arteries and stroke in the middle cerebral artery. The clot’s structure can be altered by adjusting the distributions of lengths and diameters of fibrin fibers, and the density of 3- and 4-degree nodes. There is a well-known fibrin clot phenotype for thrombotic patients, including stiff clots made up of a dense network of thin, short, highly branched fibers38,39,40,41,42, which could be simulated. On the other hand, clots in individuals with severe bleeding, as in hemophilia or polytrauma, are weak with structures related to the cause of the bleeding43,44. ClotDynaMo can also be extended to incorporate a variable number of platelets and to include red blood cells and leukocytes. This is relevant to patients with thrombocytopenia (low platelet count) or thrombocytosis (high platelet count) and patients with high or low hematocrit and infected patients with high leukocyte count. ClotDynaMo can be extended to use specific distributions of model parameters as a measure of the degree of platelet activation, which varies in healthy individuals as well as in patients. There is substantial evidence that platelets in thrombotic patients are partially constitutively active, become exhausted (low mitochondrial membrane potential and low ATP) and refractory, which has striking effects on clot contraction7,45. In ClotDynaMo, the rates of filopodia extension and retraction can be made different and variable for different platelets. The mechanical properties of the fibrin network can be modulated by altering the Young’s moduli for fibrin fiber stretching and bending. Such situations are relevant for thrombotic patients, who tend to have considerably stiffer clots. Another option is to account for the ‘catch’ and ‘slip’ bonds characterized at the single-molecule level by us and others46,47,48,49,50,51 by including the force-dependence into the off-rates for the filopodia-fiber non-covalent linkages. ClotDynaMo provides a novel powerful tool to test mechanical and biochemical mechanisms for modulation of the rate, extent, and energetics of clot contraction that have important pathophysiological and clinical implications.
Methods
Collection and fractionation of human blood
Blood from healthy humans was drawn by venipuncture. The study was approved by the University of Pennsylvania Institutional Review Board. The subjects were excluded from the study if anticoagulants or antiplatelet medications were taken within 2 weeks before drawing of blood. Blood was stabilized with 3.2% trisodium citrate 9:1 by volume. The citrated blood was used immediately to obtain platelet-rich plasma (PRP) by centrifugation at 200 g for 10 min at room temperature. One portion of PRP was additionally centrifuged at 1000 g for 15 min to settle and concentrate platelets. The second portion of PRP was centrifuged at 10,000 g for 15 min to remove platelets and obtain platelet-free plasma (PFP). The platelet pellets were re-suspended in PFP to reach various final platelet counts, namely about 1,000,000, 450,000 and 100,000 platelets per 1 µl. The platelet count was measured using an automated cell counter system ABX Micros 60 (Horiba, Japan).
Experimental determination of the kinetics and final extent of clot contraction
The kinetics of clot contraction were determined by detecting optically the reducing clot size over time using the Thrombodynamics Analyzer (DiaPharma, USA) basically as described earlier8. Prior to use, 12 mm × 7 mm × 1 mm transparent plastic cuvettes were lubricated with 1% pluronic F–127 in 150 mM NaCl to prevent sticking of the clot to the walls and allow for the unconstrained clot contraction. To initiate plasma clotting and activate platelets, in a separate plastic tube 2 μl of CaCl2 (200 mM) and 5 μl or 7.5 μl of freshly thawed human thrombin (40 U/ml) were added to 200 μl of platelet-containing plasma to reach a final concentration of 2 mM CaCl2 and 1 or 1.5 U/ml thrombin, respectively. 80 μl of the activated plasma sample was quickly transferred into a measuring cuvette pre-heated at 37 °C. Imaging of the clot during contraction was performed automatically every 15 s. Digital images of the clot were used to determine the clot size at each time point and plot the kinetic curves of contraction/shrinkage until 20 minutes after the addition of thrombin to the sample, when a plateau was reached.
Scanning electron microscopy of uncontracted and contracted clots
For scanning electron microscopy, PRP clots were formed in plastic cylinders 6 mm in diameter. For unconstrained clot contraction, the walls were pre-lubricated with 1% pluronic F–127 in 150 mM NaCl to prevent sticking of fibrin to the walls, while an uncontracted clot was formed in a cylinder with a rough inner surface to ensure clot attachment that prevents contraction. Both the uncontracted and contracted clots were formed by adding 2 μl of CaCl2 (200 mM) and 7.5 μl of freshly thawed human thrombin (40 U/ml) to 200 μl of PRP, which was quickly transferred into the corresponding cylinders, and the clots were allowed to form for 30 min. The resulting clots were washed thoroughly in 50 mM sodium cacodylate buffer containing 100 mM NaCl (pH 7.4) at room temperature, and then fixed in 2% glutaraldehyde in the same buffer, dehydrated in ascending ethanol concentrations, immersed into hexamethyldisilazane, air-dried, and sputter coated with gold-palladium. The samples were examined in an FEI Quanta 250FEG scanning electron microscope (FEI, Hillsboro, OR, USA).
Creating virtual 3D fibrin clot structure
The initial fibrin clot structure used in ClotDynaMo had a cubic shape (Fig. 2b) 120 µm × 120 µm × 120 µm, with the initial volume ({V}_{0}=) 1.7 × 106 µm3 (other shapes, such as spheres and cylinders, are viable options). We use the experimental distributions (densities) of the 3- and 4-degree nodes ({rho }_{3}) and ({rho }_{4}) (Supplementary Table 1) within the boundaries of a chosen geometry. Each 3-degree (or 4-degree) node connects three (or four) fibrin fibers. The total number of the 3- and 4-degree nodes is given by the formula, (N={V}_{0}{rho }_{3}+{V}_{0}{rho }_{4}), and the total number of fibrin fibers is calculated as (M=frac{3{V}_{0}{rho }_{3}+4{V}_{0}{rho }_{4}}{2}). Next, using the experimental distribution of fibrin fiber lengths (Supplementary Fig. 1), a total of (M) length values are sampled. For each pair of nodes (i) and (j), the node-to-node distances ({r}_{{ij}}) are calculated and compared with (M) values of length generated. Connecting the nodes to form fibrin fibers satisfies two conditions: i) each 3- or 4-degree node has 3 or 4 fibrin fibers, respectively; ii) each fibrin fiber’s length approximates one of (M) length values generated. Given the initial random node filling the 3D cubic space, the resulting histogram of fiber lengths closely (but not exactly) resembles the experimental histogram of fibrin fiber lengths (Supplementary Fig. 1a). To make the simulated distribution of the fibrin fiber lengths to be equal to the experimental distribution, a minimization simulation is carried out, in which each fibrin fiber is represented by a harmonic spring capable of expansion and contraction. Each fiber’s length gradually relaxes to the equilibrium length, set to be equal to the corresponding value from the distribution of (M) values of fiber length generated. As a result, the simulated distribution of the fibrin fiber lengths closely matches the experimental histogram (Supplementary Fig. 1a). Using a similar approach, we adjust the values of fibrin fiber diameters to make the simulated distribution match the experimental histogram of fiber diameters (Supplementary Fig. 1b). To complete the initial structure of fibrin fiber network with platelets, the platelets are randomly positioned in proximity to one of the network nodes. The number of platelets in a clot volume is calculated based on the target concentrations (100,000/μl, 450,000/μl or 1,000,000/μl).
Force field for fibrin clot contraction
Fibrin fibers are described by the stretching potential (({U}_{{fib}}^{{str}})) with the (i)-th cylinder length ({r}_{{fib},i}), the bending potential (({U}_{{fib}}^{{bend}})) with the bending angle between the (i)-th and (i+1)-th cylinders, ({theta }_{{fib},{ij}}), and the excluded volume interaction potential (({U}_{{fib}}^{{rep}})) between (i)-th and (j)-th fiber cylinders, i.e.
where ({K}_{r}=) 1.15 × 10⁴ nN/µm and ({K}_{theta }=) 8.7 × 10⁹ kJ/mol·rad2 are the stretching and bending rigidities for fibrin fibers, ({r}_{{fib},0}=) 0.5–12.0 µm is the equilibrium cylinder length (see Supplementary Fig. 1a), and ({theta }_{{fib},0}=) 180° is the equilibrium bending angle. In ({U}_{{fib}}^{{rep}}), (varepsilon =) 2.1 × 10⁵ kJ/mol is the energy and ({sigma }_{c}={R}_{i}+{R}_{j}=) 0.1–2.0 µm is the length for the excluded volume interaction (({R}_{i}) and ({R}_{j}) are the radii of (i)-th and (j)-th cylinders; see Supplementary Fig. 1b), and (uin)[0,1] and (sin)[0,1] are the position factors. Platelets’ filopodia: A filopodium is described by the stretching potential (({U}_{p-f}^{{str}})) which depends on the distance between the (i)-th platelet center and the beginning of a (k)-th filopodia ({r}_{p,i-f,k}), stretching potential (({U}_{f}^{{str}})) for the (k)-th filopodia with the bead-to-bead distance ({r}_{f,k}), and the association potential (({U}_{p}^{{ass}})) for the interaction between the (i)-th and (j)-th platelets, i.e.
where ({K}_{p,r}=) 1.45 × 10³ nN/µm is the stretching stiffness, (R=) 1.5 µm is the platelet radius (Supplementary Table 1), and ({r}_{f,0}=) 2.8 µm is the filopodia length. The (i)–th and (j)–th platelets associate if the distance between their centers ({r}_{p,{ij}}, <, {r}_{{ass}}=) 1.43 µm. Filopodium-fiber bond: We describe the interactions between filopodia and fibrin fibers using the potentials, which depend on the distances between the (j)-th filopodium growing end and the (i)-th fibrin fiber cylinder end and (i+1)-th fiber cylinder end, with the distances ({r}_{{fib}-f,{ij}}), ({r}_{{fib}-f,i+1,j}), respectively, and the angles between the filopodium and fibrin fiber cylinder axes ({theta }_{{ij}}), ({theta }_{i+1,j}),
where ({K}_{{att},r}=) 16.7 nN/µm is the stretching stiffness, ({L}_{{fib},i}) is the fiber length, and (alpha in) [0,1]26,27.
Langevin Dynamics for mechanical components of fibrin clot contraction model
The dynamic evolution of the mechanical degrees of freedom (platelet filopodia, fibrin fibers, and filopodia-fiber linkages) is followed by numerically integrating the Langevin equations of motion (in the overdamped limit) for the position ({{boldsymbol{r}}}_{i}) of each mechanical component,
where (gamma =6pi eta a) is the friction coefficient ((eta) is solvent viscosity and (a) is particle size), and ({{boldsymbol{g}}}_{{boldsymbol{i}}}left(tright)) is the Gaussian distributed, zero-average random force with the variance ({sigma }^{2}=2{k}_{B}Tgamma) (({k}_{B}) is the Boltzmann’s constant). In Eq. (7), (Uleft({boldsymbol{r}}right)) is the total mechanical energy function
which defines the deterministic force ({F}_{i}=frac{partial Uleft({boldsymbol{r}}right)}{partial {{boldsymbol{r}}}_{{boldsymbol{i}}}}). The Langevin equations are propagated forward in time with the time step ({dt}=) 1 µs at room temperature 37 °C ((T=) 310 K) using the (eta =) 1.1-cP serum viscosity (Supplementary Table 2).
Describing kinetics in fibrin clot contraction model
The fibrin network state ({boldsymbol{X}}={{{x}_{j}}}_{{boldsymbol{j}}={boldsymbol{1}}}^{{boldsymbol{J}}}) is specified by the number of fibers, platelets and platelet-fiber linkages (e.g. filopodia-fibrin attachments) ({x}_{j}) of each type (j=) 1, 2, …, (J). The time evolution of the probability for the network to be in state ({boldsymbol{X}}) is given by (frac{{dP}left({boldsymbol{X}},tright)}{{dt}}=mathop{sum }limits_{mu }^{M}[{alpha }_{mu }({boldsymbol{X}}-{{boldsymbol{S}}}_{{boldsymbol{mu }}})P({boldsymbol{X}}-{{boldsymbol{S}}}_{{boldsymbol{mu }}},t)-{alpha }_{mu }({boldsymbol{X}})P({boldsymbol{X}},t)]), where ({alpha }_{mu }({boldsymbol{X}})) is the reaction propensity for the (mu)-th reaction ((mu =) 1, 2,…, (M)) to occur in the system, and ({{boldsymbol{S}}}_{{boldsymbol{mu }}}) is the (mu)-th column of (Jtimes M) stoichiometry matrix ({boldsymbol{S}}) to describe the changes in the number of molecules when the (mu)-th reaction occurs. The equation above is numerically sampled using the Gillespie approach, which is based on the propensities of chemical reactions52,53. In short, the probability that the (mu)-th reaction will occur within the next time interval between (t+tau) and (t+tau +{dt}) is given by ({P}_{0}(t+tau ){c}_{mu }{h}_{mu }{dt}), where ({P}_{0}(t+tau )) is the probability that at time (t+tau) no reaction has occurred in the previous time interval. The reaction propensity for the (mu)-th reaction is ({alpha }_{mu }={c}_{mu }{h}_{mu }), and the total propensity for all (M) reactions is ({alpha }_{0}=mathop{sum }nolimits_{mu =1}^{M}{alpha }_{mu })52,53. Examples of reaction propensity calculation for the filopodium-fibrin association and dissociation reactions are given in SI.
Propensity calculation for the filopodium-fibrin association and dissociation reactions
For a unimolecular reaction (mu) (e.g., filopodium-fibrin dissociation) to occur with the rate constant ({k=k}_{{off}}), the rate equation for a chemical species of type (A) (e.g. filopodia-fibrin attachment) is (frac{d{x}_{A}}{{dt}}=-k{x}_{A}). We define ({c}_{mu }{dt}={cdt}) to be the probability that a particular combination of reactants will interact through the same reaction (mu) in the time interval ({dt}). If ({h}_{mu }) is the total number of distinct molecular reactant combinations at time (t), then for a single molecule of type (A), (c=k) and ({h}_{mu }={x}_{A}), and the reaction propensity is ({alpha }_{mu }=c{h}_{mu }=k{x}_{A}). For a filopodium-fibrin fiber association, the rate equation for species ({fib}) (fibrin fiber) and (f) (filopodia) is (frac{d{x}_{{fib}}}{{dt}}=frac{d{x}_{f}}{{dt}}=-k{x}_{{fib}}{x}_{f}), where ({k=k}_{{on}}). If ({h}_{mu }) is the number of distinct molecular reactant combinations for a bimolecular reaction at time (t), then for a single combination of ({fib}) and (f), (c=k/{V}_{0}) and ({h}_{mu }={x}_{{fib}}{x}_{f}), and the reaction propensity is ({alpha }_{mu }=c{h}_{mu }=k{x}_{{fib}}{x}_{f}/{V}_{0}). The numerical values for ({k}_{{on}}) and ({k}_{{off}}) are given in Supplementary Table 1.
Calculation of thermodynamic state functions for fibrin clot contraction
We used the (sigma) vs. (t) data and the (sigma) vs. (V) diagram (the inset to Fig. 4c), to profile the volume-dependent changes in the free energy (Delta E), the internal energy (Delta U), and the entropy (TDelta S) for the platelet-driven contraction of the fibrin clot. The work performed on the clot (w) is equal to the free energy change (Delta E), i.e. (w=Delta E=Delta U-TDelta S). We performed numerical integration (from the initial clot volume ({V}_{0}) to the final clot volume (V)) to calculate the area under the (sigma)–(V) curve, in order to obtain the work for fibrin clot contraction, (wleft(Vright)=-{int }_{{V}_{0}}^{V}sigma left({V}^{{prime} }right)d{V}^{{prime} }), which was then used to generate the profiles of (Delta E) vs. (t) and (Delta E) vs. (V). Using the numerical output, i.e. (Delta U) vs. (t) and (Delta U) vs. (V) data, we generated the profiles (TDelta S) vs. (t) and (TDelta S) vs. (V.)
Numerical implementation
The SRDDM25 was mapped into the ClotDynaMo software (written in CUDA), in order to utilize a massive parallelism available on Graphics Processing Units (GPUs). In the Langevin Dynamics, numerical calculation of the non-covalent particle-particle interactions, i.e. the excluded volume interactions, fiber-fiber interactions resulting in formation of cohesive bonds, platelet-platelet interactions and the fibrin fiber-platelet interactions, is the computational bottleneck. Yet, these interactions are described by the same mechanical energy functions (harmonic potentials or Lennard-Jones potentials described by Eqs. (4)-(6)). It is then possible to execute the same mathematical operation, e.g., energy calculations, evaluation of forces, generation of random numbers for calculation of random forces, integration of the equations of motion, for many particles at the same time. Numerical routines for the generation of (pseudo)random numbers (Hybrid Taos) are described elsewhere54,55. We implemented the particle-based parallelization55 for fibrin fiber cylinders and platelet spheres. To speed up the simulations, we used the neighbor lists with the 20 µm cutoff. These efforts have enabled us to span 15–20 min of the clot contraction time in reasonable computational time (few weeks or less).
Continuum model
Following our studies29, we construct a simple continuum model for isotropic contraction of a fibrin clot using the 8-chain model of polymer elasticity (see SI for more detail)56. In the continuum model, a spherical fibrin clot with traction-free boundaries contracts freely without constraints. At equilibrium, the clot is stress free. Hence, the Cauchy stress components are ({sigma }_{11}={sigma }_{22}={sigma }_{33}=) 0 and the principal stretches are ({lambda }_{1}={lambda }_{2}={lambda }_{3}={lambda }_{* }). By enforcing the condition that ({sigma }_{11}={sigma }_{22}={sigma }_{33}=) 0, we obtain the following equation (see SI): ({g}^{{prime} }left({lambda }_{* }^{3}right)=-frac{1}{{lambda }_{* }}frac{nu L}{3{lambda }_{* }}left{{EA}left(1-frac{1}{{lambda }_{* }}right)+{F}_{p}left(tright)right}=Kleft({lambda }_{* }^{3}-1right)) which can be re-written as
In Eq. (9), (nu) is the number of fibers per reference volume, (L) is the average length of fibers between cross-links (branch points in a fibrin gel), (E) is the Young’s modulus, (A) is the cross-sectional area of a fiber and (K) is a bulk modulus of the fiber network. In Eq. (9), ({F}_{p}(t)) is the active force exerted on a fiber by platelet filopodia, and Eq. (9) can be solved for ({lambda }_{* }) if ({F}_{p}(t)) is known. ({F}_{p}(t)) is assumed to depend on platelet concentration per reference volume (c) and filopodia length (l), and is allowed to change with time:
In Eq. (10), ({F}_{0}) is the force generated by a platelet, (p(c)) and (q(l)) are dimensionless functions of platelets count (c) and filopodia length (l), respectively, and (tau) is a characteristic time over which the fibrin clot contraction occurs. In the model, (tau) depends only on the viscosity of the environment (eta). The functional forms of (p(c)) and (q(l)) are not known, but they can be obtained by fitting the data from the ClotDynaMo simulations with platelet count (c=) 450,000/µl. Following Brown et al. 29, we set ({EA}=) 3.87 × 10⁻⁷ N, ({F}_{0}=) 10−9 N, (K=) 1 MPa, and (nu L=) 1013 m−2. The extent of contraction (frac{left({V}_{0}-Vleft(tright)right)}{{V}_{0}}) is then calculated using the formula: (frac{left({V}_{0}-Vleft(tright)right)}{{V}_{0}}=1-{lambda }_{* }^{3}).
Derivation of the continuum model
Our model is based on the 8-chain model for polymer elasticity that was adapted to fibrin gels in Brown et al. 29. This model was successfully applied to model the tensile behavior of fibrin gels, including the reduction in volume under uniaxial tensile loads. An attractive feature of the 8-chain model is that it connects the force-stretch relation of individual polymer chains or fibers to the overall stress-strain behavior of an isotropic network of these fibers. In Brown et al. 29 the tensile behavior of single fibrin fibers was computed first and it then entered the 8-chain model to give excellent agreement with the tensile behavior of centimeter scale gel specimens. In Ramanujam et al.57 a variant of the 8-chain model was used to describe cracked fibrin gel. The key to correctly capturing the simple shear behavior of fibrin gels in this paper was accounting for the buckling of fibers under compression. To account for buckling of fibers in a simple way the authors assumed that the force-stretch response in compression was soft for small strains, but it progressively stiffens as the stretch of the fiber becomes smaller and approaches zero. Since the platelet induced contraction of clots involves isotropic compression along all directions on the unit sphere, we will also assume a similar force-stretch response of fibrin fibers under compression.
To model the contractile effect of platelets, we assume that an active agent sits at the body center of the 8-chain cube. This active agent exerts forces on all eight fibers emerging from the center of the cube. If the side of the cube is held fixed, then then the tension in each fiber caused by the active agent is ({F}_{p}(t)) under isotropic contraction. This force is independent of the state of deformation of the cube. This is a key modification to the 8-chain model that will enable us to account for the contraction of clots due to platelet activity. We will be concerned with isotropic contraction of clots in this document although the following analysis is applicable also to other geometries. We will follow the development in Brown et al.29. In the principal coordinate system, the deformation gradient tensor and the right Cauchy-Green tensor are, respectively,
and
where ({lambda }_{1}), ({lambda }_{2}), ({lambda }_{3}) are the principal stretches. We assume that the 8-chain cube is aligned with the principal directions. In this case the stretch ({lambda }_{c}) of each fiber in the 8-chain cube is given by:
where ({I}_{1}) is the trace (or first invariant) of the Cauchy-Green tensor, ({I}_{1}={rm{Tr}}(C)). ({J}^{2}=det (C)) is the determinant (or third invariant) of the Cauchy-Green tensor. The strain energy per unit reference volume of the continuum represented by the 8-chain cube (with no platelets) is given by
In the above (nu) is the number of fibers per reference volume, (L) is the average length of fibers between cross-links (branch points in a fibrin gel), (G({lambda }_{c})) is the Helmholtz free energy per reference length of a fiber as a function of stretch ({lambda }_{c}) and (g(J)) is the dilatational part of the strain energy density of the continuum. The force in a fiber is given by
where (Fleft({lambda }_{c}right)=frac{dleft(Gleft({lambda }_{c}right)right)}{d{lambda }_{c}}) is the force due to elastic stretching (or contracting) of a fiber and ({F}_{p}(t)) is the (active) force exerted on a fiber by platelets. The principal components of the second Piola stress are given by:
The Cauchy stress is given by (sigma =frac{1}{det (F)}{FS}{F}^{T}), so
Having obtained the stresses in the continuum in terms of the force in a fiber, we now consider isotropic contraction of clots. We must assume specific forms for (F({lambda }_{c})), ({g}^{{prime} }left({lambda }_{1}{lambda }_{2}{lambda }_{3}right)) and ({F}_{p}left(tright)) to write equations for the contraction of a clot. We take
where (E) is the Young’s modulus and (A) is the cross-sectional area of a fiber. For ({lambda }_{c}=1+{epsilon }_{c}), where (left|{epsilon }_{c}right|ll) 1 the elastic force-stretch relation of the fiber is (F={EA}{epsilon }_{c}), irrespective of the sign of ({epsilon }_{c}) (i.e. linear force-strain relation for small strains irrespective of tensile or compressive strains). For ({lambda }_{c},)→ 0 the above force-stretch response is stiffening. Initial soft response for small compressive strain and a stiffening response for large compressive strain is characteristic of buckled fibers that come into self-contact in a contracted clot. Next, we assume ({g}^{{prime} }left({lambda }_{1}{lambda }_{2}{lambda }_{3}right)=K({lambda }_{1}{lambda }_{2}{lambda }_{3}-1)) with (K=) 1 MPa being a bulk modulus. With these assumptions in place setting ({sigma }_{11}={sigma }_{22}={sigma }_{33}=) 0 leads to Eq. (9).
Darcy law interpretation of initial contraction velocity
Imagine a thin rectangular fibrin clot as used in experiments depicted in Fig. 1a. In the undeformed state (before clot contraction occurs), the volume-fraction of a solid component (fibrin fibers plus platelets) is ({phi }_{s}.) The volume of solid in the contracting clots remains fixed even as the volume of liquid contained in it changes with time (t). In our idealized situation, we assume that the width of the clot remains fixed and that the bottom edge does not move while the top edge moves downwards as platelets exert contractile forces on the fibrin fiber network. The origin of the (z)-axis is placed on the bottom edge of the clot. The height (hleft(tright)) of the clot changes as a function of time and the initial height is (hleft(0right)=H.) The liquid flux (Q) in the (z)-direction is given by a Darcy law
where (eta) is liquid (serum) viscosity, (k) is a Darcy constant and ({dp}/{dz}) is a hydrostatic pressure ((p)) gradient in the (z-) direction. The pressure in the clot is due to forces exerted by activated platelets. We assume that hydrostatic pressure (p) is uniform in most of the clot, except in a region of thickness ({rm{delta }}) near the top edge where most of the pressure drop occurs, so that (Q=-{kp}/eta delta .) The pressure in the clot itself is assumed to be linearly proportional to the strain through a bulk modulus (B):
Such a relation will be valid when the deformations are small, i.e. in the early stages of clot contraction. Therefore, the liquid flux from the top surface is (Q=-frac{{kB}}{eta delta }left(1-frac{h}{H}right).) Now, the flux of liquid through the top edge is just the volume of the liquid going out through the top surface per unit time divided by the area of the top surface, so flux has the units of velocity. In fact, this is the velocity (v) of the fibers relative to the fluid at the top surface of the clot. We notice that (v) is directly proportional to the modulus (B) and inversely proportional to the viscosity (eta)58.
Responses