Exploring trends and emerging topics in oceanography (1992–2021) using deep learning-based topic modeling and cluster analysis
 using deep learning-based topic modeling and cluster analysis")
Introduction
In the past decades, the field of oceanography has undergone a remarkable transformation, driven by rigorous scientific exploration and extensive data collection efforts. International collaboration has played a pivotal role in shaping the landscape of oceanographic research, leading to groundbreaking initiatives such as the GO-SHIP (Global Ocean Ship-based Hydrographic Investigations Program)1, GEOTRACES2, GEOSECS (Geochemical Ocean Sections Study)3, the Argo buoy program4, and GOOS (Global Ocean Observing System)5. These collaborative efforts have significantly expanded our understanding of oceanography.
The development of oceanography illustrates the integration of technological advancements with profound scientific exploration across its various sub-disciplines. Biological oceanography has evolved from early marine organism classification to an interdisciplinary field that encompasses the study of marine ecosystems6,7, biodiversity8, ecology, and evolutionary biology9. Chemical oceanography has transitioned from basic chemical analysis to global environmental issues, such as ocean acidification10,11, nutrient cycling12,13,14,15, and harmful substances16. Marine geology has transitioned from early efforts to map ocean floor topography and collect rock samples into a modern scientific field that offers insights into the Earth’s history and climate change through the study of marine sediment records17. Marine technology has evolved from basic ocean tools and manual measurements to highly advanced technological applications, including remote sensing18,19,20,21, underwater gliders22, autonomous buoys23,24,25, unoccupied aircraft systems26, and more. Deep-sea exploration27 and climate change28,29 have emerged as a prominent direction in contemporary physical oceanography.
Despite the numerous breakthroughs in the discipline over the last three decades, there remains a notable gap in comprehensive reviews and surveys of oceanography literature as a whole. While some bibliometric studies have focused on specific sub-fields of oceanography, such as marine remote sensing30, ocean circulation31, autonomous underwater vehicles32, Antarctic research33, Ocean Literacy34, and submarine groundwater discharge35, none have attempted to comprehensively cover the entire domain of oceanography, drawing insights from hundreds of thousands of publications. This gap can be attributed primarily to the formidable challenge of managing vast collections of scientific texts, a challenge that has only recently become feasible with the widespread adoption of big data and deep learning techniques.
In recent years, the evolution of big data and machine learning has ushered in a new era of text processing and comprehension. Topic modeling, a method instrumental in semantic analysis and text mining within literature, has emerged as a powerful tool for uncovering abstract topics within a collection of documents. Notably, Callaghan et al. 36 employed the non-negative matrix factorization method to implement a topic model, culminating in the creation of a topic map encompassing over 400,000 climate change publications. The advent of the BERT (Bidirectional Encoder Representations from Transformers) model37 in 2018 marked a transformative milestone in the realms of natural language processing and document modeling. BERTopic, developed by Grootendorst38, further employs the UMAP (Uniform Manifold Approximation and Projection) method39 for dimensionality reduction of document embeddings, subsequently employing HDBSCAN (Hierarchical Density-Based Spatial Clustering of Applications with Noise)40 for clustering. BERTopic effortlessly unravels the topics within vast text corpora while retaining pivotal words in the topic descriptions.
This research employs advanced methodologies, including topic modeling and cluster analysis, to analyze the hot topics and developmental trends in oceanography over the last three decades. Topic modeling reveals latent topics and underlying structures in the literature, beyond explicit keywords. It summarizes topics by analyzing content, providing a more comprehensive and systematic understanding of major topics and trends in a research field compared to keyword analysis. Building on this, we use BERTopic as our topic modeling approach, offering superior quality and interpretability when compared to the non-negative matrix factorization method and traditional machine learning techniques for modeling scientific publications. The study is of great importance in understanding the global oceanography research development from a macro perspective, and reveals the basic pattern of scientific output, research fields, and research topics using objective data and text analysis. The main objectives of this study are: (1) to unveil the hot topics and geographic distribution in oceanographic publications over the last three decades and their corresponding sub-fields; (2) to analyze the relationships between hot topics in oceanography and their sub-fields, along with their cross-domain features; and (3) to analyze the dynamic landscape of hot topics and geographic distribution in oceanography over the last three decades to reveal the developmental trends in the field and provide insights for future research and policy in oceanography.
Results
Topic clusters in the sub-fields of oceanography
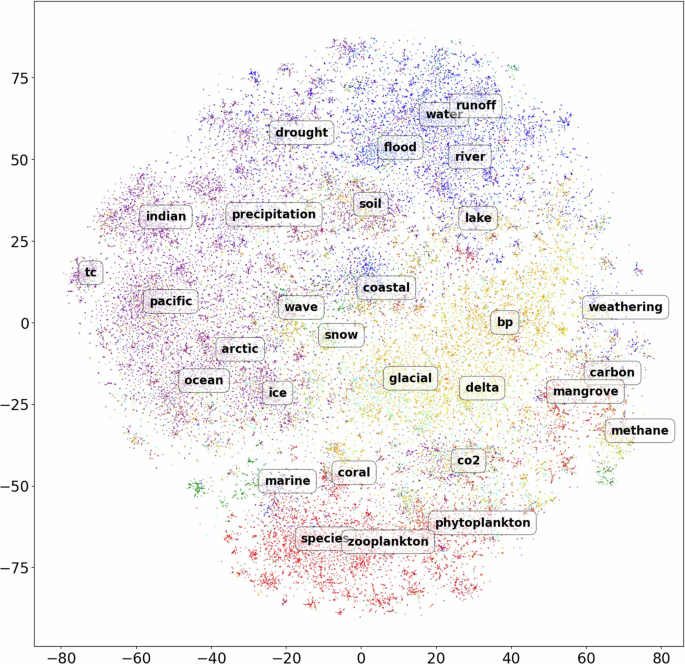
Our multi-class classification model and topic model effectively demonstrate the distribution of different colors in the topic cluster map and most representative topics in the sub-fields represented by each color (Fig. 1). Color clusters correspond to specific research fields, presenting an interplay of topics within and between these fields. The representative topics of the sub-fields represented by different colors are shown in Table 1. Based on the number of points and topics in each color, publications on the field of “marine & freshwater biology” dominate oceanographic research in terms of quantity, followed by “engineering” and “water resources”. However, the number of yellow and cyan points is relatively small, and there is no large cluster in the map to represent these two fields, namely “geochemistry & geophysics” and “science & technology-other topics”. The reason for this outcome is that, among the 334,765 publications and their research area labels obtained from the Web of Science (WOS), although “geochemistry & geophysics” and “science & technology-other topics” are part of the seven research fields with the highest frequency, their quantity (~30,000) is much less compared to the other five fields (~300,000). This imbalance in labeling also results in the rare classification of “geochemistry & geophysics” and “science & technology-other topics” by the One-vs-Rest multi-class classification model.
 using deep learning-based topic modeling and cluster analysis")
The points represent the text positions derived by reducing the 384-dimensional BERT-based text vectors to a two-dimensional space using t-SNE (see Methods for details). While the two axes have no specific meaning, they effectively represent the similarities between texts across 100 topics. Specific fields are displayed using different colors: orange for “geology”, green for “engineering”, red for “marine & freshwater biology”, purple for “meteorology & atmospheric sciences”, blue for “water resources”, yellow for “geochemistry & geophysics”, and cyan for “science & technology-other topics”. The analysis identifies the most explanatory words in each topic, which are words with the highest probability of occurrence in that topic. These words are considered representative of the most prominent or “hot” topics in the field. Note that abbreviations such as et for evapotranspiration, tc for tropical cyclone, ka for kilo-annum, sst for sea surface temperature, hg for mercury, fe for iron, pahs for Polycyclic Aromatic Hydrocarbons, dms for Dimethyl Sulfide are generated by the topic model. This visualization provides the top 100 hot topics in oceanography over the last three decades. The topic cluster map clearly separates the most representative topics in various sub-fields represented by distinct colors, simultaneously highlighting the interdisciplinary nature of oceanography.
Remarkably, even though the field of “physical oceanography” is not explicitly defined in the WOS data, the results from BERTopic modeling effectively distinguish it from other fields, underscoring the robustness of the model. While “physical oceanography” is not included in the predefined research fields in the WOS data, BERTopic successfully identifies it as a distinct region centered around the coordinates [−15, −5] in Fig. 1. In addition to the prominent clusters representing distinct research fields, there are also smaller clusters in the visualization composed of points with diverse colors. For instance, one cluster located to the left of the map center includes topic words “tidal”, “eddies”, “kuroshio”, “volatility”, and “wave”. Most of these topics align with the blue “water resources”, green “engineering”, and purple “meteorology & atmospheric sciences” categories, indicating their strong interdisciplinary nature. However, these topics exhibit significant relevance to the realm of “physical oceanography”. Therefore, we assert that topics demonstrating robust cross-domain characteristics should be attributed to the domain of “physical oceanography”.
The geographic distribution of oceanography research publications reveals distinct patterns across different oceanic regions, highlighting variances in national research focuses and opportunities for international collaboration. After excluding 12,001 publications without recorded author country information, we used 322,764 publications to analyze national contributions across four ocean topics (Fig. 2). The contributions of each country to the four sub-geographical determinants are shown in Supplementary Fig. S3. For the Pacific Ocean, identified by the keyword “Pacific” (Fig. 2a), research is predominantly led by China and the United States. The Atlantic Ocean, denoted by “Atlantic” (Fig. 2b), research is predominantly led by the United States, with significant but lesser contributions from some developed countries along the Atlantic coast, including Canada, the United Kingdom, France, Germany, and Russia. The Arctic Ocean, represented by “Arctic” (Fig. 2c) shows minimal interest from Southern Hemisphere countries but significant contributions from bordering countries such as Sweden, Norway, and Finland. For the Indian Ocean, represented by “Indian” (Fig. 2d), China leads, with the United States and India also being key contributors. Notably, “Indian” is not the most representative topic word in this topic; instead, “monsoon” and “rainfall” are more prominent. This may indicate that, within the broader topic of the Indian Ocean, scientists are more inclined to focus on specific smaller-scale topics such as monsoon, monsoon precipitation, and the Indian Ocean Dipole. Overall, different ocean topics have specific geographic distribution characteristics. Different countries tend to allocate research resources to the oceans that impact them the most. However, countries with strong research capabilities, like China and the United States, may also show a strong interest in distant marine areas. This presents opportunities for further international cooperation in oceanography. Since not all countries have sufficient research resources, cooperation between economically developed countries and developing countries along the target marine areas can be mutually beneficial: the former can more easily access research results, while the latter can gain valuable research experience and potentially fill research gaps.
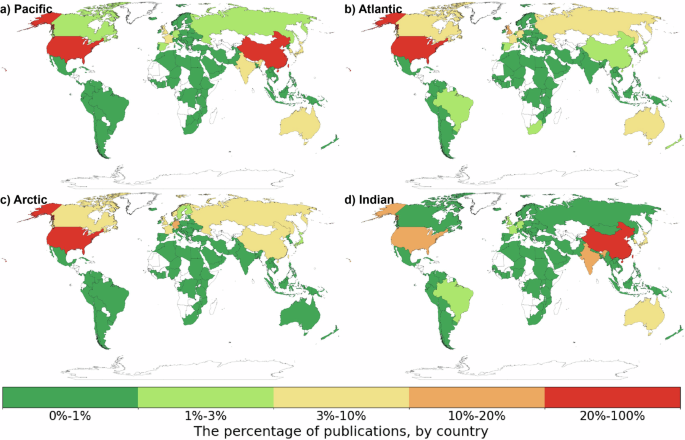
The percentage of publications from each country is represented by different colors. Dark green represents a proportion of 0%–1%, light green represents 1%–3%, yellow represents 3%–10%, orange represents 10%–20%, and red represents 20%–100%. a Pacific. b Atlantic. c Arctic. d Indian.
Interdisplinary of the topics and sub-fields in oceanography
The points in the topic clustering graph represent the text positions derived by reducing the 384-dimensional BERT-based text vectors to a two-dimensional space using t-SNE (see Methods for details). The two axes in this reduced space do not directly correspond to specific features but instead reflect the similarities between the texts of 100 topics. The proximity of points within the topic cluster map indicates a greater similarity between the the text of two publications. The closer the points, the stronger the correlation between their respective topics. For example, in the cluster representing “marine & freshwater biology”, topics such as “phytoplankton”, “zooplankton”, and “chlorophyll” are located near each other, highlighting their high interrelation within the field. Similarly, the “geology” cluster includes closely positioned topics like “erosion”, “basin”, and “fault”. From the perspective of sub-fields distinguished by different colors, there is a noticeable gap between the red cluster of “marine & freshwater biology” and points of other colors. This separation suggests a degree of independence for “marine & freshwater biology”, indicating fewer interdisciplinary connections. However, the clusters for “meteorology & atmospheric sciences”, “water resources”, and “geology” represented by purple, blue, and yellow, respectively, do not show a distinct separation. Instead, there are clear transition zones between purple and blue, and between blue and yellow, indicating a correlation or interdisciplinary nature among these three fields of research.
Topics in the fields of “meteorology & atmospheric science”, “geology”, and “water resources” exhibit a significant degree of interdisciplinary research. The top ten topics within each sub-field are presented in the left column of Fig. 3. We define topics with a topic entropy greater than 1 as having strong cross-domain features, while those with a topic entropy less than 1 are considered to have weak cross-domain features. The results of the topic entropy illustrate that “evapotranspiration” (i.e., et), “sediment”, “drought” possess relatively strong cross-domain features. For “evapotranspiration”, a significant proportion of publications are found within the fields of “meteorology & atmospheric sciences”, “geology”, and “water resources”. Evapotranspiration, the process through which water is transferred from the land to the atmosphere by soil and surface evaporation and plant transpiration41, is naturally pertinent to these three fields, given its integral role in the hydrological and climatic systems. Publications on sediment predominantly associate with “meteorology & atmospheric sciences”, “marine & freshwater biology”, and “geology”. Marine/ocean/seafloor sediment, consisting of insoluble particles accumulated on the seafloor, originates from soil and rocks, transported to the sea via rivers, wind-borne dust, and glacial flow42,43. This justifies the interest in sediments from the perspectives of both “meteorology & atmospheric sciences” and “geology”. Since some sediments come from marine organisms44, “marine & freshwater biology” also studies sediments. Regarding drought, a substantial number of publications belonging to “meteorology & atmospheric sciences” and “water resources”. Drought, characterized as a recurring and increasingly unpredictable climate feature exacerbated by climate change45,46, is an important topic in “meteorology & atmospheric sciences” due to its impact on climate patterns. Additionally, drought-related issues such as reduced surface and subterranean water levels and lower flow rates47, make it a key subject in the field of “water resources”.
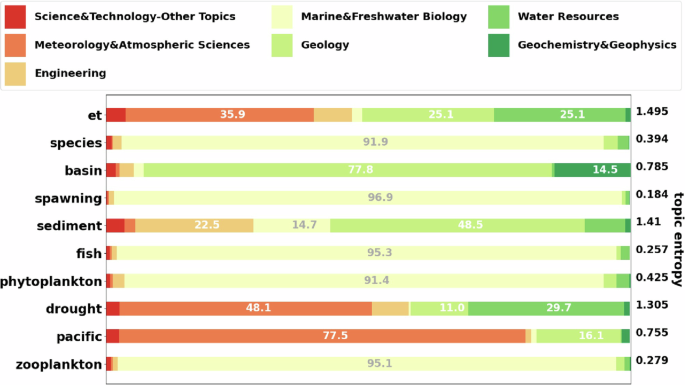
Seven distinct sub-fields of oceanography are presented in the figure. The top 10 topic words are displayed on the left axis, each linked to different proportions within the labeled sub-fields, as shown in the accompanying bar chart. Labels are omitted when their proportions falls below 10%. On the right side of the figure, the computed topic entropy values are presented, each corresponding to its respective topic. Notably, the first topic word, “et” represents the abbreviation for “evapotranspiration”, a term effectively trained and generated by the BERTopic model. The sub-fields of “meteorology & atmospheric sciences”, “geology”, and “water resources” demonstrate significant cross-domain characteristics, in contrast to “marine & freshwater biology”, which shows comparatively weaker cross-domain aspects. This variation is evident from topic entropy values. Notable examples like “evapotranspiration”, “sediment”, and “drought” exhibit high cross-domain attributes, indicative of their study involving multiple interdisciplinary fields.
Unlike fields such as “meteorology & atmospheric sciences”, “geology”, and “water resources”, where interdisciplinary research is more common, topics within “marine & freshwater biology” tend to exhibit lower levels of interdisciplinarity. This trend is evident through a notable focus on specific biological subjects within publications related to “marine & freshwater biology”. An analysis of topic entropy across top ten topics reveals that low-entropy topics, such as “spawning”, “fish”, and “zooplankton” are predominantly confined to the sub-field of “marine & freshwater biology”. In contrast, fields like “meteorology & atmospheric sciences”, “geology”, and “water resources” demonstrate higher levels of interdisciplinarity. Topics such as “sediment” or “drought” fall under these categories and are characterized by high entropy, indicating their broader relevance across multiple disciplines. This quantitative analysis of topic entropy not only supports the previous qualitative findings but also reinforces the reliability of the conclusions, showcasing distinct patterns of interdisciplinarity in these fields.
Trends of publications and topics in oceanography in the last three decades
In the last three decades, oceanographic research has shown an increasing trend of national diversity in publications. Fig. 4 shows the changing proportion of publications from each country across all periods and in three different decades. For the overall period (Fig. 4a), the United States produced the most publications, followed by China., with Canada, the United Kingdom, France, Germany, Russia, Japan, India, and Australia also playing significant roles in oceanographic research. In 1992–2001 (Fig. 4b), oceanographic research was heavily concentrated in a few economically developed countries. In 2002–2011 (Fig. 4c), emerging countries such as Russia, China, and Japan began to establish a stronger presence in oceanographic research. In 2012–2021 (Fig. 4d), China had surpassed the United States to become the top country in terms of publication output in oceanographic research. Regional powers like India, Iran, and Brazil also began to intensify more efforts. Additionally, some developing countries started to fill gaps in oceanographic research as well. Overall, these thirty years have seen a shift from a heavy focus on a few economically developed countries to a broader, more global engagement in oceanographic research. While this is a positive development, increased international collaboration and research funding are essential to further involve less economically developed countries, fostering a more diverse and thriving global oceanographic research landscape.
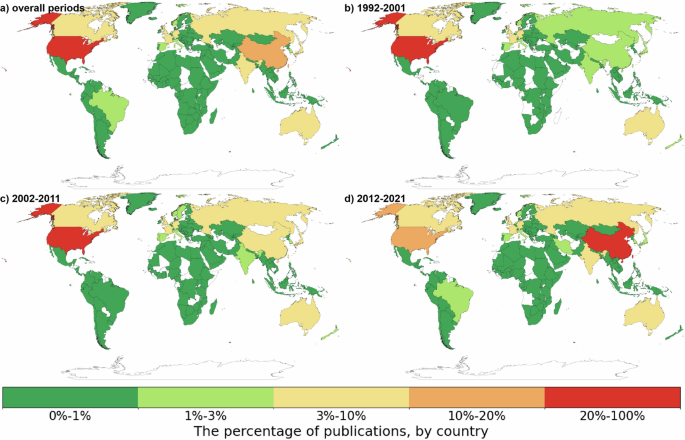
The percentage of publications from each country is represented by different colors. Dark green represents a proportion of 0%–1%, light green represents 1%–3%, yellow represents 3%–10%, orange represents 10%–20%, and red represents 20%–100%. (a) It shows the proportion of publications from each country across all periods. The proportion of publications in three different decades is displayed in (b), (c) and (d).
Research trends and popular topics in scientific fields are dynamic and evolve over time. To analyze these trends, we calculated the frequency of each topic in each decade and then assessed their growth rate in the subsequent second and third decades. This analysis was conducted using a frequency matrix, which allowed us to track shifts and developments in research focus across different time periods.
From 1992 to 2001, the dominant topics were mostly in the field of “marine & freshwater biology” (Fig. 5a). This period was characterized by a focus on the top ten topics, including “acoustic”, “zooplankton”, “phytoplankton”, “vorticity”, “fish”, “species”, “spawning”, “chlorophyll”, “bacterial”, and “Atlantic”. From 2002 to 2011, the fastest-growing topics were mostly in the field of “water resources” (Fig. 5b). The top ten fastest-growing topics during this decade included “mufflers”, “landslide”, “neural”, “groundwater”, “soil”, “water”, “monsoon”, “uncertainty”, “flood”, and “energy”. This growth reflects a growing understanding of the impact of global changes on water resources. It particularly emphasizes the role of groundwater in various domains, including drinking water supply, agriculture, industry, and ecosystem conservation48. From 2012 to 2021, the largest growing trend towards topics in “water resources” continued (Fig. 5c). The top ten topics with the highest growth rate during this decade included “plastic”, “water”, “flood”, “neural”, “uncertainty”, “energy”, “pile”, “climate”, “drought”, and “coastal”. Notably, there has been an increase in the focus on “climate” and “drought”, underscoring growing concern over climate-induced extreme events such as floods and droughts49. This decade also saw heightened attention to coastal zones, which are among the world’s most densely populated and increasingly vulnerable regions due to climate change-induced stressors, including rising sea levels, intensified storms, droughts, and ocean acidification50.
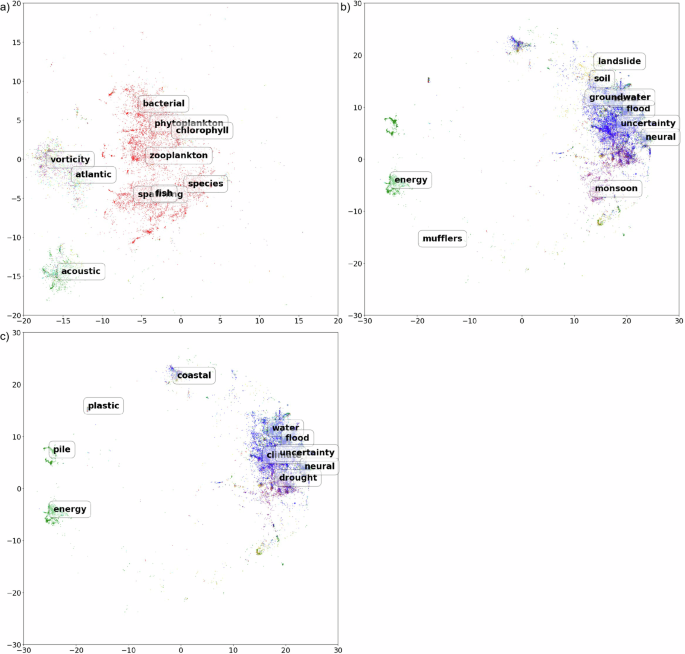
The points represent the text positions derived by reducing the 384-dimensional BERT-based text vectors to a two-dimensional space using t-SNE (see Methods for details). Based on Fig. 1, the top ten topics with the highest frequency in the first decade (a), and the highest growth rate in the second (b) and third decades (c), were highlighted. The term “growth rate” here refers to the percentage increase in the number of publications on a given topic in the second or third decade compared to the previous decade. The points shown on these topic cluster maps represent the publications within each topic. In the past twenty years, topics related to water resources have shown the highest growth rate.
It is worth mentioning that in both the second and third decades, “uncertainty” has emerged as one of the fastest-growing topics. The rapid growth of “uncertainty” within oceanography can be attributed to several key factors, including the need to address uncertainty in climate models, predict natural disasters51,52, deal with data and observation uncertainties53, fulfill policy and management requirements54, and engage in interdisciplinary research. These factors have collectively heightened the importance of uncertainty analysis in the field, making it a central topic for enhancing oceanographic research and decision-making processes.
Over the last two decades, there has been a significant rise in research topics significantly correlated with climate change. Using the unique WOS ID of these documents, we further explored the intersection between oceanography and climate change, revealing 2866 overlapping publications from 1992 to 2001, 11,335 from 2002 to 2011, and a substantial increase to 38,015 from 2012 to 2021. In total, we identified 52,216 overlapping publications across three decades. Modeling the topics of these publications and visualizing 30 topics, it is evident that both oceanography and climate change focus on the four fields: “geology”, “marine & freshwater biology”, “meteorology & atmospheric sciences”, and “water resources” in the topic cluster map (Fig. 6). In comparison to Fig. 1, the proportion of the “engineering” topics has significantly decreased, demonstrating that research on climate change in oceanography is more focused on scientific issues, with less practical ocean engineering efforts and solutions addressing climate change. This trend also underscores the evolving focus of oceanographic research in the context of global climate dynamics.
The points represent the text positions derived by reducing the 384-dimensional BERT-based text vectors to a two-dimensional space using t-SNE (see Methods for details). Specific subcategories are displayed using different color points. Orange points are for “geology”, green points are for “engineering”, red points are for “marine & freshwater biology”, purple points are for “meteorology & atmospheric sciences”, blue points are for “water resources”, yellow points are for “geochemistry & geophysics”, and cyan points are for “science & technology-other topics”. Additionally, the abbreviation tc stands for tropical cyclone, and bp stands for before present. In oceanography’s exploration of climate change, the sub-fields of “geology”, “marine & freshwater biology”, “meteorology & atmospheric sciences”, and “water resources” have shown to be especially relevant.
Discussion
This study utilized deep learning-based topic modeling and cluster analysis to evaluate oceanography publications from 1992 to 2021. The resulting topic cluster map revealed rapidly growing topics over three decades, illustrating the relationships between sub-fields, and the correlation between oceanography and climate change. Notably, interdisciplinary topics such as “evapotranspiration” and “sediment” were identified, connecting fields such as “meteorology & atmospheric sciences”, “geology”, and “water resources”. Conversely, topics like “spawning” and “zooplankton” remained primarily within “marine & freshwater biology”. Additionally, a temporal analysis highlighted increasing interest in water resources and precipitation. The study’s visualization of 30 common topics underscored the overlapping areas of interest between oceanography and climate change, particularly in “geology”, “marine & freshwater biology”, “meteorology & atmospheric sciences”, and “water resources”. This analysis highlights the evolving nature of oceanographic research and its increasing convergence with climate change studies, pointing to emerging trends and areas of growing interest in the field.
We conducted the analyses concerning the distribution of oceanographic research across countries. The analysis highlighted the shift in the focus of ocean research from a few economically developed countries to broader, more global participation. It emphasized the importance of further investment in research funding and international cooperation, particularly collaboration between developed and developing countries. Besides the four major ocean topics included in the study, another significant ocean, the Southern Ocean, was overlooked. Our topic model did not include a topic with ‘antarctic’ or ‘southern’ as a primary topic word. In fact, ‘antarctic’ appears in a topic with ‘ice’ as the primary topic word, but its representativeness is very low, ranking only ninth among ten topic words, so it cannot be considered a representative topic word for this topic. This also suggests a certain degree of neglect in Southern Ocean research. Future oceanographic studies need to address this gap with dedicated research efforts.
Our research of trends in oceanographic research in the last thirty years reveals a progressively stronger relationship with climate change studies. Accordingly, the field of oceanography is expected to be influenced by several promising directions in future. Firstly, carbon-related topics, such as CO2, carbon, and methane, are prominently featured (Fig. 6). The study of carbon cycling, which plays a crucial role in climate change mitigation, is expected to continue as a key area of focus in oceanographic research. Understanding carbon storage mechanisms, emissions patterns, and their impacts on marine ecosystems remains imperative in addressing global climate challenges. Secondly, one of the fastest-growing topics of the last two decades is “uncertainty.” Addressing uncertainty in climate models is important for predicting natural disasters and informing policy and management decisions. This challenge underscores the need for advancement of technologies, particularly in enhanced data collection and analysis, such as higher-resolution satellite observations and sensor networks. Furthermore, the fastest-growing topics in the last decade also include “neural”. The application of AI models represented by neural networks in oceanography has made significant breakthroughs, such as the El Niño Southern Oscillation (ENSO) forecasts55 and track forecast for typhoon56. Anticipations for the future include the development of even more precise AI models, with a broader spectrum of applications expected in oceanography. Lastly, the topics of climate-related extreme events have been the fastest-growing in the last two decades. Research on extreme event, such as hurricanes, floods, tsunamis, and marine heatwaves, are expected to continue to receive high attention, aligns with the global urgency to better understand these events and improve predictive accuracy. The continued focus on these extremes is vital not only for advancing scientific knowledge but also for developing effective mitigation and response strategies in the face of escalating climate challenges.
We used bibliometric methods to analyze oceanographic publications from 1992 to 2021 and also conducted explicit analysis of publication indicators by country, institution, and journal (detailed in Supplementary Information). We calculated the major collaborative countries of the top fifteen countries, in terms of the number of oceanographic publications over the last thirty years (Supplementary Fig. S2). Except for the United States (US), most countries have primarily collaborated with the US over the last three decades. There are only two exceptions, including Russia (2012–2021) and the Netherlands (1992–2001), which primarily collaborated with Germany. In the first two decades, Canada was the US’s main collaborator in oceanography, but this shifted in the last decade to China. This shift is marked by a significant increase in joint publications between the US and China. The collaboration between scientists from different countries is crucial for the progress of the field, and further strengthening of cooperation is needed to better address global challenges such as climate change and extreme events in the oceans.
Compared to the traditional keyword analysis commonly used in bibliometric research, topic modeling offers a more objective and systematic approach to uncovering latent themes within oceanographic literature. Unlike keyword analysis, which relies on manually selected terms and can be influenced by human bias, topic modeling is a data-driven approach that identifies and summarizes topics by analyzing the content of the literature, helping to uncover the major topics and trends in the research field. This capability allows for the discovery of multi-layered and multi-dimensional topics within the literature, and by summarizing the various topic words under different topics, it helps researchers gain a deeper understanding of the complexity and details of the field of oceanography. Additionally, since oceanography research often involves multiple disciplines, topic modeling can also identify interdisciplinary areas, helping researchers understand the connections and influences between different fields.
The topic modeling clustering map method used in previous study36 was non-negative matrix factorization57. While this basic method provides useful topic modeling results and two-dimensional visualization, it has limitations, including the appearance of duplicated topics in the clustering maps. To address these issues, we used the BERTopic method, which is based on pre-trained language models and offers several advantages over traditional non-negative matrix factorization method. BERTopic utilizes pre-trained deep neural networks, such as BERT, to capture complex semantic information through high-dimensional text representations. This is in contrast to the low-dimensional, frequency-based representations used by traditional non-negative matrix factorization method. BERTopic’s primary use is to identify and extract topics from text data, thus revealing hidden thematic structures within a collection of documents. In our approach, we calculated the average vectors of documents with the same topic, combined these with topic vectors, and applied dimensionality reduction. This process resulted in a two-dimensional cluster map that displays the positions of both documents and topics, thus expanding the application scenarios of BERTopic.
Our approach demonstrates robustness, although the most representative fields from the data obtained from the WOS were not complete. The absence of a predefined “physical oceanography” category posed a challenge. Nevertheless, our visualization results revealed a significant interdisciplinary cluster mostly comprising topics from “water resources”, “engineering”, and “meteorology & atmospheric sciences”. We attributed these topics with strong cross-domain features to “physical oceanography”, illustrating the BERTopic model’s effectiveness in distinguishing this field from others despite its absence in the predefined categorization.
There are areas for improvement in the future research. Currently, our database is limited to the WOS core collection. In the future, we could supplement our oceanographic literature data with additional sources from other scientific databases such as Scopus. Additionally, while classifying 334,765 documents, we relied on the seven most frequent field categories in the database, but more authoritative classification methods could be explored. Furthermore, we used the One-vs-Rest model in our multi-class classification approach, which could be improved with more complex and effective models for better accuracy. We hope that this research serves as a summary of the history of global oceanographic research and provides a foundation for future studies, further advancing the field of oceanography.
Methods
Data source
We established our bibliometric database from academic publications in Web of Science’s core collection. Using search query “SU=Oceanography”, we obtained 352,506 publications in the field of oceanography from 1992 to 2021. We retained 334,765 publications with abstracts for topic modeling. We use WOS ID, which is the unique academic work identifier assigned in the WOS bibliographic database, as the unique identifier for each publication.
One-vs-Rest multi-class classification algorithm
The “One-vs-Rest” algorithm is a multi-class classification approach that transforms multi-class problems into multiple independent binary classification tasks. In this method, each class is treated as a separate binary classification problem, where one class is designated as the positive class, and all other classes are treated as negative. Then, a binary classifier is trained for each class to predict whether a sample belongs to that class or not. During prediction, these independent classifiers provide scores or probabilities for each class, and the class with the highest score is selected as the final classification result for the sample. In this article, we implemented this algorithm using the “OneVsRestClassifier” from the “scikit-learn“58 library in Python.
Research field classification
The research field of each article is determined in the oceanography publications database created through the WOS. According to WOS, each publication belongs to one or more research fields, with a total number of 105. Among the total 105 research fields including 334,765 publications, we selected seven research fields with the highest frequency as the final categories including “geology”, “engineering”, “marine & freshwater biology”, “meteorology & atmospheric sciences”, “water resources”, “geochemistry & geophysics”, “science & technology-other topics”. Since each article belongs to one or more research field, and some articles do not belong to one of the above seven research fields. We hope to classify each publication into one of the seven research fields it is most likely to belong to in future topic modeling. This step is to reflect the differences between research fields and study the relationship between publications, research fields, and topics, and fewer representative fields to be easier for future analysis. Therefore, we use the multi-class classification model One-vs-Rest to reclassify all documents into the only one of the above seven research fields. The final field distribution of all data obtained is as follows: “geology” (67,499), “engineering” (69,068), “marine & freshwater biology” (79,533), “meteorology & atmospheric sciences” (50,296), “water resources” (36,745), “geochemistry & geophysics” (15,139), “science & technology-other topics” (16,485). The fields obtained by the above method are used as the basis for color division of the cluster map.
Topic model
We employed the latest topic modeling technique, BERTopic37, to construct a topic map encompassing 334,765 oceanography publications. BERTopic uses BERT embeddings combined with TF-IDF to generate compact clusters, leveraging a pre-trained model for document embeddings, such as the widely-used Sentence-BERT by Reimers et al. 59 With specific parameter configurations, we set the number of topics to 100, extracting 100 topics with 10 topic words each. The highest probability topic word within a topic was then chosen as its name. After model training, we obtained 334,765 text vectors, each comprising 384-dimensional abstracts. These vectors were then averaged across the 100 topics and combined, yielding a total of 334,865 text vectors, each of which is 384-dimensional. The topic model provide the location of each abstract and topic in a 384-dimensional topic space. To visualize this high-dimensional data, we used t-SNE (t-Distributed Stochastic Neighbor Embedding)60, a dimensionality reduction technique, mapping each abstract’s topic scores in two dimensions. Abstracts are placed on the map such that those with similar topic combinations are nearby, with the central topic name displayed among abstracts of the same topic.
Topic entropy
We use topic entropy to measure the cross-domain features of a topic, building upon the concept of information entropy. Information entropy quantifies the complexity of a system. When the system has higher entropy, it indicates greater complexity with diverse situations. On the other hand, lower entropy suggests the system is simpler with few types of situations. Similarly, a higher topic entropy implies stronger cross-domain features of a topic, whereas a smaller topic entropy suggests weaker cross-domain features. The topic entropy (H) is calculated as:
where p denotes the empirical distribution of a field f in each topic, f denotes sub-fields, z denotes topics, K denotes the number of sub-fields. We calculated the proportion of sub-fields corresponding to the publications of all 100 topics.
Responses