Fast, three-dimensional, live-cell super-resolution imaging with multiplane structured illumination microscopy

Main
As a fundamental tool for cell biology, the resolution of fluorescence microscopy is limited by the Abbe diffraction limit. Recent developments in super-resolution microscopy have surpassed the diffraction limit, enabling the observation of cellular components with an exceptional resolution that surpasses the diffraction limit1,2,3,4,5. Among these techniques, SIM has been used widely for live-cell imaging due to its relatively low photobleaching and phototoxicity, which has been effectively demonstrated via 2D-SIM and total internal reflection fluorescence SIM6,7,8,9,10,11.
SIM achieves enhanced resolution through the application of a known sinusoidal illumination pattern, capturing modulated sample structures as moiré fringes. These fringes are then computationally processed to extract the super-resolution components and reassembled to produce images with improved resolution2,3. In the spatial frequency domain, this method involves convolving the illumination pattern’s optical transfer function (OTF), which consists of delta functions at frequencies present in that pattern, with the detection OTF. To achieve a twofold improvement in both the lateral and axial resolution, 3D-SIM uses three-beam interference12. However, owing to the need for sequential, plane-by-plane sample movement and imaging, 3D-SIM is slow, taking up to several seconds to capture images of a single volume. This hinders the observation of rapid biological processes in three dimensions and potentially introduces motion artefacts13,14.
To enhance the volumetric imaging capability, various strategies have been introduced to simultaneously image multiplanes using an image-splitting prism (ISP)15 or a multifocus diffraction grating16,17 to introduce discrete optical path-length differences. Combined with structured illumination, multiplane SIM and multifocus SIM (hereafter referred to as 2D-MP-SIM18 and slice MF-SIM19,20) have been proposed for simultaneously capturing multiplane lateral super-resolution images at different depths. However, their axial resolutions remain unchanged (~500 nm) as the super-resolved axial spectrum frequency signals cannot be separated and expanded in the original physical model (Extended Data Fig. 1 and Supplementary Note 1). As a result, the reconstruction pipelines still follow the conventional plane-by-plane procedure, which restricts the ability to thoroughly examine the movements of fine cellular structures in three dimensions.
Here we introduce 3D-MP-SIM, which achieves fast, volumetric, super-resolution imaging via the integration of three-beam interference, multiplane detection and a synergistically evolved SIM reconstruction algorithm driven by a modified physical model. 3D-MP-SIM achieves a resolution that is comparable to 3D-SIM (lateral, ~120 nm; axial, ~300 nm) while exhibiting fewer motion artefacts in live cells. By demonstrating high-speed imaging of the endoplasmic reticulum (ER) and dual-colour imaging of rapid organelle contacts, we highlight the great potential of 3D-MP-SIM for advancing our understanding of dynamic processes in living cells.
Results
Development and characterization of 3D-MP-SIM
For multiplane imaging, samples are excited using a single 3D structured pattern, and the fluorescence emitted from different depths is simultaneously captured by two cameras15,18,19,20 (Fig. 1a and Supplementary Note 1). The raw images contain the high-frequency spectrum of the sample, which is convolved with the seven spatial frequency components (that is, seven delta functions at different frequencies) of the illumination pattern and then shifted both laterally and axially into the OTF of widefield microscopy detection21, whose axial frequency bandwidth is ({{bf{k}}}_{{z}_{0}}) (Fig. 1b). This is in contrast to conventional 3D-SIM, which integrates the axial super-resolution spectrum into the axial-extended detection OTF during imaging (Fig. 1c). Because conventional 3D-SIM has a cumulative axial bandwidth of the widefield OTF cut-off frequency ({{bf{k}}}_{{z}_{0}}) with the axial pattern vector pz (that is, ({{bf{k}}}_{{z}_{0}}+{{bf{p}}}_{z})), which is approximately twice that of ({{bf{k}}}_{{z}_{0}}), this necessitates an axial sampling rate about twice that of widefield microscopy according to the Nyquist sampling theorem. By contrast, 3D-MP-SIM requires only an axial sampling rate equal to that of widefield mode (Fig. 1b,c, Extended Data Fig. 1 and Supplementary Note 1). In line with the axially overlapped frequency bands, conventional five-component separation methods of 3D-SIM with only a lateral phase shift cannot be used to extract axial information from the 3D-MP-SIM data. Thus, we introduced an additional axial phase shift to construct the seven-dimensional separation matrix (Supplementary Note 1). Specifically, in addition to the conventional lateral phase shifts spaced by 2π/5, another axial phase shift was implemented that was spaced by π/2 during illumination (Supplementary Fig. 1 and Supplementary Note 1).

a, Schematic illustration of capturing different depths that are evenly spaced along the axial direction within the sample. b,c, 3D spectra of 3D-MP-SIM (b) and 3D-SIM (c) raw data (first row), where the colours indicate aliased frequency components and their corresponding axial cross-sections (second row). With the pattern vectors of 3D-MP-SIM and 3D-SIM (third row), their components are shifted to their original positions. Finally, the laterally and axially extended super-resolution spectra are assembled (fourth row). kz, axial vector; kxy, lateral vector. d, Optical set-up for 3D-MP-SIM (see Methods for a detailed description). AOTF, acoustic-optical tunable filter; HWP, half-wave plate; PBS, polarizing beamsplitter; L1–L8, lenses; M1–M3, mirrors; QWP, quarter-wave plate; OBJ, objective; FW, filter wheel. e, Reconstruction pipeline: the process begins with subpixel registration, followed by transforming the raw images into the frequency domain and separating the components using a two-step method. Next, the illumination parameters are estimated, and the separated spectra are shifted back to their original positions. Finally, a Wiener filter is applied to merge the spectra, achieving a super-resolution reconstruction. Δz, axial phase shift; U, upper; L, lower; Dir, direction; IFFT, inverse fast Fourier transform.
The introduction of an axial phase shift for separating the axial spectrum frequency signals can be attained via phase modulation or an optical delay line. We first adopted the latter, which consists of a right-angle prism and a retroreflecting hollow roof prism mirror mounted on a piezo stage, and positioned it at the conjugate plane of the spatial light modulator (SLM) (Fig. 1d, Supplementary Note 1 and Supplementary Figs. 1 and 2). In addition, we experimentally verified that the delay lines induced a precise axial phase shift as needed (Supplementary Note 3 and Supplementary Fig. 3). For multiplane imaging, we designed an optical system in which the fluorescence signals were separated by the ISP in the detection path and simultaneously captured at eight distinct regions using two cameras; each region focused on different depths evenly spaced along the axial direction within the sample (Fig. 1a,d). Generating excitation fields with high modulation contrast is critical for SIM; here, a crucial step in enhancing the modulation contrast is converting the polarization of the three input beams to s-polarization (that is, linearly polarized perpendicular to the plane of incidence). This adjustment is achieved using a high-speed liquid crystal variable retarder (HS-LCVR) in conjunction with a quarter-wave plate before the custom polarization-maintaining dichroic mirror. The synchronization diagram was designed to effectively coordinate the pattern generation of the SLM, the exposure of the camera, the switching of the laser, the operation of the HS-LCVR and the movement of the piezo stage (Supplementary Fig. 4).
To reconstruct the 3D-MP-SIM data, the eight planes of the sample that were simultaneously captured at the eight different regions by the two cameras were registered as raw images for the subsequent reconstruction (Supplementary Fig. 5). The reconstruction of the 3D-MP-SIM data involves several essential steps (Fig. 1e) that are similar to those of conventional 3D-SIM: spectrum separation, parameter estimation, spectrum shifting and Wiener filtering. A remarkable distinction, however, was the handling of the orders ±1 spectra, which should be further divided into upper and lower parts (Fig. 1e and Supplementary Note 4). Theoretically, to separate seven components (order 0, orders ±2, the upper and lower parts of orders ±1), seven raw images need to be captured to solve a seven-dimensional system of equations (Supplementary Note 1). This includes five and two additional raw images captured, respectively, before and after the axial shift by π/2. Although this strategy was shown to be effective in simulations and with fluorescence beads (Supplementary Note 5 and Supplementary Figs. 6 and 7), it led to slight discontinuous artefacts in the biological samples (Supplementary Fig. 8). The susceptibility of the reconstructed images to small disturbances such as noise is attributed to the high condition number of the seven-dimensional separating matrix in the equation system (equation (11) in Supplementary Note 1). The condition number is a concept in mathematics theory for measuring susceptibility22; here, the seven-dimensional separating matrix has a high condition number equal to 5.2, indicating its instability for separation and subsequent reconstruction. Therefore, a two-step reconstruction pipeline was developed: we initially separated images of orders 0, ±1 and ±2 using lateral phase shifts, similar to those of conventional 3D-SIM; next, we further separated the upper and lower parts of the orders ±1 using an axial phase shift (Fig. 1e and Supplementary Note 4). This method enhanced the robustness and accuracy of the reconstruction in 3D-MP-SIM, particularly in handling real biological samples (Supplementary Fig. 8), with the lower condition number of 1.4 (Supplementary Note 6). Another remarkable distinction in 3D-MP-SIM was that the seven components were repositioned to their original locations with a 3D wave vector incorporating the lateral pattern vector pxy and the unique axial pattern vector pz (ref. 21) (Fig. 1b and Supplementary Note 4). To mitigate the roll-over artefacts, which are manifested by the reappearance and mixing of images at the stack edges, we adopted a padding strategy, as commonly used in conventional 3D-SIM (Supplementary Fig. 9). Specifically, we applied zero-padding to the raw 3D-MP-SIM data by adding four zero-intensity planes at both ends. After reconstruction, the central 16 planes were extracted as the final result.
Using the aforementioned new designs, we imaged 100-nm-diameter fluorescent beads using 3D-MP-SIM to benchmark its performance with respect to 2D-MP-SIM, slice MF-SIM and conventional 3D-SIM. A total of 30 exposures (five lateral phases × three orientations × two axial phases, 10 ms each) was captured. By comparison, we performed 3D-SIM imaging (five lateral phases × three orientations × sixteen planes, 10 ms each) on the same regions at a z-step size of 111 nm—effectively corresponding to 92.5 nm due to the refractive mismatch between oil and water23,24—immediately after 3D-MP-SIM imaging. To obtain a holistic comparison, we also include both 2D-MP-SIM and slice MF-SIM modes in the analysis (Fig. 2a–c). Resolutions were quantified using decorrelation analysis25. For estimation of the lateral resolution, we adhered to the recommended protocol and parameter settings25. However, estimation of the axial resolution was constrained by the limited axial planes (for example, only 8 or 16 planes). To enhance the axial planes, we concatenated multiple y–z cross-sectional images, arranging various cross-sections randomly along the axial direction (Methods and Supplementary Figs. 10 and 11). Although the lateral resolutions of all the tested methods were doubled compared with those of widefield microscopy, only 3D-MP-SIM achieved an increase in the axial resolution comparable to that of 3D-SIM, surpassing both 2D-MP-SIM and slice MF-SIM (Fig. 2d,e and Supplementary Table 1). The result is consistent with the measurements of the full-width at half-maximum (FWHM) values in both the lateral and axial directions (Extended Data Fig. 2a and Supplementary Table 2). Notably, 3D-MP-SIM achieved an increase in the axial resolution using one-eighth of the exposure cycles needed by 3D-SIM. Moreover, the reconstruction model of 3D-MP-SIM did not require the alignment of the maximum stripe modulation position of the axial interference pattern with the image plane. Therefore, the illumination pattern focus plane optimization step required for the imaging of the axial plane during 3D-SIM or slice MF-SIM imaging was not needed26.

a, Lateral cross-sectional image of 100-nm-diameter fluorescent beads acquired via (from top to bottom) widefield (WF) microscopy, 2D-MP-SIM, slice MF-SIM, 3D-SIM and 3D-MP-SIM. Scale bar, 5 µm. b, Axial cross-sections along the dashed line in a. Scale bar, 1 µm. c, Logarithm magnitude of OTFs derived from different imaging modes. Scale bar, 1/500 nm−1. d, Axial intensity profiles of the bead indicated by the arrowheads in b. e, Resolution quantification with 100 nm fluorescent beads. Decorrelation analysis data were measured on 64 x–y cross-sections and 48 concatenated y–z cross-sectional images from four independent experiments for each imaging mode. Widefield mode: 248.63 ± 9.82 nm (lateral), 543.01 ± 10.55 nm (axial); 2D-MP-SIM: 116.46 ± 2.42 nm, 562.61 ± 17.32 nm; slice MF-SIM: 118.47 ± 3.02 nm, 576.16 ± 8.50 nm; 3D-SIM: 119.62 ± 2.09 nm, 274.06 ± 4.49 nm; 3D-MP-SIM: 112.94 ± 3.40 nm, 273.58 ± 4.84 nm. f, Maximum intensity projection (MIP) of immunolabelled microtubules in a fixed U2OS cell imaged using 3D-MP-SIM. Scale bar, 5 µm. g,h, Magnified x–z (g) and y–z (h) cross-sections along the dashed lines in f to compare the five imaging modes, with white arrowheads indicating the differences. Scale bars, 1 µm. i, Resolution quantification with immunolabelled microtubules in the fixed U2OS cells. Decorrelation analysis data were measured on 48 x–y cross-sections and 36 concatenated y–z cross-sectional images from three independent experiments for each imaging mode. Widefield mode: 266.42 ± 2.44 nm (lateral), 556.65 ± 15.65 nm (axial); 2D-MP-SIM: 126.22 ± 1.95 nm, 572.48 ± 13.62 nm; slice MF-SIM: 129.14 ± 1.84 nm, 578.68 ± 18.51 nm; 3D-SIM: 125.09 ± 5.33 nm, 288.21 ± 6.59 nm; 3D-MP-SIM: 122.08 ± 2.86 nm, 283.68 ± 2.38 nm. j, MIP of the outer mitochondrial membrane in a fixed COS-7 cell imaged using 3D-MP-SIM. The inset highlighted by the dashed box shows the x–y cross-section at z = 0.68 µm. Scale bar, 5 µm. k–m, Magnified y–z (k), x–z (l) and y–z (m) cross-sections along the dashed lines in j to compare the five imaging modes, with white arrowheads indicating the differences. Scale bars, 1 µm. In e and i, the resolution data are presented as the mean ± s.d. Whiskers: 75% and 25%; centre line: median. All cross-section slices are 30 nm thick.
Source data
Achieved resolution comparable to 3D-SIM in fixed samples
To demonstrate the capabilities of 3D-MP-SIM in biological samples, we imaged immunolabelled microtubules in fixed U2OS cells (Fig. 2f and Supplementary Video 1). We found that 3D-MP-SIM excelled in resolving two axially separated microtubules, matching the performance of conventional 3D-SIM. By contrast, these fine axial details were not discernible when using 2D-MP-SIM and slice MF-SIM; however, the widefield mode failed to resolve the microtubules both axially and laterally (Fig. 2g,h). Compared with that of both 2D-MP-SIM and slice MF-SIM, the axial resolution of 3D-MP-SIM was consistent with the measurements obtained from fluorescent beads (Fig. 2i, Supplementary Figs. 12 and 13 and Supplementary Table 1). The result is consistent with the FWHM measurements in both the lateral and axial directions (Extended Data Fig. 2b and Supplementary Table 2), confirming the doubled axial resolution of 3D-MP-SIM in biological samples.
Subsequently, we assessed the performance of 3D-MP-SIM by imaging the outer membrane of mitochondria in fixed COS-7 cells (Fig. 2j and Supplementary Video 2). Similar to 3D-SIM, 3D-MP-SIM successfully delineated the outer membrane structures both laterally and axially. By contrast, 2D-MP-SIM and slice MF-SIM failed to capture these intricate details due to their inadequate axial resolution (Fig. 2k–m). Furthermore, the hollow structure of the outer mitochondrial membrane was entirely obscured when observed using widefield microscopy.
Enhancing dynamic imaging with reduced motion artefacts
The reconstruction of SIM images requires that the sample remains stationary during image acquisition. However, movements of the subcellular structure in live cells may lead to motion artefacts7, especially for 3D-SIM, which requires an extended imaging period for a single volume. Using the fluorescent protein mStayGold-Rab9a as a label we imaged late endosomes (Fig. 3a and Supplementary Video 3), which move at speeds ranging from 0.2 to 0.5 µm s−1 (ref. 27). The late endosome appeared elongated into a linear structure along the axial cross-sections in the 3D-SIM images, indicating substantial motion artefacts when imaging dynamic structures with 3D-SIM. By contrast, 3D-MP-SIM maintained the contour structures and demonstrated minimal effects of motion artefacts at similar speeds (Fig. 3b,c). These findings, corroborated by our simulations (Supplementary Fig. 14), showed the effectiveness of 3D-MP-SIM in reducing motion artefacts while imaging fast-moving cellular objects.

a, Average intensity projection of late endosomes in live COS-7 cells imaged using 3D-SIM and 3D-MP-SIM. Scale bar, 5 µm. b,c, Magnified x–y and y–z cross-sections at the indicated time points (for the boxed regions in a), demonstrating the late endosomes at similar movement speeds (approximately 0.5 μm s−1) and highlighting the reduced motion artefacts for 3D-MP-SIM (c) with respect to 3D-SIM (b). Scale bars, 1 µm. d, MIP of the outer mitochondrial membrane in live COS-7 cells imaged using 3D-MP-SIM (left), along with the magnified x–y views of the region highlighted by the yellow dashed box at the indicated time points (right). Scale bars, 5 µm. e, Magnified x–y and y–z cross-sections along the dashed line marked of the x–y view at the indicated time points (for the region highlighted by the white dashed box in d); the white arrowheads point to a fission process completed at 11.78 s, and the yellow arrowheads point to a fusion process occurring at 14.26 s. Scale bars, 1 µm. f, Magnified x–y and y–z cross-sections along the line indicated by the two arrows in the x–y view, for the region highlighted by the white dashed box in d, at the indicated time points, showing the fission process in mitochondrial nanotunnels, with invagination occurring at 18.91 s and fission completing at 19.22 s. White arrowheads indicate the tip and fission of mitochondrial nanotunnel. Scale bars, 1 µm. g, MIP of the ER in live COS-7 cells imaged using 3D-MP-SIM. Scale bar, 5 µm. h, Magnified x–y and x–z cross-sections along the line indicated by the two arrows in the x–y view at the indicated time points (for the region highlighted by the dashed box in g). The white arrowheads in the x–z cross-sections highlight the ER dynamics: extension across a tubular ER at 3.82 s, fusion with another ER tubule at 4.82 s, further extension from the lower part of the fusion point at 4.91 s and contraction at 5.82 s. Scale bars, 1 µm. i, Magnified x–y and y–z cross-sections along the extension ER indicated by the dashed line in the x–y view at the indicated time points (for the region highlighted by the dashed box in g), showing the rapid merging of the two sheet-like ER structures into one. The white arrowheads highlight the corresponding events in the y–z views. Scale bars, 1 µm. All cross-section slices are 30 nm thick.
Next, we examined the dynamics of the outer mitochondrial membrane in COS-7 cells labelled with TOM20-StayGold (Fig. 3d and Supplementary Video 4). Using 3D-MP-SIM, we resolved mitochondrial fission process in three dimensions. Upon stimulation with propofol, which can induce mitochondrial fission28, we observed the dynamics of two invagination sites on a single mitochondrion. One fission process was completed and shown by the complete 3D separation of two vesicular structures; however, the other reconnected to form a hollow structure within one second (Fig. 3e). In addition, we documented the fission process previously reported for mitochondrial nanotunnels29. With enhanced spatio-temporal resolution, we were able to distinctly monitor the progression of mitochondrial nanotunnel division, including the invagination dynamics (Fig. 3f).
To further push the limit of capturing rapid events in three dimensions, we used a 1 ms exposure time, which resulted in 11 volumes per second. This enhanced imaging speed enabled observation of the rapid dynamics of ER extension (Fig. 3g and Supplementary Video 5). We noted that the ER tubules extended swiftly across one tubular ER in the axial direction, fused with another tubule ER and ultimately contracted from a lower position to complete one mesh of the ER network (Fig. 3h). We also observed two independent ER sheets distributed at different axial positions connected by a single tubular ER, which subsequently fused rapidly into a cohesive structure (Fig. 3i).
Dual-colour 3D-MP-SIM for visualizing organelle interactions
For dual-colour 3D-SIM imaging, fluorescent probes with different spectra and illumination wavelengths (for example, 488 and 560 nm) must be used. Either alternating different wavelengths first or adjusting the axial plane to acquire a one-colour volumetric dataset first of all presents shortcomings. Alternating different excitation wavelengths increases the time required for acquiring one single volume, potentially leading to more motion artefacts. Conversely, acquiring a volumetric dataset for one colour before collecting the other channel introduces an interval of several seconds between the two colours, which may prevent dynamic interactions between two organelles from being resolved. Benefiting from its rapid volumetric imaging capability, 3D-MP-SIM may enable a more accurate recording of the organelle interactions. A filter wheel was placed in front of the ISP, enabling sequential switching between filters for different emission wavelengths (Fig. 1d), while the excitation wavelengths were synchronously controlled via the acoustic-optical tunable filter. In addition, the reconstruction model of 3D-MP-SIM does not require aligning the maximum stripe modulation position of the axial interference pattern with the image plane for different colours, as is necessary with conventional 3D-SIM. This eliminates the need to position different cameras on corresponding planes30.
To demonstrate this capability, we labelled the mitochondria in live COS-7 cells with both TOM20-mStayGold and the mitochondrial probe PKmito Orange (Fig. 4a and Supplementary Video 6). Using dual-colour 3D-MP-SIM, the dynamics of both the outer and inner mitochondrial membranes were effectively monitored at a rate of 1.5 volumes per second across two channels. This enabled observation of the rapid dynamics of the mitochondrial cristae in axial cross-sections along with the outer membrane (Fig. 4b). In addition, we observed a mitochondrial nanotunnel extending another nanotunnel from its existing structure, creating a branched network that rapidly interacted with other mitochondria before retracting (Fig. 4c). This process could enhance mitochondrial communication by linking multiple mitochondria through interconnected nanotunnels31.
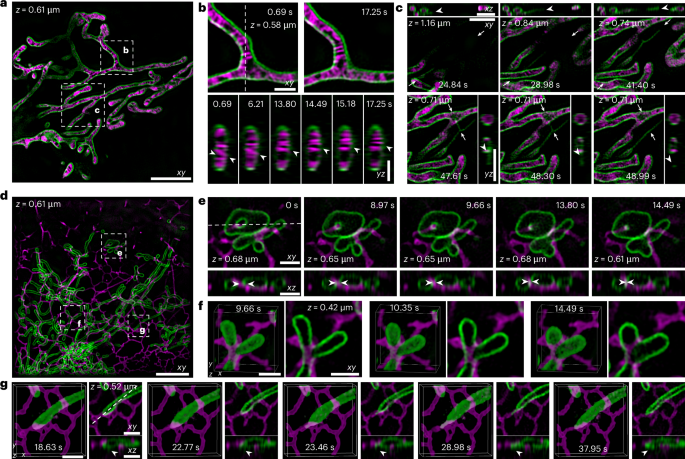
a, Dual-colour image (x–y cross-section) of the inner (PKmito Orange, magenta) and outer membranes (TOM20-mStayGold, green) of mitochondria in a live COS-7 cell, where the axial depth is 0.61 μm. Scale bar, 5 µm. b, Top: magnified x–y cross-sections at the indicated time points (for the region highlighted by the dashed box in a); the axial depth is 0.58 μm. These show the cristae dynamics in the lateral plane. Bottom: magnified y–z cross-sections (along the dashed line shown in the x–y view) at the indicated time points, showing the cristae dynamics in the axial plane. White arrowheads indicate dynamics in the inner mitochondrial membrane. Scale bars, 1 µm. c, Magnified x–y (main images) and the corresponding x–z and y–z cross-sections (smaller images) along the line indicated by two the arrows in the corresponding x–y view at the indicated time points (for the region highlighted by the dashed box in a), where the axial depth ranges from 0.71 to 1.16 μm. These show the mitochondrial nanotunnel extending from its existing structure at 41.40 s and retracting at 48.99 s, with white arrowheads indicating the tip of mitochondrial nanotunnel. Scale bars, 2 µm. d, Dual-colour image (x–y cross-section) of the outer mitochondrial membrane (TOM20-mStayGold, green) and the ER (HaloTag-Sec61β, magenta) in a live COS-7 cell, there the axial depth is 0.61 μm. Scale bar, 5 µm. e, Magnified x–y (top) and corresponding x–z (bottom) cross-sections along the dashed line in the x–y view at the indicated time points (for the region highlighted by the dashed box in d), where the axial depth ranges from 0.61 to 0.68 μm. White arrowheads indicate the contact sites and the coordinated motion of the ER and mitochondria. These show the ER extending through the central hole of the doughnut-shaped mitochondrion. Scale bars, 1 µm. f, Magnified 3D views and x–y cross-sections at the indicated time points (for the region highlighted by the dashed box in d), where the axial depth is 0.42 μm. These show that the ER wraps around the mitochondrial branch junctions. Scale bars, 1 µm. g, Magnified 3D views together with the x–y and corresponding x–z cross-sections obtained along the dashed line of the x–y view at the indicated time points (for the region highlighted by the dashed box in d), where the axial depth is 0.52 μm. These show interactions with the ER during sprouting, elongation, stabilization and retraction of the mitochondrial nanotunnels, and white arrowheads indicate the dynamics of mitochondrial nanotunnle surrounded by ER. Scale bars, 1 µm. All cross-section slices are 32.3 nm thick.
Next, we imaged mitochondria and the ER in live COS-7 cells. Mitochondria were labelled with TOM20-mStayGold, whereas the ER was labelled using HaloTag-Sec61β in combination with the live-cell-compatible organic dye BD566HTL (ref. 32) (Fig. 4d and Supplementary Video 7). We observed contact of the tubular ER with the doughnut-shaped mitochondrion, with the tubular ER extending through the central hole of the invaginated outer membrane of the mitochondrion, where the central hole of the invaginated mitochondrial outer membrane is gradually shrinking (Fig. 4e). In addition, the mitochondria formed branched networks to carry out cellular functions, with the ER wrapping around the mitochondrial branch junctions (Fig. 4f). Moreover, we observed interactions between the ER and the mitochondrial tip. As the mitochondrion shrank, a mitochondrial nanotunnel rapidly sprouted and elongated approximately 500 nm at the interaction site between the ER and mitochondrion. This nanotunnel quickly retracted and fused back into the mitochondrial body when the mitochondrion returned to its original position (Fig. 4g). This detailed visualization highlighted the dynamic interplay between the mitochondrion and the ER in three dimensions, emphasizing their role in maintaining the cellular structure and function.
Discussion
We have introduced 3D-MP-SIM, which achieves fast, 3D, live-cell super-resolution imaging. This achievement relies on a customized ISP to separate the fluorescence signals from eight equidistant object planes to different regions of the camera and utilizes an optical delay line to facilitate an axial phase shift. 3D-MP-SIM also integrates synergistically evolved reconstruction algorithms based on a new physical model, different from that of conventional SIM, which can separate the overlapped axial high-frequency spectrum and reassemble the spectrum bands both laterally and axially. Comprehensive experiments have demonstrated that 3D-MP-SIM substantially reduced motion artefacts while imaging fast dynamics and interactions in live cells and maintained an enhanced resolution in both the lateral and axial dimensions.
Although 3D-MP-SIM can capture sections with a thickness of 1.55 μm at various depths within a sample, imaging cells that are thicker than 1.55 μm can be problematic due to this thickness limitation. To address this limitation, we can develop new ISP units that are capable of effectively separating fluorescent light into more distinct regions (for example, 16 segments). However, the image quality declines when the Strehl ratio drops below 0.8 as the image plane shifts 1 μm away from the nominal plane (Supplementary Fig. 15) for an oil-immersion objective lens (×60/1.42 numerical aperture (NA)). Therefore, further refinement of ISP or multifocus diffraction gratings that can correct spherical and higher-order aberrations will be essential to this approach. An alternative strategy involves integrating the axial movement of the sample via a piezo stage into the imaging process, facilitating the sequential imaging of multiple ‘eight plane’ units that can be reconstructed into a volume (Extended Data Fig. 3). Implementing this strategy requires a key constraint to be identified: the distance of the axial movement should be an integer multiple of both the interplane distance and the axial pattern period (Supplementary Note 7). We further demonstrate the technique’s performance on microtubules and the mitochondrial outer membrane in COS-7 cells. To minimize spherical aberrations caused by the refractive index mismatch between the immersion medium and aqueous-mounted cell samples of different eight-plane stacks, we replaced the objective lens with a water-immersion objective (×60/1.27 NA). This procedure enabled the concatenation of three image stacks and facilitated the reconstruction of a 4.26-μm-thick sample (Extended Data Fig. 4), and potentially even further, by taking more axial steps. Under the imaging conditions of a water-immersion objective lens, the imaging depth can be further extended by increasing the interplane distance while maintaining the Strehl ratio at higher than 0.8, achieving a thickness of 1.96 μm with eight-plane imaging (Supplementary Fig. 16).
The axial phase shift was achieved using an optical delay line with a piezo stage. However, owing to the axial magnification of the system, which is the square of the lateral magnification, the delay stage required mechanical movement over distances of tens of micrometres, taking approximately 5 ms per movement. An alternative strategy involved modifying the phase of the zero-order beam, which only required adjusting the optical path-length difference at the wavelength scale (Extended Data Fig. 5). We demonstrated this method using a pure-phase liquid crystal on silicon (or LCOS) high-speed spatial light modulator (HS-SLM) (Extended Data Fig. 6), which could shift a π/2 phase of the zero-order beam within 1 ms. As a result, the imaging speed was improved to 14 volumes per second (Extended Data Fig. 7).
Acquiring a single 3D-MP-SIM frame requires an approximately eightfold higher illumination power to achieve an equivalent signal-to-noise ratio and reconstruction quality to conventional 3D-SIM. Consequently, the overall light dose for imaging the same volume is comparable to that of conventional 3D-SIM, with an approximate 5% light loss attributed to the ISP. Whereas the main contribution of this work was on the optical design and the development of physical-model-based algorithms for 3D-MP-SIM, we expected that 3D-MP-SIM could benefit from algorithmic improvements to provide further advancements in the light dosage. For example, implementing regularization techniques that leverage previous knowledge, such as Hessian matrices7, sparse deconvolution10 or deep-learning-based methods33,34,35,36, can effectively reduce the exposure times and improve the imaging speed. In addition, further enhancing the reconstruction algorithm with high condition numbers can effectively decrease the limit of the required raw datasets from 30 to 21 via its reduction to seven phases per orientation. By integrating these algorithmic enhancements into 3D-MP-SIM, we can substantially improve its performance, enabling faster imaging speeds and longer imaging durations. This progress facilitates new possibilities for conducting detailed and comprehensive studies on 3D super-resolution imaging and live-cell dynamics, further expanding the capabilities of 3D-MP-SIM in biological research and beyond.
Methods
Custom-built 3D-MP-SIM and 3D-SIM systems
Our 3D-MP-SIM optical layout was based on previous designs12,14,15. In the illumination optical path, excitation light beams from a 488 nm laser (Genesis MX488-1000 STM, Coherent) and a 560 nm laser (2RU-VFL-P-2000-560-B1R, MPB Communications) were coupled into a polarization-maintaining single-mode fibre (PM-S405-XP, Connet Laser Technology) via an acoustic-optical tunable filter (AOTFnC-400.650-TN, AA Opto-Electronic), which functioned as both a fast shutter and a power adjustor. The diverging beam from the output end of the polarization-maintaining single-mode fibre was collimated using an objective lens (CFI Plan Apochromat Lambda ×2/0.10 NA, Nikon) and subsequently directed to a phase-diffraction grating module composed of a polarizing beamsplitter (CCM1-PBS251, Thorlabs), a half-wave plate (GCL-060812, Daheng New Epoch Technology) and a ferroelectric SLM (QXGA-3DM, Fourth Dimension Displays). A custom mask was placed at the focal plane of the achromatic lens L1 (focal length (f) = 400 mm; ACT508-400-A, Thorlabs) to block any undesired diffraction orders except for the orders 0 and ±1. An axial phase shift module was added around the conjugate plane of the SLM following L2 (f = 100 mm; AC254-100-A, Thorlabs); this included a right-angle prism (MRA25L-E02, Thorlabs) and a retroreflecting hollow roof prism mirror (HRS1015-P01, Thorlabs) mounted on a piezo stage (P66.X60, Core Tomorrow), with a settling time of approximately 5 ms over its full motion range of 55 µm. Bidirectional movements of the piezo stage adjusted the mirror’s position, altering the optical path length and consequently changing the axial phase of the structured illumination patterns on the samples (Supplementary Note 2). An additional 4f relay system consisting of lenses L3 (f = 100 mm; AC254-100-A, Thorlabs) and L4 (f = 250 mm; ACT508-250-A, Thorlabs) was used to adjust the system magnification to enable the desired changes in the axial phase shifts within the operational range of the piezo stage. An HS-LCVR (HLC-200-VIS, Meadowlark), used alongside a quarter-wave plate (AQWP05M-600, Thorlabs), rotated the polarization direction of the linear polarization illumination light to perpendicular to the plane of incidence. This configuration maximized the modulation contrast of the illumination at the submillisecond level. Each beam was focused with L5 (f = 200 mm; ITL200, Thorlabs) and reflected using a custom dichroic mirror (ZT405/488/561/640-phaseR, Chroma) onto the back focal plane of the objective lens. Both oil- and water-immersion objectives (CFI Plan Apochromat Lambda D ×60/1.42 NA Oil, Nikon; CFI SR Plan Apo IR ×60/1.27 NA WI, Nikon) were used for different conditions. The water-immersion objective lens was used to minimize spherical aberrations when imaging thicker samples mounted in an aqueous medium by axially moving through different eight-plane stacks and combining them for reconstruction (Extended Data Figs. 3 and 4) or for a larger interplane distance while maintaining a Strehl ratio greater than 0.8 (Supplementary Fig. 16). For both the oil- and water-immersion objective lenses, the interplane distance was selected with all planes exhibiting a Strehl ratio greater than 0.8. Finally, the beams interacted and interfered at the sample plane to create the desired illumination pattern.
To shift the axial phase of the illumination patterns, we also designed an alternative optical system that utilizes a pure-phase HS-SLM (HSP1K-488-850-PC8, Meadowlark) for modulating the zero-order phase (Extended Data Fig. 6). This system was integrated into the aforementioned set-up via a rotatable mirror (KSHM 90-RE-MDS, OWIS), which can be switched between positions 1 and 2. In position 1, the system operates along the original illumination path, relying on a piezo stage to adjust the axial phase of the illumination patterns. In position 2, it switches to a new illumination path that includes the pure-phase HS-SLM. In the redesigned illumination optical path, both the laser coupling and collimation module, and the pattern generation module, remain consistent with the previous optical path design, except that the collimating lens has been replaced with a different objective lens (PLN10X, Evident). The HS-SLM was strategically positioned at the focal plane of an achromatic lens (L9, f = 250 mm; ACT508-250-A, Thorlabs) to modulate the zero-order phase, with the specific pattern applied to the HS-SLM highlighted via the green region. A custom 96° prism (leg-coated 96° prism mirrors, Suzhou Mudu Jiante Machinery Factory) was introduced to achieve a slight incident angle (approximately 6°) onto the HS-SLM. Following this, the light was directed through a set of relay lenses (L10 and L11, f = 300 mm; ACT508-300-A, Thorlabs). A custom mask was placed at the focal plane of lens L11 to block any undesired diffraction orders resulting from the pixelation of both SLM2 and HS-SLM, allowing only orders 0 and ±1 to pass. Finally, the light was directed back into the original optical path via the rotatable mirror.
The emitted fluorescence was collected and then passed through the dichroic mirror. After exiting the microscope body (Ti2-E, Nikon) via an internal tube lens, the fluorescence was regulated by a field stop positioned at the intermediate image plane to control the field-of-view size and minimize signal overlap between the adjacent images. Subsequently, lenses L7 (f = 100 mm; AC508-100-A, Thorlabs) and L8 (f = 180 mm; AC508-180-A, Thorlabs) were positioned in a 4f configuration to ensure uniform magnification. Ultimately, a custom ISP (ASM19005A, OYEAH Optronics) split the fluorescence nearly equally, projecting the sample’s focus at evenly spaced depths along the axial direction onto different regions of two scientific complementary metal–oxide–semiconductor (sCMOS) cameras (Camera1 and Camera2; Flash 4.0 V3, Hamamatsu). For dual-colour imaging, a filter wheel (OptoSpin25, Cairn Research) equipped with filters F1 (ET525/50m, Chroma) and F2 (ET600/50m, Chroma) was positioned between L7 and L8.
The ISP was based on a previous design15. The interplane distance between consecutive axial planes in the object space was determined via (frac{d}{n_{{mathrm{r}}}{{M}_{{mathrm{a}}}}^{2}}) equal to 193.8 nm, where d = 3.30 mm is the path difference of each image, nr = 1.46 refers to the refractive index of the prism and Ma = 1082 represents the axial magnification. Experimentally, the interplane distance was estimated to be 196.7 ± 22.7 nm (mean ± s.d., n = 291 for seven interplane distances, from six independent experiments). This measurement was obtained by scanning fluorescent beads attached to a coverslip along the z axis in 100 nm steps with the water-immersion objective (CFI SR Plan Apo IR ×60/1.27 NA WI). This interplane distance can also be adjusted by modifying the magnification. For instance, at an axial magnification of 962, the z spacing changes to 245.3 nm (Supplementary Fig. 16).
Both 2D-MP-SIM and slice MF-SIM were performed using the same system but with slightly different operations. In 2D-MP-SIM, the order zero beam was blocked, and nine multiplane images with three directions and three phases were collected under illumination conditions similar to those used for 2D-SIM. For slice MF-SIM, the first 15 volume images from 3D-MP-SIM were used for reconstruction plane by plane.
For the 3D-SIM detection path, we used the right port of the microscope body for imaging. The samples were moved using a z-axis piezo stage (NanoScan SP600, Queensgate) with a step size of 111 nm, effectively corresponding to 92.5 nm due to the refractive index mismatch between oil and water23. A total of 15 images (five phases × three orientations) was captured for each plane with the sCMOS cameras (Flash 4.0 V3).
Hardware control
The 3D-MP-SIM acquisition system was built using an NI PXIe-1071 chassis with an NI PXIe-7851R FPGA module (both from National Instruments), with programming performed in LabVIEW37 to ensure precise timing and instrument control. The timing diagram for the system is shown in Supplementary Fig. 4. The key system components included the internal sCMOS camera acquisition card, SLM control card, acoustic-optical tunable filter control card, HS-LCVR control card and piezo stage control card; these were synchronized according to a predefined scheme. The prepared running order with the desired pattern of the SLM and its ‘LED_EN’ TTL (transistor–transistor logic) output signal acted as the main trigger, initiating two sCMOS cameras in global reset mode. When all lines of the sensor were simultaneously exposed, the sCMOS camera then triggered the acoustic-optical tunable filter to activate the laser via its global exposure output. The HS-LCVR voltage was adjusted to a preset value after detecting five falling edges of the SLM TTL output. Upon detecting 15 falling edges, the axial phase shift piezo stage was adjusted by a predefined distance (Supplementary Note 2).
The image acquisition for 3D-SIM adhered to the principles of conventional 3D-SIM, with a notable difference in the final step for 3D-MP-SIM. Once the falling edge count reached 15, the sample z stage shifted to the next focal plane by a predefined step size.
Evaluating the effect of aberrations on the Strehl ratio using Zemax OpticStudio simulations
To evaluate the effect of spherical and higher aberrations on the Strehl ratio, we utilized Zemax OpticStudio38 to simulate our detection system (Supplementary Fig. 15). In the empirical study, we fine-tuned the refractive index of the immersion oil in conjunction with a high-precision imaging dish (µ-Dishes, ibidi; catalogue number 81158) to minimize spherical aberration at the mid-plane between the fourth and fifth planes, typically considered the nominal focal plane. Similarly, for the simulation process, these adjustments were made by modifying the correction collar of the objective. As for the ISP, we replaced it with a glass block of specific thickness that corresponded precisely to the sample depth (for example, the sample at the fifth plane corresponds to a glass block with a thickness of 106.49 mm, and the sample at the eighth plane corresponds to a glass block with a thickness of 96.52 mm). Moreover, owing to the lack of a Zemax model for the actual objective (that is, CFI Plan Apochromat Lambda D ×60/1.42 NA Oil), we used a ×60/1.49 NA oil objective39,40 for simulation. This substitution had no impact on the performance, as we control the NA of detection by adjusting the range of the receiving cone angle. We tested the reduction in the Strehl ratio as the focal plane deviates from the nominal focal plane under two different detection NA conditions: a maximum theoretical NA of 1.333 for CFI Plan Apochromat Lambda D ×60/1.42 NA Oil and a maximum theoretical NA of 1.27 for CFI SR Plan Apo IR ×60/1.27 NA WI (Supplementary Fig. 15b–i).
At the maximum theoretical NA of 1.333 for the 1.42 NA oil-immersion lens, the Strehl ratio remains relatively high, exceeding 0.8 among eight planes (Supplementary Fig. 15b,c,f,h), demonstrating the good imaging performance of our current optical design. We also simulated the maximum theoretical NA of 1.27 for the water-immersion lens. The Strehl ratio reached 0.833 at the centre and 0.808 at the edge of the field, at a focal plane 1 µm away from the nominal focal plane (Supplementary Fig. 15d,e,g,i). This indicates that our system is suitable for imaging samples up to 2 µm thick with a 1.27 NA water-immersion lens.
Image processing and statistical analysis/data analysis and visualization
Data analysis was performed using custom code written in Python41 and MATLAB42. The super-resolution images reconstructed by 3D-MP-SIM had a pixel size of 30.1 nm in the lateral section and 96.9 nm in the z direction. To facilitate visualization, we used bilinear interpolation in Fiji43 (National Institutes of Health) to interpolate the images from 3D-MP-SIM, 3D-SIM and all other methods to achieve an isotropic voxel size of 30 nm in all three dimensions in single-colour mode, and axial pixel size of 32.3 nm for dual-colour mode. Imaris44 was used for 3D rendering and visualization.
Resolution estimation using image decorrelation analysis
The resolution values were quantified using decorrelation analysis by identifying the highest spatial frequency with a sufficient signal-to-noise ratio from the local maxima across multiple decorrelation functions25. Given the sensitivity of the decorrelation analysis to Fourier space manipulations, careful considerations are essential to prevent biases in resolution estimation, as highlighted in the original paper25. Following these guidelines, we made some modifications to our reconstruction algorithm for resolution estimation. First, we removed all masks applied to different unmixed Fourier components, except for the zero-order component at the centre, as masking it does not create an edge in SIM modes. Second, we expanded the edge of the apodization filter to the boundary of the Fourier domain. Third, we retained the negative value in the reconstruction result. With the suggested pipeline, we estimated the lateral resolution of 100-nm-diameter fluorescent beads (Supplementary Fig. 10) and microtubules (Supplementary Fig. 12) using widefield microscopy and four SIM modes using decorrelation analysis (Supplementary Table 1).
To estimate the axial resolution, we applied the sectorial resolution estimation procedure with two modifications. First, we randomly concatenated multiple y–z cross-sectional images in the axial direction to expand axial planes as the axial planes of our images (for example, only 8 or 16 planes) far away from the suggested 256 × 256 pixels25. To enhance the axial planes, we randomly positioned different cross-sections in the final image, applying four-pixel repeat padding and apodized the edges of all of the cross-sections with a cosine function on the four repeat pixels at each end25. Second, we laterally shifted the widefield frequency spectrum to align the highest axial frequency with the kz axis (Supplementary Fig. 11a), as the axial resolution depended on the maximum recoverable spatial frequencies. This adjustment helped to resolve the estimation bias associated with both spectral leakage and the ‘missing cone problem’, eliminating the need for a window function. This issue also arises in 2D-MP-SIM imaging, and to ensure a fair comparison we applied this adjustment to 2D-MP-SIM and slice MF-SIM as well. For the 3D-SIM and 3D-MP-SIM imaging modes, with the application of four-pixel repeat padding and apodization of all the cross-sections with a cosine function, we did not observe spectral leakage that could influence the resolution. Therefore, we can estimate the axial resolution of 100 nm fluorescent beads (Supplementary Fig. 11) and microtubules (Supplementary Fig. 13) in widefield microscopy and four SIM modes using decorrelation analysis.
Plasmids
To label late endosomes in living cells, we expressed mStayGold-Rab9a, which was constructed by replacing the eGFP gene with the mStayGold gene amplified via PCR from the plasmid pAAV-CAG-(n1)QC2-6 FIQ(c4)-P2A-FusionRed (WeKwikGene no. 0000267) in EGFP-Rab9a (a gift from Y. Liu) using Gibson assembly.
To label mitochondria, we expressed TOM20-StayGold in living cells, and co-expressed mStayGold-OMP25 and TOM20-mStayGold in fixed cells. TOM20-StayGold was constructed by replacing the mEmerald gene with the StayGold gene via PCR from the plasmid pCSII-EF/mt-(n1)StayGold (Addgene, plasmid no. 185823) in mEmerald-TOMM20-N-10 (Addgene, plasmid no. 54282) using Gibson assembly. To generate mStayGold-OMP25 and TOM20-mStayGold, we amplified mStayGold and replaced the eGFP and mEmerald genes in eGFP-OMP25 (a gift from Y. Zhang) and mEmerald-TOMM20-N-10, respectively.
To label the ER in living cells, we expressed KDEL-mStayGold, which was constructed by replacing the oxStayGold gene with the mStayGold gene in pcDNA3/er-(n2)oxStayGold(c4) (Addgene, plasmid no. 185822) using Gibson assembly.
For dual-colour imaging of the inner and outer membranes of mitochondria in living cells, we expressed TOM20-mStayGold to label the outer membrane.
For dual-colour imaging of mitochondria and the ER in living cells, we co-expressed TOM20-mStayGold and HaloTag-Sec61β, in which HaloTag-Sec61β was constructed by replacing the oxStayGold gene with the HaloTag gene via PCR from the plasmid Signal-HaloTag-FcR (a gift from B. Liu) in oxStayGold-linker-Sec61 (a gift from Y. Zhang) using Gibson assembly.
Cell culture and preparation
COS-7 and U2OS cells were cultured in high-glucose DMEM basal medium (Gibco, 21063029) supplemented with 10% fetal bovine serum (Vistech, SE100-B) and 1% penicillin and streptomycin (Gibco, 15140122). Cells were maintained at 37 °C with 5% CO2 and routinely tested for mycoplasma contamination.
The day before transfection, cells were cultured on 35 mm high-quality no. 1.5H glass coverslip bottom µ-Dishes (ibidi) incubated with collagen I (Biocoat, 354236) for 30 min until they reached 60% confluence. Plasmid DNA transfection was carried out using Lipofectamine 3000 reagent (Thermo Fisher Scientific, L3000015) with a transfection ratio of Lip3000 (1 μl), P3000 (1 μl) and plasmid DNA (1 μg) per 3.5 cm2 of growth area, according to the manufacturer’s instructions. All samples were imaged 24 h after transfection.
Live-cell imaging
To observe the trajectory of late endosomes in the cell, COS-7 cells were transfected with mStayGold-Rab9a. To observe the fission and dynamics of the mitochondria, cells were transfected with TOM20-StayGold, treated with a final concentration of 200 μM propofol (Sigma, D126608) during imaging, and observed 24 h after transfection. To capture the dynamic changes in the ER, COS-7 cells were transfected with KDEL-mStayGold. For dual-colour imaging of the outer and inner mitochondrial membranes, COS-7 cells were transfected with TOM20-mStayGold and incubated with 200 nM PKmito Orange (Genvivo, PKMO-1) at 37 °C for 20 min, followed by three washes with PBS (Gibco, C10010500BT) before imaging. For dual-colour imaging of the outer mitochondrial membranes and the ER, cells were transfected with TOM20-mStayGold and HaloTag-Sec61β for 24 h, followed by incubation with 1 μM HaloTag dye BD566HTL for 2 h at 37 °C. After labelling, cells were washed three times with PBS before imaging.
All cell culture medium was replaced with freshly prepared phenol red-free imaging buffer (DMEM/Nutrient Mixture F-12 (Gibco, 21041025) supplemented with 10% fetal bovine serum and 1 mM HEPES solution (Beyotime, C0215)) before imaging.
Fixed-cell imaging
To label the microtubules, U2OS cells were first rinsed with prewarmed PBS (2 ml), and then the medium was replaced with 0.5% Triton X-100 (1 ml) (Sigma, T8787) in PBS and incubated for 30 s at room temperature. Cells were fixed with methanol (2 ml) (Bei Jing TongGuang Fine Chemicals Company, 104028) (precooled in a refrigerator at −80 °C for at least 15 min) at −20 °C for 3 min and then washed three times with 0.1% Triton X-100 (1 ml) for 5 min each. Cells were permeabilized with 0.5% Triton X-100 (1 ml) for 10 min, followed by three washes with 0.1% Triton X-100 (1 ml) for 5 min each. The cells were blocked with 5% bovine serum albumin (1 ml) (BSA; Beyotime, ST025) for 15 min.
Cells were incubated with mouse anti-α-tubulin and anti-β-tubulin antibodies (Sigma‒Aldrich, T5168 and T5293, respectively) diluted 1:1,000 in 5% BSA overnight at 4 °C. After three washes with PBS, cells were incubated with goat anti-rat IgG H+L (Alexa Fluor 488) (Abcam, ab150157) diluted 1:1,000 in 5% BSA for 2 h at room temperature. Cells were then washed three times with PBS for 5 min each, and the cell culture was replaced with PBS for imaging.
To label the outer mitochondrial membranes, COS-7 cells were transfected with mStayGold-OMP25 and TOM20-mStayGold. Cells were fixed for 15 min at room temperature with 3% paraformaldehyde (Electron Microscopy Sciences, 15710) and 0.1% glutaraldehyde (Electron Microscopy Sciences, 16020) at 24 h after transfection, followed by three washes with PBS for 5 min each. The medium was then replaced with PBS for imaging.

Responses