Faster deployment of renewables stabilizes electricity prices in Europe
The policy problem
The volatility of energy prices is a major driver of economic fluctuations and their large associated costs. European electricity markets are based on day-ahead contracting where the price is set by the higher marginal cost of the last activated plants. In this design, fluctuations in the prices of fuels, particularly of natural gas, have large impacts on the price of electricity and make it highly volatile. Investments in solar photovoltaic (PV) and wind technologies, which do not depend on fossil fuels, could reduce the sensitivity of electricity prices to fuel prices. However, since their operation is affected by solar irradiance and wind speed, the volatility caused by weather factors would increase. Additional penetration of these technologies is widely expected given their decreased costs and it is required to achieve the European Union (EU) decarbonization goals. Understanding whether this will increase the volatility of power prices or stabilize them, and the magnitude of such changes, is important to anticipate macroeconomic volatility and manage it.
The findings
We define and estimate the (beta)-sensitivity metric, the increase in the annual average price of electricity when the price of natural gas increases by 1 euro per MWh. Achieving the 2030 capacities foreseen in system operators’ resource adequacy assessments in all EU countries, the UK and Switzerland would reduce the average European (beta)-sensitivity from 1.4 to 1.0 in 2030 (Fig. 1). Deploying solar PV and wind 30% above the targets would further reduce it to 0.5, while volatility and price spikes would also be less intense. There is substantial heterogeneity across countries. The mechanisms that stabilize prices also result in lower revenues for renewable plants, limiting the potential market-based penetration of these technologies. Private agents are unlikely to account for the societal value of lower macroeconomic volatility. Energy planning, market design, and support policies in Europe should consider this ‘insurance value’ of renewables explicitly, in addition to their benefits for climate mitigation.
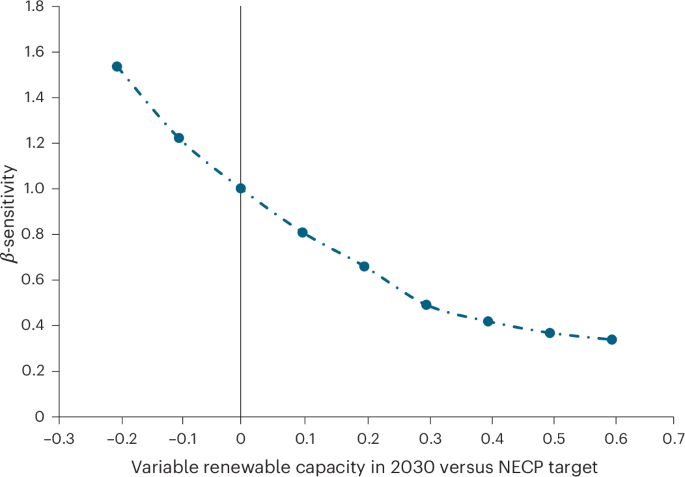
The figure represents the relationship between β-sensitivity of electricity prices and renewable capacity by 2030. The vertical axis represents the European average β-sensitivity, which measures the expected increase in the annual price of electricity when the price of natural gas increases by 1 euro. The horizontal axis represents the percent over or under achievement of the indicative targets for wind and solar PV capacity in the National Energy and Climate Plans (NECPs) of all Member States (plus European Resource Adequacy Assessment forecasts for the UK and Switzerland). For example, 0.2 means that the simulated variable renewable capacity is 20% higher in each country than envisioned in the NECP targets. Figure adapted from Navia Simon, D. & Anadon, L. D. Nat. Energy https://doi.org/10.1038/s41560-025-01704-0 (2025) under a Creative Commons licence CC BY 4.0.
The study
We use a detailed model to simulate price outcomes of European electricity markets at high resolution, given power capacities for each technology and fuel prices and considering factors like the interconnection capabilities across countries, the availability of hydro generation, solar and wind capacity factors. We simulate electricity prices for random scenarios that reflect the historical variation in fuel prices, electricity demand and weather-related conditions. We construct the distribution of these simulated annual prices for the indicative 2030 capacity targets of the 27 EU countries, plus the UK and Switzerland, and compare it with the price distribution resulting from current capacities. We also simulate faster deployment of solar PV and wind technologies, beyond 2030 plans.

Responses