Feature versus object in interpreting working memory capacity

Introduction
Working memory (WM) refers to a system with limited capacity that temporarily stores and manipulates information1,2. Luck and Vogel3 investigated the storage capacity of visual working memory (VWM) for single features (e.g., color or orientation) and combinations of features. Their results suggest no significant difference in WM capacity between simple items with a single feature and complex items with multiple features. Some claims suggest that WM performance depends on the number of objects to be retained rather than the number of features per object3,4. This is crucial for theories like the slot model3,5 and the concept of a “magical number” of chunks in WM6,7. These theories assume that integrated objects form the units of WM8. This framework has exerted a considerable influence on studies of development and aging9,10, the effects of training working memory11,12, and brain disorders13,14.
However, subsequent research introduced a competing perspective suggesting that object complexity or the number of features to remember significantly affects WM task performance15,16,17. For example, Oberauer et al.16 explored WM capacity using a single-item probe change detection paradigm. Their study contradicted previous findings supporting the object-based view4,18,19,20,21,22 and suggested that increasing the number of features per object impacted WM capacity, challenging the notion that WM capacity is solely determined by the number of objects.
Delvenne et al.23 conducted four experiments to assess the capacity of Visual Short-Term Memory (VSTM) in storing features. Experiment 1 A and 1B fail to replicate Luck and Vogel3’s findings and suggest that features from the same dimension (squares are defined by two colors) do not benefit from object-based encoding, leading to competition for limited memory resources. Experiment 2 A demonstrated that when two different features (shape and texture) are co-located within the same contour, they can be stored as a whole in VSTM. Experiment 2B indicated that when features come from different dimensions, they are stored in relatively independent storage systems, which are not completely independent of each other, exhibiting some degree of interference. The study concludes that WM encompasses both object-based and feature-based storage units.
While the findings of the above studies individually support their respective theoretical models, there are commonly observed deficiencies in these findings to date.
First, previous studies have manipulated simple and complex items by comparing different categories of experimental materials. For instance, Luria et al.24 presented subjects with colored squares (in the simple condition) and random polygons (in the complex condition). Similarly, Li et al.’s study25 compared performance on WM tasks using different experimental materials, including facial emojis, simple shapes, human faces as stimuli. Alternatively, some studies have compared objects containing varying quantities of different features. For example, the objects used by Oberauer et al.16 consisted of six features: color, size, orientation, shape, frequency, and thickness.
However, visual-spatial WM can be segregated into two separate subsystems: one supporting memory for stimulus appearance and the other for spatial location26,27. Appearance WM processes and stores information such as color, shape, size, while spatial location WM processes and retains location and direction information. Therefore, it is unreasonable to compare WM capacity between different items from these separate separate subsystems.
Wheeler and Treisman28 proposed a model arguing that features from different dimensions were stored in parallel in their dimension-specific caches, within which features competed for a resource with limited capacity but between which there was no competition. Based on this model, it can be inferred that WM capacity would decline when one specific feature of the memory item is much more complex or when multiple features are stored in the same cache. It has been demonstrated that the capacity of WM is limited by the quantity of features when the features are of the same dimension28,29,30. Therefore, to eliminate the mixed influence of feature dimensions and feature quantity on WM capacity, it has been suggested that the complexity should be manipulated within the same feature dimension. This study employed experimental materials consisting of different numbers of lines, with complexity assessed by overlaying different numbers of lines, thereby quantifying complexity levels (Fig. 1B).

A Sample memory items in simple and complex conditions. The dotted lines were included for better illustration. They were not presented to participants on the experimental monitor. B Samples for experiment materials. There were four items in each sample.
Second, according to the resource model theory, WM capacity is influenced by the complexity of the stimuli. In simpler conditions, with fewer resources required for each object, WM capacity is larger. Conversely, in complex conditions, with each object demanding more resources, WM capacity is smaller. Thus, WM capacity is variable. However, most studies have found that WM capacity is around four items3,31,32. Few studies have reported WM capacity exceeding four items, possibly because the complexity of the objects used in existing studies was not sufficiently low. While previous research mostly demonstrated decreased WM capacity with increased complexity, little attention was paid to the reverse argument: increased memory capacity for extremely simplified objects. This study employed simpler experimental materials as stimuli compared to previous studies (Fig. 1A). We hypothesize that memorizing simpler objects may lead to WM capacity exceeding “magic number 4.”
Third, despite previous research indicating that items with multiple features demand greater WM resources, there remains uncertainty about whether WM capacity is solely dependent on item complexity. If there is a linear relationship between WM capacity and the number of features (e.g. if the WM capacity for moderate items (two features) is half that of simple items (single feature)), then WM capacity is solely influenced by the features. Otherwise, WM capacity is determined by factors beyond complexity.
Building upon the current research background, this study aims to investigate how the complexity of objects influences WM capacity. Additionally, our aim is to contribute to the ongoing debate concerning whether the storage unit in WM is primarily feature-based or if it encompasses both feature-based and object-based storage units.
Results
Experiment 1
The aim of Experiment 1 was to highlight the difference in complexity between simple items (single-feature) and complex items (conjunction of three features) by employing the visual search rate as a metric. The visual search rate was used as an estimate of the visual information load33. Furthermore, we compared the complexity of the simple items in Experiment 1 with the simplest items (colored squares) from the research conducted by Alvarez and Cavanagh33 to validate whether the materials used in the current experiment were simple enough.
A repeated measures variance analysis for the visual search rate showed a significant main effect of experiment material conditions (F [2,40] = 207.528, p < 0.001, ηp² = 0.912). Bayes factors provided strong support for this effect (BF10 = 1.725e + 26). Subsequent post hoc tests revealed that the visual search rate in the complex condition was significantly higher than in the simple condition (p < 0.001, BF10 = 1.431e + 10). Additionally, the visual search rate in the colored square condition was significantly higher than in the simple condition (p < 0.001, BF10 = 87.251) (Fig. 2).
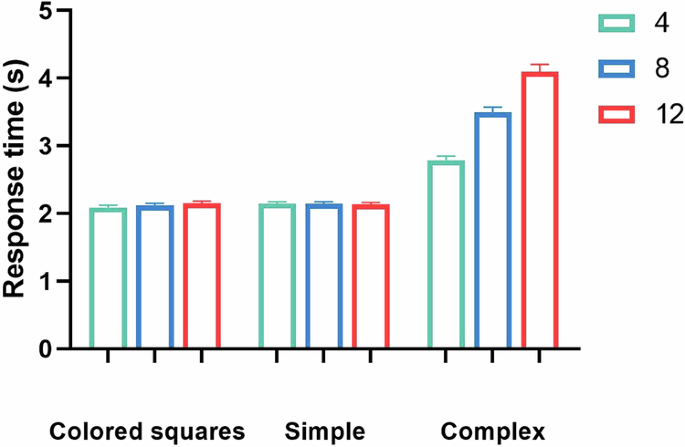
The dependent variable was the visual search rate, estimated by taking the slope of the line relating the target-presentation reaction time to the quantity of items in the search array in the correct response trials. the visual search rate in the complex condition was significantly higher than in the simple condition, and the visual search rate in the colored square condition was significantly higher than in the simple condition. Error bars indicate 95% CI, and the same is true below.
Experiment 2
Experiment 2 aimed to investigate the differences in WM capacity for items of varying complexity and to explore the maximum capacity under simple conditions.
A repeated measures variance analysis for K values revealed a significant main effect of complexity (F [1,39] = 821.349, p < 0.001, ηp² = 0.955), with K values in the simple condition being significantly higher than those in the complex condition. Bayes factors strongly supported this finding (BF10 = 1.593e + 27). There was also a significant main effect of set size (F [5, 195] = 70.100, p < 0.001, ηp² = 0.643), with strong support from Bayes factors (BF10 = 1.202e + 94). The interaction effect between complexity and set size was significant (F [5, 195] = 75.687, p < 0.001, ηp² = 0.660), strongly supported by Bayes factors (BF10 = 1.304e + 51).
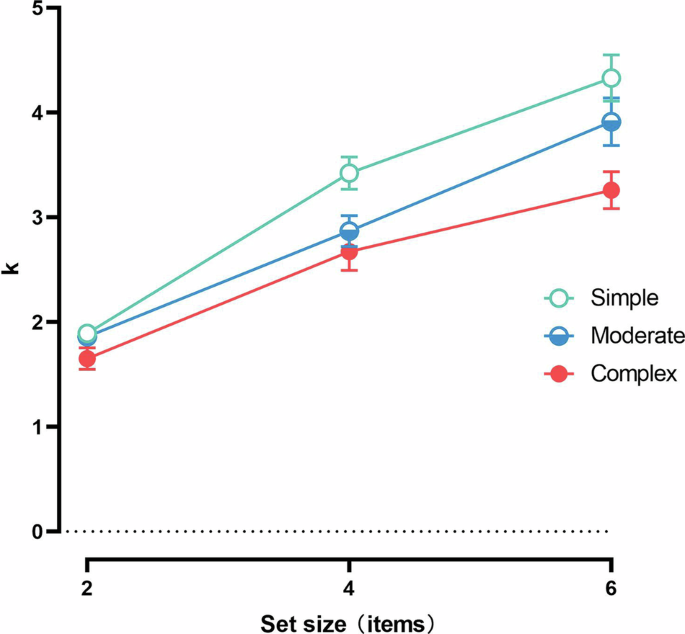
Subsequent post hoc tests revealed that, in the simple condition, K values varied significantly across different set sizes (F [5, 195] = 166.469, p < 0.001, ηp² = 0.810); pairwise comparisons were also significant (ps < 0.001), showing that K values increased with the number of items. In the complex condition, the difference between set size was not significant (F [5, 195] = 1.390, p = 0.230, ηp² = 0.034). Other post hoc tests indicated significant difference in K value between the simple and complex conditions for all set sizes (ps < 0.001) (Fig. 3).
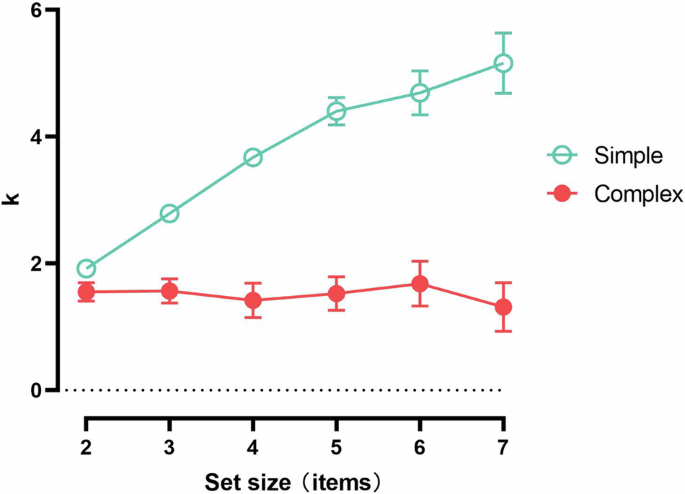
In simple condition, the K values increased with the number of items. In complex condition, the difference between set size was not significant.
Experiment 3
Experiment 3 explored whether WM capacity is determined solely by complexity. In this experiment, moderately complex items were constructed by combining two simple items. If the WM capacity for moderate items is half that for simple items, it would suggest that WM capacity is determined only by complexity. Otherwise, it implies that capacity is influenced by factors beyond complexity. The conditions for complex items were similar to those for moderate items.
The repeated measures variance analysis for K values indicated a significant main effect of complexity (F [2, 76] = 128.510, p < 0.001, ηp² = 0.772). The K values in the simple condition were significantly higher than those in the moderate condition, which were significantly higher than those in the complex condition. Bayes factors provided strong support for this finding (BF10 = 2.311e + 31). There was also a significant main effect of set size (F [2,76] = 12.797, p < 0.001, ηp² = 0.252), with Bayes factors providing strong support (BF10 = 6.950e + 3). Additionally, the interaction between complexity and set size was significant (F [4, 152] = 36.058, p < 0.001, ηp² = 0.487), strongly supported by Bayes factors (BF10 = 2.991e + 4). Further results from the simple effect analysis and descriptive statistics are illustrated in Table 1 and Fig. 4.
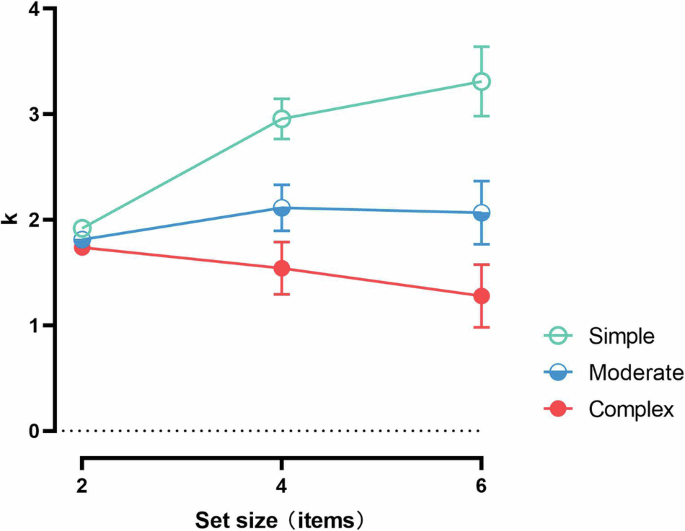
In each set size condition, the K values in the simple condition were significantly higher than those in the moderate condition, which were significantly higher than those in the complex condition.
A paired-sample t-test was conducted comparing the K values of 4 items in the moderate condition (multiplied by 2) with the K values of 2 items in the simple condition. The results showed a significant difference between the groups (t (39) = 10.764, p < 0.001). Similarly, when the K values of 6 items in the complex condition (multiplied by 3) were compared with the K values of 2 items in the simple condition, there was a significant difference between the two groups (t (39) = 2.182, p < 0.05).
Experiment 4
The results of Experiments 2 and 3 suggested that as memory items become more complex, capacity for them decreases. However, this finding does not rule out the possibility that encoding time also influences capacity. Another plausible explanation is that encoding complex items requires more time than encoding simple items. The results from these experiments might be due to an incomplete encoding process within the given time (100 ms) for complex items, as they evidently need more time for encoding than simple items. Experiment 4 addressed this by manipulating the presentation time for memory arrays. If incomplete encoding of complex items leads to poorer memory performance, an interaction effect between presentation time and complexity would be observed. The difference in memory performance should be larger with shorter presentation times and diminish when the presentation time is sufficiently long.
The repeated measures variance analysis for K values indicated a significant main effect of complexity (F [2,58] = 275.495, p < 0.001, ηp² = 0.905), with Bayes factors providing strong support (BF10 = 9.537e + 74). The K values in the simple condition were significantly higher than those in the moderate condition, which in turn were significantly higher than those in the complex condition. There was also a significant main effect of presentation time (F [2,58] = 16.130, p < 0.001, ηp² = 0.357), supported by strong Bayes factors (BF10 = 2.720e + 3). The K values for the 1,000 ms presentation time were significantly higher than those for the 500 ms presentation time, which were significantly higher than the K values for the 100 ms presentation time. However, the interaction between complexity and presentation time was not significant (F [4, 116] = 1.786, p = 0.136, ηp² = 0.058), with Bayes factors providing moderate support (BF10 = 0.197) (Fig. 5).
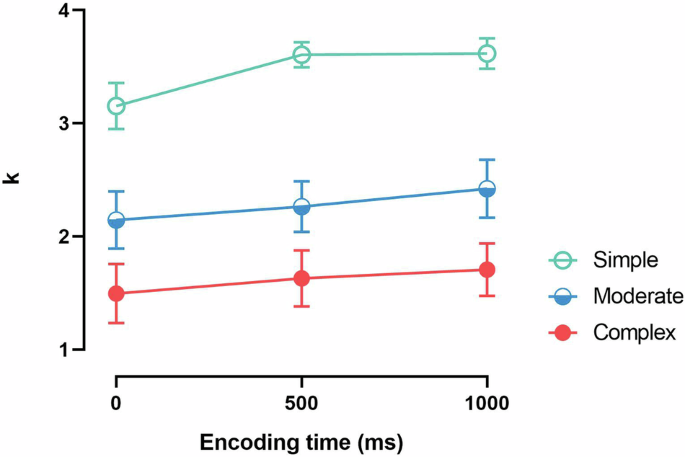
There were significant main effects in complexity and presentation time. But the interaction between complexity and presentation time was not significant.
Experiment 5
Another explanation for the effects of complexity emphasizes the role of similarity. Awh et al.8 believed that change detection was limited by errors in comparing the sample and test, rather than by the quantity of items maintained in WM. The variance in WM capacity among items of varying complexity levels stems from differences in similarity between the items, rather than fluctuations in the memory resources consumed by items of different complexities. Experiment 5 used one-item change detection tasks8 to explore the differences in similarity among items with three levels of complexity in the present study. If the similarity of the complex items is higher than that of moderate items and simple items, the differences in WM capacity would be due to similarity rather than complexity.
The repeated measures variance analysis for reaction time (RT) showed that the main effect of experiment material conditions was not significant (F [2,46] = 0.512, p = 0.603, ηp² = 0.022). The Bayes factors provided moderate support (BF10 = 0.172). Table 2 shows the detailed results.
Experiment 6
Based on the results of Experiment 3, it is evident that there is not a simple linear relationship between complexity and WM capacity. Therefore, Experiment 6 used visual search rate as an indicator of complexity. The mathematical model was constructed to illustrate the quantitative relationship among complexity, number of items, and WM capacity.
Stepwise regression and polynomial regression methods were applied to establish a mathematical model for the relationship among complexity (x1), number of items (x2) and WM capacity (y). Complexity and WM capacity were calculated by averaging data from 30 participants. The initial model is as follows:
The 99% confidence intervals for the coefficients were [−0.03, 0.166], [−0.152, −0.022], [−0.259, −0.109], [−0.0684, 0.6037], [0.38, 1.432], [−2.992, −1.129], respectively. A nonlinear model was obtained by stepwise elimination of the non-significant terms from the initial model. The final binary polynomial regression model is as follows:
The 99% confidence intervals for the coefficients were [−0.3512, −0.0508], [−0.6517, −0.3969], [0.3693, 0.6988], [0.4327, 0.494], respectively. The RMSE of the model was 0.112, indicating a good fit. The coefficient of determination was r2 = 0.399, F = 58.928, p < 0.001, indicating that the regression model was valid. The normalized data of another 30 subjects were used for prediction verification. The mean and standard deviation of the difference between the actual and predicted values obtained by the regression model were 0.081 and 0.089, respectively. Additionally, 41.45% of the actual data fell within the 95% prediction interval (the average length of the prediction interval is 0.055), indicating that the predictions of the regression model were valid.
Experiment 7
Experiment 7 explored neuronal activity when WM stored items at different levels of complexity using EEG.
Behavioral results
The repeated measures ANOVA on K values revealed a significant main effect of complexity (F [2,46] = 78.811, p < 0.001, ηp² = 0.774], with K values significantly higher in the simple condition compared to the moderate condition (p < 0.001), and significantly higher in the moderate condition compared to the complex condition (p < 0.001). There was also a significant main effect of set size (F [2,46] = 890.281, p < 0.001, ηp² = 0.975). Additionally, the interaction between complexity and set size was significant (F [2,46] = 18.895, p < 0.001, ηp² = 0.451). Further simple effects analysis revealed that under the 2 items, there was a significant difference between different complexity levels (F [2,46] = 20.608, p < 0.001, ηp² = 0.473). There was no significant difference between the simple and moderate conditions (p = 0.334), with K values significantly higher in the moderate condition compared to the complex condition (p < 0.001), and in the simple condition compared to the complex condition (p < 0.001). Under the 4 items, there was a significant difference between different complexity levels (F [2,46] = 62.845, p < 0.001, ηp² = 0.732). K values were significantly higher in the simple condition compared to the moderate condition (p < 0.001), and in the moderate condition compared to the complex condition (p < 0.001). Under the 6 items, there was a significant difference between different complexity levels (F [2,46] = 42.582, p < 0.001, ηp² = 0.649). K values were significantly higher in the simple condition compared to the moderate condition (p < 0.01), and in the moderate condition compared to the complex condition (p < 0.001) (Fig. 6).
In the 2 items condition, there was no significant difference between the simple and moderate conditions, with K values significantly higher in the moderate condition compared to the complex condition. In the 4 items and 6 items conditions, the K values were significantly higher in the simple condition compared to the moderate condition, and in the moderate condition compared to the complex condition.
Electrophysiological results
A repeated measures ANOVA was conducted on CDA with a 3 (complexity: simple, moderate, complex) × 3 (set size: 2, 4, 6) design. The results revealed a non-significant main effect of complexity (F [2, 46] = 0.965, p = 0.388, ηp² = 0.040). The main effect of set size was also non-significant (F [2, 46] = 2.420, p = 0.100, ηp² = 0.095). However, there was a significant interaction between complexity and set size (F [2, 46] = 3.297, p < 0.05, ηp² = 0.125). Simple effects analysis revealed that under the 2 items, the amplitude of moderate items was significantly higher than that of simple items (p < 0.01), and the amplitude of complex items was significantly higher than that of moderate items (p < 0.05). Under the 4 items, there were no significant differences in amplitude between moderate and simple items (p = 0.538), moderate and complex items (p = 0.714), and complex and simple items (p = 0.384). Under the 6 items, there were no significant differences in amplitude between moderate and simple items (p = 0.305), moderate and complex items (p = 0.723), and complex and simple items (p = 0.110) (Fig. 7).
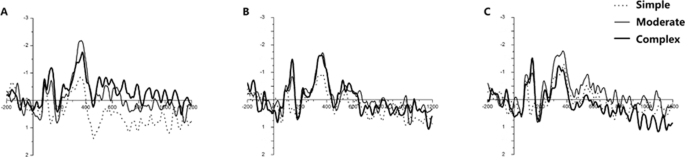
A In the 2 items condition, the amplitude of moderate condition was significantly higher than that of simple condition, and the amplitude of complex condition was significantly higher than that of moderate condition. B In the 4 items condition, there were no significant differences. C In the 6 items condition, there were no significant differences.
Discussion
In this study, novel experimental materials were employed to investigate whether WM capacity is influenced by the complexity of the memory items. The results from all experiments consistently suggest that the complexity of memory items impacts WM capacity, with a decrease in capacity observed as the complexity of the memory items increases. Notably, WM capacity can exceed 5 items. These findings contradict the notion of a fixed number of slots in WM capacity, demonstrating its flexibility when storing items of varying complexity levels.
In Experiment 1, the results on the visual search rate indicate that complex items have a higher complexity than colored squares and simple items, demonstrating the effectiveness of the experimental materials in assessing complexity. Additionally, the simple experimental materials have a lower level of complexity compared to colored squares.
Experiment 2 explored the WM capacity between simple and complex conditions. A significant difference was found between these conditions. The capacity was close to 2 items (approximately 1.31-1.68) in the complex condition, whereas it could exceed 5 items (approximately 1.92-5.16) in the simple condition. Another possible explanation, according to Gestalt theory34, is that participants might integrate multiple simple items into a single conjunction item. Thus, WM does not store multiple simple items separately but rather a combined item formed by simple items. Under different quantity conditions, although memory items are integrated into a conjunction, the complexity of the conjunction varies. According to slot theory, regardless of the complexity of the memory items, the capacity of WM is fixed. However, in simple conditions, the K value increases with the number of items, contradicting the slot model theory. The results of Experiment 2 indicate a significant difference in WM capacity between simple and complex items. Furthermore, the WM capacity could extend beyond five items when the memory items are sufficiently simple. Experiment 3 further verifies that the complexity of memory items affects WM capacity. These findings suggest that the WM capacity is not rigid but adaptable to the complexity of stored items, supporting the perspective of resource theory.
Experiment 4 explored whether the complexity effect originated from encoding limits due to a short presentation time. The results showed no significant interaction between complexity and presentation time, demonstrating that the lower capacity in complex conditions was not due to insufficient encoding time but rather the increased resource consumption by complex items.
In Experiment 5, we compared the similarity levels across three complexity levels. The results indicated that the similarity of the items across different complexity levels did not align with their respective WM capacities. Additionally, findings from Experiment 7 also did not support the notion that capacity differences are attributable to variations in similarity. The Contralateral Delay Activity (CDA) serves as an event-related potential (ERP) component in neural studies. The amplitude of the CDA correlates with the number of items tracked by participants, reaching a plateau at approximately three to four items, as extensively discussed in numerous CDA studies17,35,36. Acting as a neural marker, the CDA effectively monitors the capacity of WM throughout the retention interval before presenting the test array24,37,38. Thus, it circumvents the confounding factor identified by Awh et al.8. Several studies have also reported a significant difference in CDA amplitude between simple and complex items38,39,40. These findings suggest that item complexity acts as a limiting factor for WM capacity, with capacity decreasing as complexity increases.
In Experiment 3, each item’s information load in the moderate condition consisted of the orientation of two lines, while in the simple condition, it was the orientation of one line. Accordingly, the information load for moderate items should be twice that of simple items. If WM capacity were solely determined by item complexity, memory capacity for moderate items would be half that of simple items. However, the results of Experiment 3 revealed that the number of remembered items in the moderate condition exceeded half the quantity of items in the simple condition. The results of Experiment 6 revealed that there is a non-linear relationship between complexity and WM capacity. Hence, WM capacity is not solely determined by item complexity but is influenced by other factors. The study led by Qian et al.41 suggests that both feature-based storage and object-based storage may exist in WM. Moreover, studies indicated that the format of retention in WM, whether separate or conjoined, is intricately linked to the specific demands of the task41,42,43. These findings suggest that the storage mechanism in WM exhibits flexibility rather than being entirely fixed.
In this study, the resource cost for one complex item (the orientation of three lines) was greater than that for one simple item (the orientation of one line) but smaller than the sum of their individual components. This is presumably because items of varying complexity levels are processed differently during contour processing. Visual contour processing refers to the visual system’s process of grouping separate local input elements into meaningful global features to infer the visual objects in the scene. This process links primary perception with secondary perception44.
During the contour integration stage, visual information from the primary visual cortex (V1) is transmitted to the extrastriate cortex for spatial integration45,46,47. In the extrastriate cortex, additional details of complex items, such as angles and relative positions, are further processed. Hence, the study’s findings may be attributed to the increased visual information present in complex items, requiring more WM resources per item compared to simpler conditions. Moreover, complex items contain more sophisticated features than simple ones. Processing in the extrastriate cortex likely aids in efficiently storing complex items. This could explain why the resource cost for each complex item was lower than the sum of simple items.
Processing information across multiple dimensions is crucial for understanding the capacity of WM when integrating complex items. This study was unable to quantify information across all dimensions or analyze the relationship between each dimension’s information and WM capacity mathematically. Future research could use improved designs and experimental materials to establish mathematical models, elucidating the relationship between information dimensions and WM capacity, thus providing deeper insights into how WM integrates complex items.
Methods
Ethics declaration
The procedure in this study was approved by the ethical review board of the School of Psychology, South China Normal University (ID: 2019-4-007) and according to the ethical guidelines of the Helsinki Declaration. All participants took part in this study voluntarily with a written informed consent form.
Experiment 1
Participants
A medium effect size of f = 0.25 was used to conduct a power analysis with G*power 3.148. The estimated sample size needed was at least 18 participants to achieve 80% power and detect the effect given an α level of 0.05. The current experiment recruited 21 right-handed college students with normal or corrected-to-normal vision (18 females, aged 18.81 ± 0.87 years). None of these participants had participated in other experiments from this research.
Experimental design
Experiment 1 employed a single-factor within-subject design. Participants performed a visual search task under three conditions: simple item condition, complex item condition, and colored square condition. One-third of the participants completed the conditions in the following order: colored square – simple – complex – complex – simple – colored squares. Another third completed them in the order: simple – complex – colored square – colored square – complex – simple. The remaining third completed them in the order: complex – colored square – simple – simple – colored square – complex. The order of the conditions was arranged to average out order effects across conditions.
Materials
In the simple condition, memory items were single lines with a visual angle of 2.13° × 0.08°, displayed either horizontally or vertically on the screen. In the complex condition, memory items consisted of integrations of three lines, each with a visual angle of 2.13° × 0.08°. One end of each line combined at the center of the integration, with the other end pointing in one of eight directions, spaced at 45-degree intervals. The color condition included six colored squares, each with a visual angle of 2.13° × 2.13°, in the following colors: red (RGB: 255, 0, 0), green (RGB: 0, 128, 0), blue (RGB: 0, 0, 255), yellow (RGB: 255, 255, 0), magenta (RGB: 255, 0, 255), and cyan (RGB: 0, 255, 255) (Fig. 8).
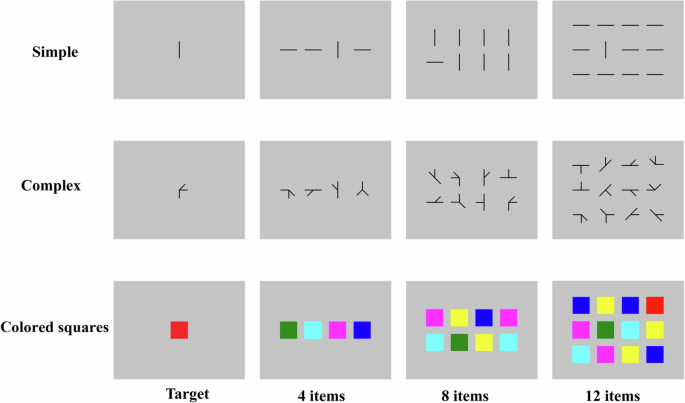
The target was included in the search array in half of the trials and excluded in the other half. Participants were asked to indicate whether the target was present or absent as quickly as possible.
The quantity of items in each condition were 4, 8, and 12, with 60 trials for each quantity. In half of the trials, the target was present in the search array, while in the other half, the target was absent.
Procedure
The experimental procedure was created by using Presentation software 0.71. Participants completed individual tests in a soundproof room. The background color of the monitor was gray (RGB: 195, 195, 195), and the monitor was placed 70 cm away from the participant.
The experiment employed a visual search task33. In each trial, a target was presented at the center of the monitor for 500 ms, followed by a 900 ms interval displaying a “+” sign. This was followed by the presentation of a search array containing 4, 8, or 12 items from the same stimulus condition (simple, complex, or color) as the target. The target was included in the search array in half of the trials and excluded in the other half. Participants were asked to indicate whether the target was present or absent as quickly as possible. The search array remained on screen until the participant responded, followed by a “+” being displayed for an interval of 1000-1500 ms, indicating the next trial.
Data analysis
The dependent variable was the visual search rate, estimated by taking the slope of the line relating the target-presentation reaction time to the quantity of items in the search array in the correct response trials33.
SPSS version 24.0 was used for statistical analysis of the data. To provide stronger support for our proposal, Bayesian statistics were employed using JASP49 with the default prior width. Additionally, interpretations were reported according to the approximate classification scheme of Bayes Factors BF1049. In all reported models, subjects were included as random factors. JASP version 0.13.1 was used for the Bayesian statistics.
Experiment 2
Participants
A medium effect size of f = 0.25 was used to conduct a power analysis with G*power 3.148. The estimated sample size needed was least 33 participants to achieve 80% power and detect the effect given an α level of 0.05. The current experiment recruited 40 right-handed college students with normal or corrected-to-normal vision (31 females, aged 21.28 ± 1.45 years). None of these participants had participated in other experiments in this research.
Experimental design
This experiment employed a 2 × 6 within-subject design with two independent variables: complexity (simple and complex) and set size (2, 3, 4, 5, 6, and 7). For complexity, half of the participants followed the order: simple – complex – complex – simple, while the other half followed: complex – simple – simple – complex. This order sequencing was designed to minimize potential order effects. Each set size condition was presented randomly within each complexity condition.
Materials
There were eight locations arranged on a circle, with the center of the circle corresponding to the center of the monitor. The circle had a radius of 4.09° of visual angle, and these eight locations were spaced 45 degrees apart. Memory items were randomly presented in two to seven of these eight locations. The memory items for both the complex and simple conditions were identical to those used in Experiment 1. Figure 1A shows samples of the simple and complex items.
The memory array and test array were different in half of the trials and were the same in the other half of the trials. When the memory array and test array were different, there was only one item that exhibited a shape change. The location and quantity of the items were not changed. In simple conditions, the item was rotated at a 90-degree angle around the item center. In complex conditions, one of the lines was rotated at a 45-degree angle around the item center.
Procedure
The experimental procedure was created by Presentation software. Participants completed individual tests in a soundproof room. The background color of the monitor was gray (RGB: 195, 195, 195). The monitor was placed 70 cm away from the participant.
The experiment used the change detection paradigm, which is widely accepted in the research of WM chunks35. In each trial, a memory array was presented at the center of the monitor for 100 ms, followed by a 900 ms interval of “+” being presented that was then followed by the presentation of a test array. Participants were asked to indicate whether the items in the test array were the same as those in the memory array. The test array disappeared when the participant made a response, followed by the presentation of “+” for an interval of 1000-1500 ms, indicating the next trial (Fig. 9).
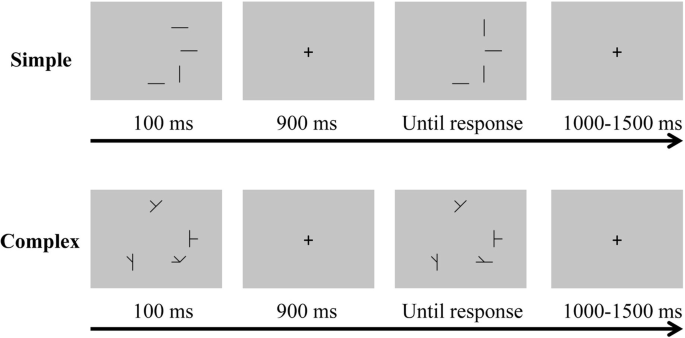
In this example, four memory items were presented to a participant.
Data analysis
The current experiment used the K values50 to measure the whole-display task defined as K = N * (hit rate – false alarm rate) / (1 – false alarm rate).
Experiment 3
Participants
The current experiment recruited 39 right-handed college students with normal or corrected-to-normal vision (33 females, aged 20.26 ± 1.07 years). None of these students had participated in other experiments in this research.
Experimental design
The experiment employed a 3 × 3 within-subject design with two independent variables: complexity (simple, moderate, and complex) and set size (2, 4, and 6). For complexity, one-third of the participants experienced conditions in the sequence: simple – moderate – complex – complex – moderate – simple, while another third experienced: moderate – complex – simple – simple – complex – moderate. The remaining third experienced: complex – simple – moderate – moderate – simple – complex. This order sequencing was designed to minimize potential order effects. Each set size condition was randomly presented within each complexity condition.
Materials
Eight equidistant locations were arranged on a circle centered on the monitor’s screen, each separated by a 45-degree angle. The radius of this circle, as measured in visual angle, was 4.09 degrees. Memory items were presented randomly in two, four, or six of the eight locations. In the simple condition, memory items were single lines with a visual angle of 2.13° × 0.08°, each pointing in one of eight directions with 45-degree intervals. In the moderate condition, memory items consisted of two superposed lines from the simple condition. In the complex condition, memory items comprised three superposed lines. The experimental materials under the three conditions are shown in Fig. 1b. Items in the memory array and test array differed by only one item, with one of the lines rotated by a 45-degree angle around the item center.
Procedure
The procedure of Experiment 3 was the same as that of Experiment 2.
Data analysis
Data analysis in Experiment 3 followed the same methodology as in Experiment 2.
Experiment 4
Participants
The current experiment recruited 30 right-handed college students with normal or corrected-to-normal vision (20 females, aged 20.73 ± 1.64 years). None of these students had participated in other experiments in this research.
Experimental design
A 3 × 3 within-subject design was employed in this experiment, with complexity (simple, moderate, and complex) and presentation time (100 ms, 500 ms, and 1000 ms) as two independent variables. The participants were divided into three groups to counterbalance the order of presentation times and average the order effects. One-third of the participants experienced the presentation times in the order of 100 ms – 500 ms – 1000 ms – 1000 ms – 500 ms – 100 ms. Another third experienced the presentation times in the order of 500 ms – 1000 ms – 100 ms – 100 ms – 1000 ms – 500 ms. The remaining third experienced the presentation times in the order of 1000 ms – 100 ms – 500 ms – 500 ms – 100 ms – 1000 ms. Each condition of complexity was randomly presented within each presentation time condition.
Materials
The memory items in Experiment 4 were the same as those in Experiment 3, except that there were 4 items in each array.
Procedure
The procedure of Experiment 4 was identical to that of Experiment 3, except that the presentation time for the memory array varied among 100 ms, 500 ms, and 1000 ms.
Data analysis
Data analysis in Experiment 4 followed the same methodology as in Experiment 2.
Experiment 5
Participants
The current experiment recruited 24 right-handed college students with normal or corrected-to-normal vision (9 females, aged 25.25 ± 5.64 years). None of these students had participated in other experiments from this study.
Experimental design
Experiment 5 employed a single-factor within-subject design. Participants undertook the task under three conditions: simple item condition, moderate item condition, and complex item condition. One-third of the participants completed the conditions in the order: simple – moderate – complex. Another third completed them in the order: moderate – complex – simple. The remaining third completed them in the order: complex – simple – moderate. This order sequencing was designed to minimize potential order effects across conditions.
Materials
The memory items in Experiment 5 were the same as those in Experiment 3, except that there was only one item in each array.
Procedure
The procedure of Experiment 5 was identical to that of Experiment 3.
Data analysis
Following the study of Awh et al.8, we used RT as an index of similarity.
Experiment 6
Participants
The current experiment recruited 60 right-handed college students with normal or corrected-to-normal vision (26 females, aged 21.03 ± 1.36 years). 30 participants for model building and 30 participants for verification. None of these students had participated in other experiments in this research.
Experimental design
The visual search task was same Experiment 1, except that there were three conditions: simple item condition, moderate item condition, and complex item condition. The design of the change detection task was same as Experiment 3.
Materials
The memory items were same as Experiment 3.
Procedure
Firstly, participants undertook the visual search task. The procedure was same as Experiment 1. Then, they undertook the change detection task. The procedure was same as Experiment 3.
Model indicators
The commonly used statistics for testing regression models include the coefficient of determination r2, F, and p51. r2 is often used as an indicator of goodness of fit. The larger r2suggests the better fitting of regression model52. However, the value of r2 will increase with the increase of the sample size of the data set. Therefore, there will be a certain error in the comparison of model results on different datasets. Later, some researchers proposed more advantageous statistics to further judge the goodness of fit. The more commonly used is the Root mean squared error (RMSE), which is at the same level as the sample data, making it easier to perceive the data53.
Experiment 7
Participants
The current experiment recruited 24 right-handed college students with normal or corrected-to-normal vision (12 females, aged 20.83 ± 1.76 years). None of these students had participated in other experiments in this research.
Experimental design
A 3 × 3 within-subject design with two independent variables of complexity (simple, moderate, and complex) and set size (2, 4, and 6) was used in the experiment. For complexity, one-third of the participants experienced conditions in the order: simple – moderate – complex, while another third experienced: moderate – complex – simple. The remaining third experienced: complex – simple – moderate. This order was arranged to average out order effects. Each set size condition was randomly presented in each complexity condition.
Materials
The memory items in Experiment 7 were the same as those in Experiment 3, except that stimulus arrays were presented simultaneously on the left and right sides.
Procedure
In each trial, an arrow is presented for 400 ms to cue the participant about the array they need to memorize. Then, a “+” sign is displayed for 400–600 ms. Following this, memory arrays are shown for 200 ms on both the left and right sides of the visual field. Afterward, a “+” sign appears for 900 ms, and finally, a test array is presented. The participant is required to determine whether the memory array indicated by the arrow matches the image in the corresponding side of the test array. The test array disappears once the participant presses a key. Afterward, a “+” sign appears for 1000–1500 ms before the next stimulus begins (Fig. 10).
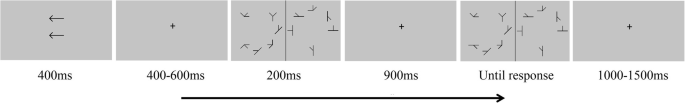
In this example, four complex memory items were presented to a participant. The items on which the arrow points are different between the two arrays.
Behavioral data analysis
Data analysis in Experiment 7 followed the same methodology as in Experiment 3.
EEG recording and analysis
Scalp voltage was recorded with a standard international 10-20 system extended NeuroSCAN-64 Ag/AgCl electrode cap using NeuroScan4.5. The analog voltage of the amplifier is 0.05 ~ 100 Hz, and the online sampling rate is 1000 Hz. The ground electrode was located in the middle of the FPz and Fz. The reference electrode was on the tip of nose, and the eye electrodes were attached above and below the right eye socket without blocking sight. During the whole experiment, the resistance of all electrodes was less than 10 kΩ.
The Neuroscan 4.5 was used for preprocessing during offline analysis. The continuous data were segmented into epochs from −200 to +1200 ms relative to onset of the memory array and the baseline was corrected to 200 ms pre-stimulus. Wave bands with blinks and other movements were excluded, as were wave bands with amplitude greater than ± 100μv. All electrodes were referenced to the average of the left and right mastoids. Separate average waveforms for each condition were generated, and difference waves were constructed by subtracting the average activity recorded at electrodes ipsilateral to the memorized array from the average activity recorded at electrodes contralateral to the memorized array. For statistical purposes, we used the mean amplitude found in the average of P1/P2, P3/P4, P5/P6, PO3/PO4 and PO5/PO6 electrodes.

Responses