Ferroelectricity at the extreme thickness limit in the archetypal antiferroelectric PbZrO3

Introduction
Antiferroelectrics are defined as materials that exhibit an antipolar phase in the absence of the electric field, which can be converted into a polar phase by the application of an external electric field1. Lead zirconate (PbZrO3) was the first antiferroelectric to be discovered and has been investigated since the 1950s2,3. For PbZrO3 the antipolar phase has Pbam symmetry, while the energetically competitive metastable polar phase is R3c. The polar phase can be induced by the application of a strong enough electric field, and gives rise to the double hysteresis loops of polarization as a function of AC fields4,5,6. In addition to this well established polar phase, several other phases have been reported both experimentally7,8, and computationally9,10. Among others, an Ima2 phase in which both polar and antipolar orderings co-exist was proposed by Aramberri et al.10, and recent experimental reports support ferrielectric behavior in PbZrO3 thin films, consistent with co-presence of polar and antipolar arrangements in this material and extremely energetically close polar and antipolar phases11,12.
Indeed, upon scaling down, PbZrO3 could exhibit rather different behavior. Several experimental groups have reported ferroelectric or mixed ferroelectric/antiferroelectric behavior in PbZrO3 films4,13. Chaudhuri et al. reported pinched hysteresis loop for a 22 nm epitaxial PbZrO3 film and rhombohedral ferroelectric phase for ultra thin films (≤ 10 nm)14. Likewise, transition into the ferroelectric phase has been reported in epitaxial antiferroelectric/ferroelectric multilayers of PbZrO3/Pb(Zr0.8Ti0.2)O3 when individual layer thickness was below 10 nm15. First-principles-based simulations have been used previously to explain the size-driven transition into ferroelectric phase16. It was proposed that the presence of the surface favors the ferroelectric phase as it effectively removes the energetically costly interactions between head-to-tail dipoles. The same surface effect was found responsible for stabilization of ferroelectric phase in PbZrO3 nanowires and nanodots17. More recently, weak ferroelectricity and a strong second harmonic generation (SHG) signal were observed in 110 nm PbZrO3 thin films at room temperature, suggesting that the room-temperature orthorhombic structure is non-centrosymmetric18. The polarization vector in the 45 nm PbZrO3 film exhibited the magnitude and angle modulation modes, inducing quasi-antiferroelectric properties. Electron microscopy studies revealed that for 12 nm PbZrO3 film, the polarization vector is in-plane, while for 8.8 nm thick film, the polarization vector has a large out-of-plane component19. Transition into a ferroelectric-like state present in a large temperature window has been also reported in a 45 nm thick PbZrO3 film20. Ferrielectric phase has been observed in the absence of external electric fields in highly oriented PbZrO3 thin films, with modulations of amplitude and direction of the spontaneous polarization and large anisotropy for critical electric fields required for phase transition, calling for re-evaluation of fundamental science of antiferroelectricity11.
While these studies highlight different aspects and even some controversies associated with scaling down prototypical antiferroelectric PbZrO3, a knowledge gap exists in terms of investigating a bottom-up approach where atomically thin layers of PbZrO3 (starting from a single unit cell consideration) give way to increasing number of layers. How does the interplay between antiferroelectricity, ferroelectricity, and ferrielectricity in PbZrO3 manifest in just a few atomic layers of materials? Can this interplay be understood from a bottom-up approach? Can scaling-up provide a different or complementary picture of these complex phenomena? The goals of this work are (i) to predict phases that can develop in atomically thin Pt/PbZrO3/Ptnanocapacitors; (ii) to evaluate the possibility that contrary to the case of bulk PbZrO3, the ground state of such nanocapacitors can be polar; and (iii) to reveal the origin of such polar phase stabilization.
Results and Discussion
Figure 2d gives the energy evolution along the distortion path from cubic (Pmbar{3}m) bulk PbZrO3 to the three low symmetry phases: antipolar Pbam, polar R3c and (multi)polar Ima210. Note that we term Ima2 phase as multipolar as it exhibits both polar and antipolar orderings. At zero Kelvin, (Pmbar{3}m) phase is a local maximum, while the other phases are the (local) minima. Since the differences in energies are relatively small, it is important to eliminate the possibility of computational resolution affecting the results. More precisely, the size of computational supercells is different for different phases of PbZrO3, which could affect the computational resolution. To eliminate that effect, we created the distortion path that connects all four phases of this material and computed the energy evolution along such a path. The data are given in Fig. 2h and validate the relative stability of the phases. The associated energies of the phases are given in Table 1. The data predict that for bulk PbZrO3, the lowest energy phase is Ima2, followed by Pbam and R3c. This is in agreement with the previous finding of ref. 10. However, the energy difference between Ima2 and Pbam is only 2.3 meV, and ref. 10 also alerts that this prediction is dependent on the exchange correlation functional. Given the limited experimental confirmation of the existence of the Ima2 phase but rather structures possibly comparable with it, we will consider this phase with caution. However, we do note that a ferrielectric phase would be most compatible with a body of recent experimental works that have cast doubt of the antiferroelectric nature of PbZrO311,21,22,23.
Next, we carry out the same energetic analysis for the nanocapacitors made of 3, 5, or 7 atomic layers of PbZrO3 sandwiched between three atomic layers of cubic Pt (see Fig. 1a–c). Note that the thickness of Pt slab is limited by the computational cost. These are constructed by cutting bulk PbZrO3 along [001] pseudocubic direction. Each one of the four PbZrO3 phases described above was used for this construction to yield four initial phases for each nanocapacitor. For example, for the nanocapacitor with 3 atomic layers (to be termed as 3-Layers), we created four initial phases from (Pmbar{3}m), Pbam, R3c, and Ima2. The PbZrO3 was simulated with ZrO2 termination based on the experimental evidence, given the known high volatility of Pb compared to Zr, resulting often in Pb-deficient surfaces in Pb-based perovskites24,25. Such nanocapacitors are then subjected to structural relaxation. We constrain in-plane lattice constant of the nanocapacitor to the lattice parameters of the given bulk phase of PbZrO3 in order to model relaxed PbZrO3 films. The lattice parameter of the nanocapacitor along the growth direction is relaxed. All ionic positions are fully relaxed. The PbZrO3 phases produced in such relaxations are summarized in Table 1. All structures are provided in ref. 26.

Pt/PbZrO3/Pt nanocapacitors with (a) three; b five; and (c) seven atomic layers of PbZrO3, sandwiched between three layers of cubic Pt. The dashed box indicates the simulation supercell, which is subjected to periodic boundary conditions in all three directions. Layer-by-layer LDOS of the ZrO2 layers in the 7-Layer nanocapacitor for (d) P4/mmm, e Pba2, and (f) Pc phases. The L1 and ({{rm{L}}}^{{prime} }1) label layers next to Pt, and the L2 and ({{rm{L}}}^{{prime} }2) label the middle layers. Note, that for the middle layers the DOS at the Fermi level is smaller than our computational resolution.
It has been previously shown that underestimation of the band gap by DFT may lead to electron spillage in insulator-metal heterostructures, which leads to the artificial potential difference and erroneous predictions27. To test whether Pt/PbZrO3/Pt nanocapacitors present such “pathological regime”, we computed local density of states (LDOS) for them and present these data in Fig. 1. The data show that no density of states appears at the Fermi level, which is an indication that the nanocapacitors are not in the pathological regime27.
Figure 2 shows the energy evolution along the distortion path for the nanocapacitors. The energy landscape is quite different from the bulk one. Most strikingly, the phase that originated from the antipolar Pbam phase is now higher in energy than the ones that originated from both polar phases (R3c and Ima2). This is in agreement with earlier reports of ferroelectric phase stabilization in ultrathin PbZrO3 films obtained from the effective Hamiltonian simulations16. We have computed polarization along the associated distortion paths (see Fig. S1 of Supplementary materials) and list the values in Table 1. Technically, the polarization was computed within Berry phase approach by removing Pt and decreasing c-lattice parameter to simulate periodic structure. We also computed the local polarizations in the polar phases of the nanocapacitors and found that the Pz values are slightly smaller in the interface layers (see Fig. S2 in Supplementary Materials). The out-of-plane polarization component gradually from bulk to 5-Layers slab and disappears in 3-Layers one. We attribute that to the increased role of the depolarizing field28 and structural changes due to surface relaxation. In particular, the depolarizing field is a function of the effective screening length, λ, for an electrode29. For example, ({E}_{dep}=-frac{-8pi Plambda }{d}), where P is the polarization and d is the slab thickness28. The relationship explains why depolarizing field increases as the thickness of the slab decreases, therefore, leading to suppression of polarization. Indeed, we found in computations that residual depolarizing field is larger in 5 layer slab as compared to 7 layer one (see Fig. S4 in Supplemental Materials). Note, that we have also computed the energy landscapes as in Fig. 2a–d using PBEsol functional and find the same qualitative dependencies (see Fig. S5 of Supplementary Materials).
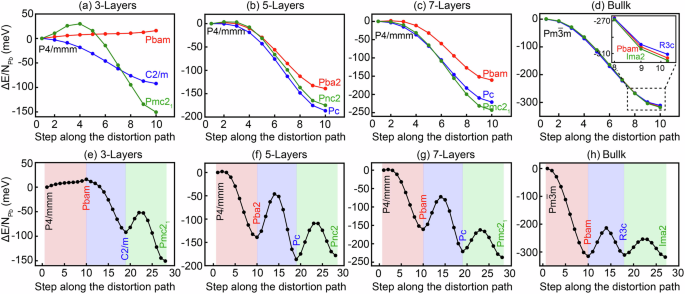
a–h Relative energy per Pb atom along the distortion path between different phases of PbZrO3 heterostructures and bulk PbZrO3. The red, blue, and green lines represent the energy per Pb atom along the distortion path from (Pmbar{3}m) derived phase to Pbam, R3c, and Ima2 derived phase, respectively for heterostructures and bulk PbZrO3.
Thus, our computational data suggest that in ultrathin slabs of 5 and 7 PbZrO3 layers sandwiched between Pt electrodes, the polar phases with significant polarization are stabilized. To confirm the stability of the polar phase in 5 Layer thick nanocapacitor we carried out ab initio molecular dynamics simulations at 3 K (see Fig. S6 of Supplementary Materials). The phase was found to be stable and lower in energy than the antipolar one. Previously, several mechanisms of stabilizing polar R3c phase in orthorhombic CaTiO3-type have been proposed. Strain and electrical boundary conditions were predicted as a mean to stabilize metastable polar phase under conditions of relatively high strain and electric displacement fields30. However, our layers are stress-free and are likely to be under nearly zero electric displacement field, thanks to the screening from the electrodes. Another approach to stabilizing polar phase in CaTiO3-type structure is through oxygen octahedra rotation engineering in perovskite superlattices31. However, this mechanism is not activated in our layers as they do not experience epitaxial boundary conditions. To elucidate the origin of polar phase stabilization in our case we take the advantage of first-principles simulations to decouple the size effects in PbZrO3 nanocapacitor into contributions from (i) dimensionality reduction (creation of slabs from bulk); (ii) electrostatic boundary conditions (surface charge screening); and (iii) interfacial relaxation. To accomplish that, we start with the four fully relaxed phases of bulk PbZrO3 ((Pmbar{3}m), Pbam, R3c, and Ima2). Their energy with respect to the cubic phase is given in Fig. 3 (labeled as relaxed bulk: Bulkr). The relative energetic ordering of the phases is the same as already described. Next, we cut 3, 5, and 7 Layers slabs along [001] pseudocubic direction for each of the phases. To simulate open-circuit boundary conditions, we consider supercell of PbZrO3 slabs separated by 8 Å vacuum. This value of vacuum provides convergent results as has been verified by increasing the value to 10 and 12 Å. Details can be found in Fig. S7 of Supplementary Materials. No structural relaxation is carried out, which allows us to isolate the effect of dimensionality reduction. The associated energy is given in Fig. 3 (labeled as unrelaxed slab: Slabur). Note that to aid the comparison, we label the phases by the space group of bulk from which they originate. The actual space groups could differ. For all slabs, we find that R3c-originated phase is the highest in energy. To understand this finding we recall that when the phase has out-of-plane polarization component it is severely penalized by the strong depolarizing field associated with the direction of reduced dimensionality. Such energy penalty can be estimated as (Vfrac{{P}_{z}^{2}}{2{varepsilon }_{infty }{varepsilon }_{0}}), where V and Pz are the volume and the out-of-plane polarization component of the slab respectively, while ε∞ is optical dielectric constant. The squares in Fig. 3 shows the energy values obtained after subtracting this contribution, which is equivalent of perfect surface charge screening. This results in the phases to be energetically most favorable. With the long-range electrostatic effects out of equation, the difference in the stability of the phases with respect to the one in bulk can be attributed to the surface energy, that is the energetic cost associated with creation of a surface. We computed the surface energy (see Fig. S8 in Supplementary Materials) for the different phases, which confirmed that R3c-originated phases have lowest surface energy, when depolarizing field is fully screened.

Relative energy per Pb atom in bulk PbZrO3 (Bulkr) and Pt/PbZrO3/Pt of different types: unrelaxed slab without Pt (Slabur); unrelaxed nanocapacitor (NCur); relaxed nanocapacitor (NCr) for nanocapacitor with three (a), five (b) and seven (c) layers. Note, that the phases are labeled by the bulk phase they originate from to facilitate the comparison between different nanocapacitors/slabs. Table 1 should be used if the space group of a given nanocapacitor is needed. The red, blue, green, and black lines represent the relative energy per Pb atom for Pbam, R3c, Ima2, and (Pmbar{3}m) derived phases, respectively for heterostructures of PbZrO3. The blue squares give the relative energies of the fully screened slabs as described in the text.
A noteworthy finding is that for 3-Layers slab, the energy of the cubic-originated phase is now lower than the Pbam and Ima2-originated phases. This could be explained by the fact that such slab has only single oxygen octahedron along the growth direction. Cooperative oxygen octahedra tilts are known to stabilize lower symmetry phases in PbZrO3. As such, tilts can no longer cooperate along the growth direction in a 3-Layers slab, and the lower symmetry phases do not stabilize with respect to cubic one in this case. This is further supported by the data for 5- and 7-Layers where such cooperation is possible, and the lower symmetry phases are now lower in energy with respect to cubic-originated one (except for the R3c-originated phase, of course). Next, we turn on surface charge screening by sandwiching the slabs from the previous calculations between Pt electrodes, which are expected to provide good surface charge compensation. The interfacial distance between Pt and ZrO2 layers is taken to be 2 Å. Again, we do not allow any structural relaxations at this point to isolate the effect of screening. The relative energies for such nanocapacitors are given in Fig. 3 (labeled as nanocapacitor unrelaxed: NCur). As expected, surface charge screening lowered the energy of the R3c-originated phase. The striking result is that now, for all nanocapacitors considered, the R3c-originated phase is lower in energy than Pbam and Ima2-originated phases. For 5- and 7-Layers, the phase is polar. Thus, we find that for well compensated PbZrO3 ultrathin slabs, the polar phase is more stable than the antipolar phase. Note, that the energy of the R3c-originated phase in the nanocapacitor is higher than the one of the fully screened slab. This is due to the fact that Pt electrodes do not provide complete surface charge screening, as previously argued. The last contribution to be quantified is the effect of atomic relaxation at the interface between PbZrO3 and Pt. This can be accomplished by subjecting the nanocapacitors of the previous step to full structural relaxation, which was already done in producing data for Fig. 2. Here, we just augment Fig. 3 data with those energies (labeled as nanocapacitors relaxed: NCr). From the Figure, we can see that in all cases, interfacial relaxation (i) stabilizes the lower symmetry phases over the cubic-originated one; (ii) does not change the relative ordering of the polar and antipolar phases (the polar phases remain lower in energy than the antipolar one). The dipole patterns due to polar and antipolar modes in different nanocapacitors are given in Fig. S9.
Thus, our analysis reveals that reducing dimensionality of PbZrO3 from 3D (bulk) to 2D (slabs) activates size effects that stabilize polar phases over the antipolar ones. In particular, the surface energy is phase-dependent and is lower for the phases that originate from the R3c of bulk. However, this effect could be overpowered by the depolarizing field, favoring phases with small or zero out-of-plane polarization. Therefore, for the cases of good surface charge compensation, we expect polar phases to be stabilized in nanocapacitors with ultrathin PbZrO3. Pt electrodes are found to provide such good compensation except for the thinnest slab of 3 atomic layers. Indeed, we find only negligible residual depolarizing field in fully relaxed heterostructures (see Supplementary Materials).
Interestingly, we find the polar Pba2 phase in a 5-Layers nanocapacitor. This is actually a consequence of the symmetry. In bulk Pbam phase of PbZrO3 the mirror plane m is the PbO plane. As can be seen from Fig. 1 such mirror plane can be preserved in slabs with odd number of PbO layers, but is lost in slabs with even number of PbO layers, consequently lowering the symmetry of the phase. The polar axis gives origin to the tiny polarization of 4.9 μC/cm2. Consequently, we expect this effect to be present in all nanocapacitors with an even number of Pb layers. Note, that layer-by-layer decomposition of polarization (Fig. S2c) indicates that the local polarization is present in all layers, not just the interface ones.
Are the nanocapacitors ferroelectric? By definition, the direction of polarization needs to be reversible by the application of electric field. From Fig. 2, we find that the energy barriers between different phases of nanocapacitors are comparable to those of bulk PbZrO3. Since the reversibility of polarization direction in bulk PbZrO3 is well established experimentally, we conclude that these barriers are surmountable, and the polarization direction in nanocapacitors can be reversed by experimentally accessible electric fields. In the context of perovskite ferroelectrics, there has been a long running debate about the thickness limit below which the material might not be able to sustain polarization28. The results obtained in this work suggest that scaling up an antiferroelectric layer-by-layer might offer access to genuinely polar phases at the ultrathin limit.
In summary, we have used DFT simulations to investigate relative phase stability of polar, antipolar, and multipolar phases of Pt/PbZrO3/Pt nanocapacitors. The energy landscape of bulk PbZrO3 consists of the local maximum associated with (Pmbar{3}m) cubic phase and local minima associated with Pbam, R3c, and Ima2 phases. Among experimentally observed phases, Pbam is the global minimum, while R3c is a local one, as well established for this prototypical antiferroelectric. In nanocapacitors of 3-, 5- and 7-atomic layer PbZrO3 sandwiched between Pt, the energetic ordering is reversed, and the polar phases are associated with minima, which are lower in energy than the antipolar ones, thus revealing that such heterostructures are ferroelectric. To understand the origin of the behavior opposite to the bulk one, we used computations to isolate energy contributions to different phases due to dimensionality reduction, surface charge compensation, and interfacial relaxation. It was found that the combination of reduced dimensionality and good surface charge compensation provided by Pt is responsible for the stabilization of polar phases with respect to the antipolar one in Pt/PbZrO3/Pt nanocapacitor. We also report that the out-of-plane polarization component reduces with PbZrO3 thickness, which is attributed to the depolarization effects. However, the in-plane polarization component increases in some cases. We believe that our findings shed light onto size effects in this prototypical antiferroelectric and will be valuable in interpreting diverse experimental data. They could also stimulate untraditional ways to achieve ferroelectricity at the extreme thickness limits.
Methods
Density functional theory calculations
The first-principles density functional theory (DFT) calculations were performed using Vienna ab initio simulation package (VASP)32,33. The all-electron projector augmented wave (PAW) potentials34,35 were used to represent the ion-electron interactions. For the calculations, the electronic exchange and correlation part of the potential was described by the local density approximation (LDA)36. The choice of the exchange correlation functional has been motivated by its performance on ferroelectric37 and antiferroelectric (PbZrO3)10 perovskites. In particular, a thorough investigation on the performance of LDA, PBE, PBEsol and SCAN functional in predicting relative phase stability of PbZrO3 phases, including at finite temperatures, reported that predictions from SCAN and PBE cannot be reconciled with experimental data, while LDA and PBEsol provide qualitatively the same predictions10. Likewise, for ferroelectric perovskites LDA and PBEsol were identified as the best performing functionals32,33. The Kohn-Sham orbitals were expanded using the plane wave basis sets with an energy cutoff of value 600 eV. All structures were relaxed using the conjugate-gradient algorithm until the Hellmann-Feynman forces on every atom are less than 0.005 eVÅ−1. The Γ-centered k-point mesh with the spacing of 0.22 Å−1 was used in our calculations. The polarization of the systems was calculated according to the modern theory of polarization38,39,40.
Symmetry analysis
The space groups were identified, and distortion paths were constructed using the ISOTROPY suite41,42. The ISOTROPY defines the distortion path as linear interpolation between its end points. We used tolerances 0.1 Å for both the lattice and atomic positions.


Responses