FISH mapping in Xenopus pygmaeus refines understanding of genomic rearrangements and reveals jumping NORs in African clawed frogs
Introduction
Amphibians are a group of small vertebrates with highly diverse ploidy levels, ranging from diploid to dodecaploid (Mezzasalma et al. 2023), but at the same time their genomes are highly conserved in terms of karyotype structure, synteny between orthologous chromosomes, and low rates of chromosome rearrangements (Bredeson et al. 2024; da Silva et al. 2021; Teixeira et al. 2016; Uno et al. 2013). Due to the strong stability of chromosomes, genome evolution in frogs has been described as “slow” (Bredeson et al. 2024). The exceptions that represent karyotypic structural innovations are Robertsonian translocations and end-to-end fusions (Bredeson et al. 2024), considered to be a driving force of frog evolution in general (Morescalchi 1973).
The frogs of the family Pipidae include four genera, Xenopus, Hymenochirus, Pseudhymenochirus, and Pipa. Among these, at least two genera (Xenopus and Hymenochirus) consist of both diploid and polyploid species (Gvoždík et al. 2024; Tymowska 1991). In addition, pipids involve two model species – the diploid Xenopus tropicalis and the tetraploid X. laevis – frequently used for biological and biomedical research (Cannatella and de Sá 1993; Tandon et al. 2017), whose high-quality chromosome-scale genome assemblies have been generated in several updated versions (Bredeson et al. 2024; Hellsten et al. 2010; Mitros et al. 2019; Session et al. 2016). Furthermore, pipid frogs include other emerging models, X. borealis, Hymenochirus sp. and Pipa parva with draft genome sequences available (Bredeson et al. 2024; Cauret et al. 2020; Evans et al. 2022).
Genus Xenopus contains two subgenera, Xenopus and Silurana (sensu Evans et al. 2015) with a deep evolutionary divergence 45–50 million years ago (Mya) (Feng et al. 2017; Session et al. 2016). The only described diploid species within entire genus, X. tropicalis, belongs to subgenus Silurana, along with three tetraploids: X. calcaratus, X. mellotropicalis, and X. epitropicalis. Xenopus tropicalis has 20 chromosomes, which is considered the ancestral chromosome number in the whole pipid family (Bredeson et al. 2024; Mezzasalma et al. 2015). Tetraploids in subgenus Silurana have 40 chromosomes and their genomes arose from a fusion of two diploid ancestors with 20 chromosomes (Chain et al. 2008; Evans et al. 2004). The complements of the ancestral genomes, referred to as subgenomes, can be distinguished from each other based on sequencing and cytogenetic methods (Evans et al. 2005; Knytl et al. 2017, 2023; Session et al. 2016). Silurana subgenomes are referred to as a- and b-subgenomes (sensu Knytl et al. 2017) and sometimes as alpha- and beta-subgenomes (sensu Evans et al. 2005). The a-subgenome is more closely related to the X. tropicalis genome than the b-subgenome (Evans et al. 2005, 2015). Subgenus Xenopus is more diverse than subgenus Silurana in terms of species diversity and ploidy levels. This subgenus comprises 25 species and three ploidy levels (tetraploid, octoploid, dodecaploid) (Evans et al. 2015; Tymowska 1991). The subgenomic units in subgenus Xenopus are called L- and S-subgenomes (Longer, Shorter; sensu Matsuda et al. 2015). The L-subgenome is more stable and thus more resistant to reorganization, and therefore there is a less divergence between the L-subgenome and the X. tropicalis genome than between the S-subgenome and the X. tropicalis genome (Lau et al. 2020). The S-subgenome is more likely to undergo chromosomal rearrangements and gene loss than the L-subgenome (Session et al. 2016). All tetraploid species within subgenus Xenopus have 36 chromosomes, octoploids have 72 chromosomes, and dodecaploids have 108 chromosomes (Evans et al. 2015; Tymowska 1991). All polyploids in genus Xenopus, including those in subgenus Silurana, are allopolyploids, whose genomes were derived from distinct parental species (Evans et al. 2005, 2015; Knytl et al. 2023; Session et al. 2016; Tymowska 1991). The divergence time of the a- and b-subgenomes (parental species) in Silurana is estimated to be 10 Mya (Evans et al. 2015), while in subgenus Xenopus it is estimated to be 30–35 Mya (Session et al. 2016). The allotetraploidization event in the latter subgenus occurred at least 17–18 Mya, with subsequent polyploid radiation starting at least 17 Mya and forming three major clades, with the X. muelleri species group branching first, and the X. laevis and X. amieti species groups split around 10–17 Mya (Evans et al. 2015, 2024; Fornaini et al. 2023; Session et al. 2016).
Despite the relatively conserved karyotypes of pipid frogs, two interchromosomal rearrangements have been identified—one in each subgenus. In Silurana (X. mellotropicalis), a non-reciprocal translocation of the pericentromeric region between chromosome 9b and 2b has been discovered (Knytl et al. 2017, 2018). The a- and b-chromosomes are partitions of the a- and b-subgenomes, respectively, as well as the L- and S-chromosomes within the L- and S-subgenomes (Knytl et al. 2017; Matsuda et al. 2015). Accordingly, the translocation occurred in the b-subgenome of X. mellotropicalis but did not occur in diploid X. tropicalis (Knytl et al. 2017, 2018). It has not been tested whether this translocation is shared with species of subgenus Xenopus. In subgenus Xenopus, another interchromosomal rearrangement has been described between ancestral X. laevis chromosomes 9 and 10, which fused to form chromosomes 9_10L and 9_10S (Session et al. 2016). The fusion likely occurred in the diploid state of an ancestor of subgenus Xenopus (Session et al. 2016) and is therefore assumed to be present in all other species of subgenus Xenopus. However, the fusion has not been thoroughly investigated to detect breakpoints and fusion junctions in species of subgenus Xenopus other than X. laevis.
Genome reorganization can also occur through clusters of repetitive DNA deposited as tandem repeat units, sometimes referred to as multigene families (Dias et al. 2024; Sember et al. 2020). These units undergo concerted evolution, a process that leads to homogenization and uniformity of paralogous copies across the genome (Wang et al. 2023). One example of tandem repeats is ribosomal DNA (rDNA), which may (nucleolar, e.g., 28S rDNA) or may not (non-nucleolar, e.g., 5S rDNA) be associated with the formation of a nucleolus, specifically, a nucleolus organizer region (NOR) (Fornaini et al. 2024; Symonová and Howell 2018). Traditionally, NORs have been localized in genus Xenopus using conventional cytogenetic techniques like C-banding or silver nitrate staining (Tymowska 1991), but these techniques often target heterochromatic blocks and may not be efficient enough to detect active NORs that are sometimes euchromatic or inactive in the previous interphase of the cell cycle (Dobigny et al. 2002; Sánchez et al. 1995; Unal Karakus et al. 2024). A plausible solution for detecting true NORs is fluorescent in situ hybridization (FISH).
In this study, we examine the allotetraploid Pygmy clawed frog, X. pygmaeus (subgenus Xenopus, X. amieti species group, 2n = 36), with the aim to better understand genome evolution by chromosomal rearrangements in genus Xenopus. We question (1) whether X. pygmaeus has the same 9-2 interchromosomal translocation as X. mellotropicalis (subgenus Silurana), and/or (2) the 9-10 fusion as found in X. laevis (subgenus Xenopus), and/or (3) whether there is another rearrangement that may drive genome evolution in X. pygmaeus. In order to answer the above questions, we use FISH mapping of ribosomal (linked to NORs) and selected single-copy genes to provide a detailed resolution of the X. pygmaeus karyotype. We then compare our mapped locations with the locations of the same genes in the allotetraploid X. laevis from the same subgenus (X. laevis species group, divergence about 10–17 Mya), and the diploid X. tropicalis and allotetraploid X. mellotropicalis from subgenus Silurana (divergence 45–50 Mya).
Materials and methods
Origin of samples and preparation of primary cell cultures
Xenopus pygmaeus from the Democratic Republic of the Congo (Kokolopori, Yalokole, near Luo River, 0.2056∘N, 22.8884∘E) was used in this study and is the only representative of genus Xenopus that has been found in this region (Badjedjea et al. 2022). A parental couple was reproduced without any hormonal stimulation. IDs of mother and father are CD18.538 and CD18.537b, respectively (Evans et al. 2024). Primary cell cultures were established from the hindlimbs of four tadpoles at stage NF55 (± 1) (Sinzelle et al. 2012), for Xenopus stages see https://www.xenbase.org/xenbase/anatomy/alldev.do. The tadpoles were anesthetized using MS-222. IDs of the four tadpoles used for cell cultures are XPYTaF1-1–XPYTaF1-4. The composition of the cultivation medium was the same as described in Knytl et al. (2023). The cells were cultivated at 29.5∘C with 5.5% CO2. The medium was changed daily for one week, and then three times a week thereafter (Fornaini et al. 2023). Passages were performed with trypsin-ethylenediaminetetraacetic acid (Knytl et al. 2017). For cell cultures, we used siblings from the same cross. Other siblings of the same cross were grown and used as probes for single-copy gene mapping (ID XPYTaF1-5). The parents of the studied tadpoles were genotyped by reduced representation genotyping by sequencing and sequencing a portion of the 16S ribosomal RNA (rRNA) gene in the mitochondrial genome (Evans et al. 2024), which confirmed the identity of the species.
Analysis of karyotype
Chromosomal suspensions were prepared from cell cultures according to the protocol described by Khokha et al. (2009) with minor changes (Krylov et al. 2010). Ready-to-use suspensions were stored in a methanol:acetic acid 3:1 fixative solution at –20°C. Chromosomal suspension was dropped onto microscope slides according to Courtet et al. (2001) and FISH procedures followed. Each sample was stained using Pro-Long® Diamond Antifade Mountant with the fluorescent 4’,6-diamidino-2-phenylindole, DAPI stain (Invitrogen by Thermo Fisher Scientific, Waltham, MA, USA) to label each chromosome in a metaphase. For analysis of karyotype, short (p) and long (q) arms of each chromatid were measured in pixels using ImageJ, V 1.53k (Schneider et al. 2012). The lengths of the p and q arms were quantified as described in Knytl and Fornaini (2021). To identify each chromosome, we calculated chromosome length (l), centromeric index (i), and p/q and q/p arm ratios (r1, r2) (Levan et al. 1964; Tymowska 1991); see Knytl et al. (2023) for formulas. Each measured chromosome was compared to its corresponding chromosome in the X. pygmaeus karyotype assigned by Tymowska (1991). However, the chromosome arms were not measured by Tymowska (1991), and therefore, we used measurements from X. laevis as a template (Matsuda et al. 2015; Tymowska and Kobel 1972) for chromosome identification in X. pygmaeus. Chromosome nomenclature was taken from Matsuda et al. (2015). Each individual chromosome was also assigned a chromosomal category based on the i value. If the i value was equal to or greater than 37.5, the chromosome was categorized as metacentric. If the i value was equal to or higher than 25 and lower than 37.5, the chromosome was categorized as submetacentric, and if the i value was equal to or greater than 12.5 and lower than 25, the chromosome was categorized as subtelocentric. Data were analyzed in R software for statistical computing, V 4.3.1 (R Core Team 2020) using the ggplot2 and ggpubr packages. To test whether the l and i values differed significantly between two homeologous chromosomes, one-way analysis of variance (one-way ANOVA) and Tukey’s test were performed using R scripts modified from Knytl and Fornaini (2021). All steps outlining how the measured values were calculated and processed into tables and plots, including metaphase images, are available on https://github.com/martinknytl/2024_pygmaeus_karyotype. Eleven metaphase images were analysed for karyotype analysis; ten to 20 metaphase images were analysed in each FISH experiment.
Mapping of 28S and 5S ribosomal genes
Laboratory strain of X. tropicalis (Ivory Coast), long-term bred at Charles University in the Czech Republic, was used as a source for amplification of 28S and 5S rDNA probes. Total genomic DNA was extracted from the liver of adults using the DNeasy Blood & Tissue Kit (Qiagen, Hilden, Germany) according to the manufacturer’s instructions. Primer sequences for 28S and 5S (Integrated DNA Technologies, Coralville, IA, USA) are listed in Table 1. Identical X. tropicalis 5S (100% identity with accession number OR360596) and 28S (100% identity with accession numbers XR_004223792–XR_004223798) sequences from Gvoždík et al. (2024) and Knytl and Fornaini (2021), respectively, were used and labeled. The preparation of the 28S and 5S probes including PCR conditions, labeling with digoxigenin-11-dUTP and biotin-16-dUTP (both Jena Bioscience), respectively, and purification, is detailed in Knytl & Fornaini (2021). The 28S and 5S probes were hybridized with chromosomal spreads of X. pygmaeus. The composition of the hybridization mixture and the hybridization process were conducted as detailed in Knytl et al. (2023). Post-hybridization washing and blocking reaction were performed as described for painting FISH in Krylov et al. (2010). The probe signal was visualized as described in Knytl et al. (2017).
Mapping of single-copy genes
RNA was extracted from multiple organs from adult X. pygmaeus offspring (Table 1) using the E.Z.N.A. Total RNA Kit I (Omega Bio-tek; Norcross, GA, USA). RNA was reverse-transcribed into cDNA using the RevertAid H Minus First Strand cDNA Synthesis Kit (Gibco by Thermo Fisher Scientific). Eight autosomal genes were amplified: choline/ethanolamine phosphotransferase1 (cept1), glycogenin 2 (gyg2), fibronectin 1 (fn1), NADH: ubiquinone oxidoreductase core subunit S1 (ndufs1), splicing factor 3b subunit 1 (sf3b1), NODAL modulator 3 (nomo3), bone morphogenetic protein 7 (bmp7) and SRY-box transcription factor 9 (sox9). Primers were designed based on available orthologous sequences of X. laevis and X. tropicalis. All primers, along with their corresponding gene names, are summarized in Table 1. Justification for gene selection is given in Section Results, Mapping of single-copy genes. Amplified genes were cloned using the TOPO-TA cloning kit (Invitrogen, Camarillo, CA, USA). Plasmid DNA was isolated from 4–5 bacterial colonies for each gene using the E.Z.N.A. Plasmid DNA Mini Kit I (Omega Bio-tek), checked by electrophoresis, and sent for sequencing. Sequences were compared with sequences from X. laevis using Geneious Prime, version 2023.0.4. The cDNA sequences were deposited in the GenBank database (Table 1).
The FISH with tyramide signal amplification (FISH-TSA) protocol was adopted from Krylov et al. (2007) with minor modifications as described in Knytl et al. (2018). FISH probes were labeled with digoxigenin-11-dUTP (Roche, Mannheim, Germany), signal was detected by antidigoxigenin-POD, Fab fragments (Roche), and amplified using the TSA TM-Plus Tetramethylrhodamine System Kit (NEL742001KT, PerkinElmer, Inc., Waltham, MA, USA).
Microscopy and processing of FISH images
Fluorescence FISH images were captured using a Leica DM6 upright microscope coupled with fluorescence units, a Leica DFC7000 T camera, and Leica Application Suite X software, version 3.7.3.23245 (Leica Microsystem, Wetzlar, Germany). Images from double-color FISH with ribosomal probes were acquired in three different channels: blue (DAPI), red (28S probe with biotin and streptavidin-Cy3), and green (5S probe with digoxigenin and anti-digoxigenin-fluorescein). Images from single-color FISH-TSA were captured in two channels: blue (DAPI) and red (single-copy gene probes with digoxigenin and anti-digoxigenin-peroxidase-rhodamine). The red-green-blue (RGB) and red-blue channels were merged using Adobe Photoshop, version CS7 (San Jose, CA, USA).
Results
Analysis of karyotype
All four individuals consistently had 36 chromosomes (2n = 4x = 36), where n denotes the haploid chromosome number of the extant species, and x denotes the haploid chromosome number of the most recent diploid ancestor of the extant species. This finding confirms the biological diploidy and evolutionary paleotetraploidy of all individuals analysed, which coincides with Tymowska (1991).
The arms of each chromosome were measured from 11 metaphase spreads and the median values of l, r1 and i were calculated. The value of l was quantified as a percentage of the sum of l for all chromosomes to account for variation in resolution and pixel size of our images. The karyotype of X. pygmaeus consists of 10 pairs of metacentric (m), 1 pair of submetacentric (sm), and 7 pairs of subtelocentric (st) chromosomes (Table 2). Neither acrocentric chromosomes (i interval 0–12.5) nor telocentric chromosomes (no p arm; i = 0) were present in the X. pygmaeus karyotype.
Subsequently, we plotted each chromosome on a graph based on i (x axis) and l (%, y axis) to determine whether pairs of homeologs had similar chromosomal morphology and whether they grouped closely together (Fig. 1A). The l and i values corresponding to each chromosome 1L–9_10S were plotted as well (Fig. 1B, C). A measure of statistical dispersion, the interquartile range (Q1–Q3), was used to evaluate the extent of morphological divergence of each pair of homeologous chromosomes. The highest divergence in l between homeologous chromosomes was found between chromosomes 8L and 8S. The Q1–Q3 of chromosomes 8L and 8S ranged from 2.41 to 2.58% and from 1.64% to 1.82%, respectively. The second highest divergence in l was measured within homeologous pairs 7L (2.35–2.53%) and 7S (1.87–1.99%) (Fig. 1B, Table S1). The largest difference in i between homeologous chromosomes was between chromosomes 8L and 8S, which differed by 20.2–22.5 and 41.5–48.2 within Q1–Q3, respectively. Each of homeologous chromosomes 8L and 8S was classified into different morphological category (st, and m; Table 2). The second greatest variation based on the Q1–Q3 i interval was between 6L (46.1–49.5) and 6S (40.4–44.1) (Fig. 1C, Table S2). One-way ANOVA and Tukey’s tests revealed statistically significant differences in l between all homeologous pairs and in i between chromosomes 1L and 1S, 2L and 2S, 6L and 6S, and 8L and 8S (Fig. 1B,C). This analysis confirmed the appropriateness of using the terms L as longer and S as shorter chromosomes of each homeologous pair.
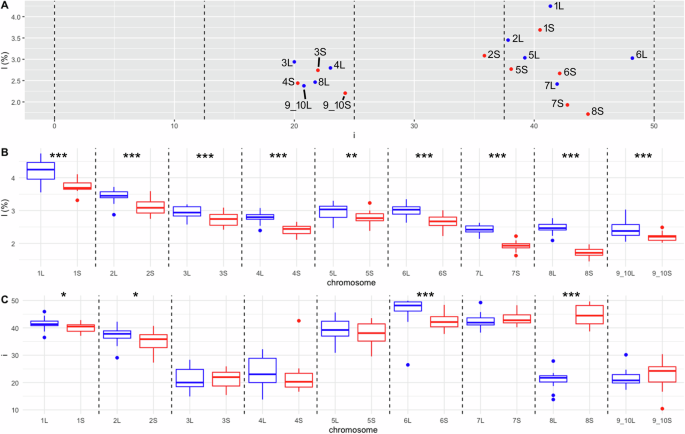
The L-subgenome is shown in blue and the S-subgenome in red. A Relationship between centromeric index (i), x-axis, and chromosome length (l), y-axis. Black dashed vertical lines delineate the intervals 0–12.5, 12.5–25, 25–37.5, and 37.5–50, corresponding to acrocentric, subtelocentric, submetacentric, and metacentric chromosomes, respectively. The plotted values of i and l are medians for each chromosome. Panel (B) shows intrachromosomal variation of l value (y axis) for the haploid complement of 18 X. pygmaeus chromosomes (x axis). C Intrachromosomal variability of i value (y axis) for the haploid complement of 18 X. pygmaeus chromosomes (x axis). B, C Black dashed vertical lines define pairs of homeologous chromosomes. Upper and lower whiskers show minimum and maximum values, respectively; boxes involve the lower (Q1) and upper (Q3) quartiles; horizontal lines inside the boxes indicate the median values (Q2); outliers are indicated by blue (for L) and red (for S) points above and below the whiskers. Significance codes for l and i values at the top of (B, C) define whether pairs of homeologous chromosomes are significantly different based on ANOVA and Tukey’s tests. Significantly different homeologs are depicted by significance codes ***, **, and * showing p values of p < 0.001, p < 0.01, and p < 0.05, respectively.
Mapping of 28S and 5S ribosomal genes
In order to determine position and number of ribosomal genes in the genome we used FISH with 28S and 5S rDNA probes (Fig. 2). Using the 28S rDNA probe, we localized NORs. We expected to detect one pair of homologous NORs in allotetraploid X. pygmaeus, assuming that one pair of NORs would be inherited from an ancestor and one pair of NORs would be lost, as proposed in other tetraploids by Session et al. (2016), Knytl et al. (2017), Knytl et al. (2023). Indeed, we identified only one pair of NORs located on the telomere of the long arm of chromosome 6S, as depicted in Fig. 2B, D, E.
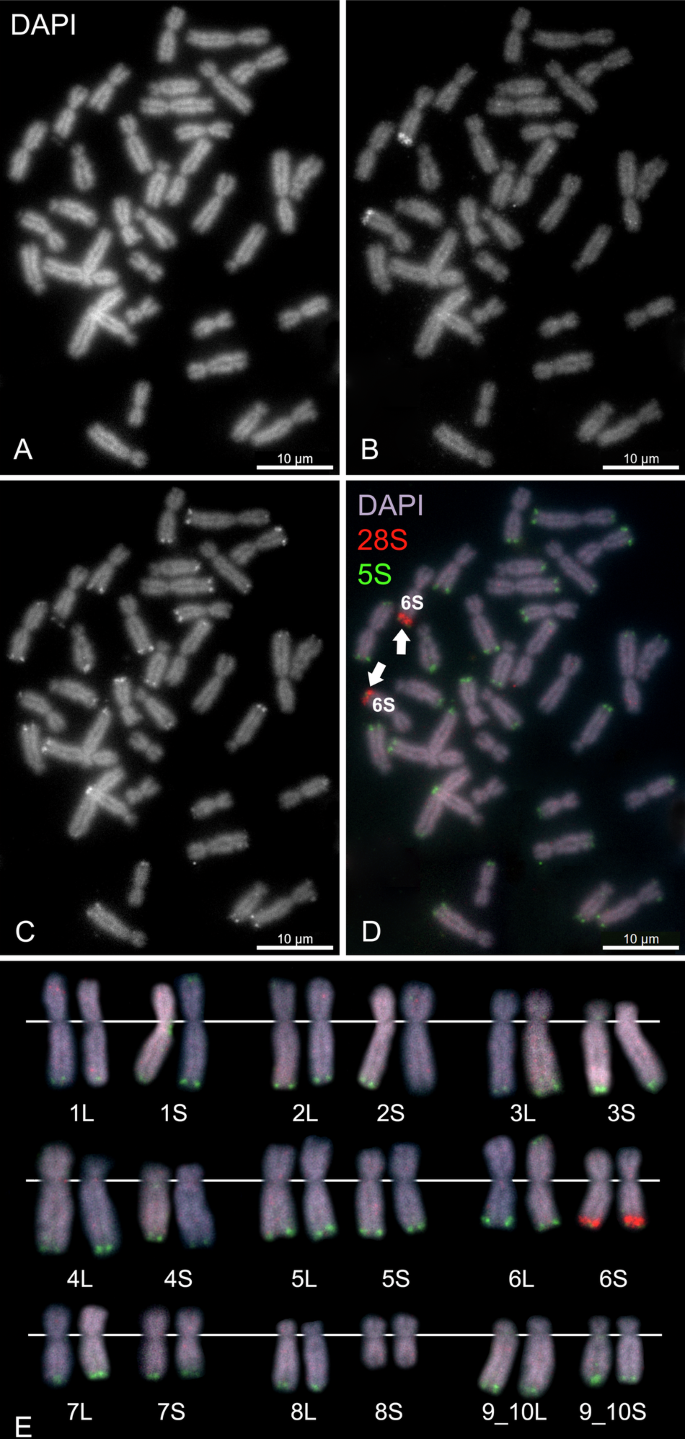
A DAPI (black and white, B&W) counter-stained metaphase spread shows all 36 chromosomes. B FISH with the 28S rDNA probe (B&W), labeled with digoxigenin, reveals a signal on the long arm of chromosome 6S, indicating a nucleolar secondary constriction. C FISH with the 5S rDNA probe (B&W), labeled with biotin, highlights nearly all chromosomes in X. pygmaeus except chromosome 8S. D Merged metaphase (RGB) with DAPI (blue-purple) stain, 28S (red), and 5S (green) signals. Scale bars represent 10 μm. E Karyotype (RGB) arranged according to the l and i values. White lines indicate the position of the centromere.
We localized the 5S rDNA loci in the telomeric regions of almost all chromosomes but one (8S, the shortest chromosome of the karyotype), as shown in Fig. 2C,D,E. Chromosome 2L bears the 5S rDNA signal on both arms. Chromosome 6S bears both 28S and 5S rDNAs—these two regions are spatially tightly adjacent to each other (visible on Fig. 2B, C). Chromosomes 4L and 5L have low-intensity signals, indicating a low copy number per 5S rDNA locus.
Mapping of single-copy genes
Four to five plasmid clones from each amplified X. pygmaeus cDNA (cept1, gyg2, fn1, ndufs1, sf3b1, nomo3, bmp7, and sox9) were sequenced in order to distinguish homeologous copies. Sequences of all cDNA clones were aligned (for each gene separately) to compare their similarity to each other. Identity between clones was 99–100% except for sox9 (93.35% identity between clones A and B). This finding confirmed that we amplified only one homeologous sequence for each gene except for the sox9 gene, for which clones A and B are distinct homeologous copies. Each sequence was then compared to the X. laevis genome database (v.10.1) using BLASTn to determine which was the L and which was the S copy. Only one of two homeologous copies of cept1 and gyg2 is annotated in the X. laevis genome database. The cept1 gene is annotated in the S-subgenome and the gyg2 gene in the L-subgenome. Our cept1 and gyg2 cDNA sequences from X. pygmaeus had 98.7% and 90.64% identity with cept1.S and gyg2.L mRNAs from the X. laevis database, respectively. Because our amplified gyg2 cDNA sequence had a lower similarity to gyg2.L from the X. laevis database than similarity between cDNA sequences within the same subgenome in these two species, it is possible that we amplified the gyg2.S and cept1.S copies. However in the following text, cept1 and gyg2 used as FISH probes are not specified as the L or S copies. Based on the similarity comparison between the fn1, ndufs1, sf3b1, nomo3, bmp7, and sox9 sequences and the mRNA sequences of the same genes from the database, each of our sequences was assigned to either the L or S copy: fn1, ndufs1, nomo3 and bmp7 were assigned to the L copy, while sf3b1 was assigned to the S copy. The similarity between our amplified X. pygmaeus sequences and the more similar homeologous X. laevis sequence was 95−98.5%. For the sox9 gene both copies were amplified, clone A was identified as the S copy and clone B as the L copy. The L copy was selected for FISH-TSA (Table 1). Although we identified only one copy for most genes (our designed primers annealed to only one of two homeologous copies), this is likely due to the high divergence between the homeologous X. pygmaeus sequences, as well as the significant divergence between X. pygmaeus and X. laevis.
We previously identified the translocation of a massive heterochromatic block between chromosomes 9b and 2b in X. mellotropicalis (Knytl et al. 2017). The translocation involves the relocation of the sf3b1 gene from chromosome 9b to 2b (or from chromosome 9 to 2 in a diploid ancestor) (Knytl et al. 2018). However, see Knytl et al. (2023) for the re-designation of the chromosome category from 2a to 2b. To test the hypothesis that the same translocation is also present in X. pygmaeus, we mapped five single-copy genes –cept1, gyg2, fn1, ndufs1, and sf3b1– that flank the translocated region in X. mellotropicalis (translocation-associated genes), as revealed by Zoo-FISH and FISH-TSA (Knytl et al. 2017, 2018). The cept1 and gyg2 genes are situated on the short (p) arm of chromosome 2 in X. tropicalis. In X. laevis, cept1 and gyg2 are situated on the long (q) and p arms of chromosome 2, respectively. Meanwhile the other three genes (fn1, ndufs1 and sf3b1) are located on the q arm of chromosome 9 in X. tropicalis and the q arm of chromosome 9_10 in X. laevis (Knytl et al. 2018; Session et al. 2016; Uno et al. 2013).
We also tested whether the fusion between chromosomes 9 and 10 is also present in X. pygmaeus, as revealed in X. laevis (Session et al. 2016). To accomplish this, we selected three fusion-associated genes: bmp7, which is situated on the p arm of X. tropicalis chromosome 10, nomo3 on the p arm of chromosome 9, and sox9 on the q arm of chromosome 10 (Session et al. 2016; Uno et al. 2013). Three translocation-associated genes, fn1, ndufs1, sf3b1, were also used to detect the fusion between chromosomes 9 and 10. In addition, we hypothesized that the order of the localized genes would reveal the orientation of the ancestral chromosomes and fusion points.
Translocation-associated genes in X. pygmaeus: the fn1, ndufs1, and sf3b1 genes were localized on the q arm of chromosome 9_10 (Figs. 3, S3–S4) and the cept1 and gyg2 genes on chromosome 2 (Figs. 3, S1–S2). Thus, the translocation between chromosomes 9 and 2 did not happen in X. pygmaeus or its tetraploid ancestor. Interestingly, both cept1 and gyg2 mapped to the p arm of chromosome 2L and the q arm of chromosome 2S. Because cept1 and gyg2 mapped to non-homologous regions of chromosomes 2L and 2S (p and q arms), a pericentromeric inversion involving both gyg2 and cept1 genes occurred in the S-subgenome. Furthermore, the mapping analysis of the gyg2 and cept1 genes may improve the annotation of these two genes in the X. laevis genome assembly, in which one homeologous copy of each gene has not yet been annotated (cept1.L and gyg2.S). For more details, see Section Discussion, Evolution by genomic rearrangements.
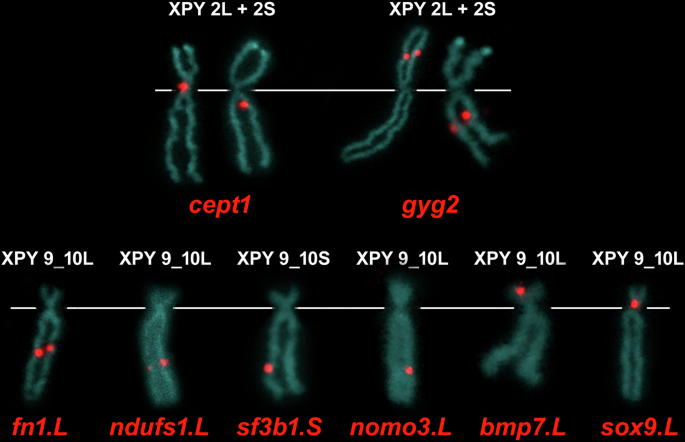
Each of the cept1 and gyg2 probes map to both X. pygmaeus chromosomes 2L and 2S. The fn1.L, ndufs1.L, sf3b1.S and nomo3.L loci are localized on the q arm of X. pygmaeus chromosomes 9_10L, 9_10L, 9_10S and 9_10L, respectively. The bmp7.L and sox9.L are mapped on the p arm of X. pygmaeus chromosomes 9_10L. White lines indicate the position of the centromere.
Fusion-associated genes in X. pygmaeus: the fn1, ndufs1, sf3b1 and nomo3 genes were localized on the q arm of chromosome 9_10 (Figs. 3, S3–S4), while the bmp7 and sox9 genes were localized on the p arm of chromosome 9_10 (Figs. 3, S5). The order of the fusion-associated genes on X. pygmaeus chromosome 9_10 compared with the order of the same genes in X. tropicalis revealed that the ancestral chromosomes 9 and 10 fused through their q arms and that the centromere of chromosome 9 was lost and the centromere of chromosome 10 persisted (Fig. 3).
Discussion
Although new amphibian genome assemblies have recently been generated (e.g., Bredeson et al. 2024; Dittrich et al. 2024; Holtz et al. 2023; Kuhl et al. 2024), the large size of amphibian genomes and the high cost of high-quality genome sequencing necessitate rapid cytogenetic alternatives for identifying rearrangements in chromosome structure. Using the available sequenced genomes of four African pipid frogs, X. tropicalis (Bredeson et al. 2024; Mitros et al. 2019), X. laevis (Session et al. 2016), X. borealis (Evans et al. 2022), and Hymenochirus sp. (Bredeson et al. 2024) as H. boettgeri, but see Gvoždík et al. (2024), it is possible to design primers for PCR and probes for FISH and test hypotheses as to whether any rearrangements occurred in species that have not yet had genomes sequenced. With the known evolutionary history of genus Xenopus (Evans et al. 2015), it is possible to estimate the dynamics of chromosome evolution, the ancestral chromosome structure, and the timing of rearrangements (Knytl et al. 2017, 2018, 2023). In this study, we used the genomes of X. tropicalis (subgenus Silurana) and X. laevis (subgenus Xenopus) to design FISH probes for a species from subgenus Xenopus, Pygmy clawed frog, X. pygmaeus, to explore orthologous synteny and add to the mosaic of knowledge about evolutionary dynamics of chromosomal rearrangements in Xenopus.
Evolution by genomic rearrangements
The first step was to identify each X. pygmaeus chromosome based on measuring the p and q arms and calculating the l and i values to know which chromosome bears FISH signals. This detailed analysis of the X. pygmaeus karyotype has been performed for the first time, even though J. Tymowska published a karyotype of this species already in 1991.
For exploration of the timing of rearrangements, we included syntenic maps of X. tropicalis, X. mellotropicalis (both subgenus Silurana), X. pygmaeus, and X. laevis (both subgenus Xenopus) (this study; Knytl et al. 2018; Session et al. 2016; Uno et al. 2013). Genes for mapping were selected from the vicinity of already described interchromosomal rearrangements: the translocation (translocation-associated genes) discovered in subgenus Silurana (X. mellotropicalis; Knytl et al. 2017) and the fusion (fusion-associated genes) supposedly widespread in subgenus Xenopus (Session et al. 2016). Furthermore, intrachromosomal rearrangements – inversions were identified in the S-subgenome of X. laevis on chromosomes 2S, 3S, 4S, 5S, and 8S (Session et al. 2016).
Our mapping analysis of translocation-associated genes supported the hypothesis that the translocation between chromosomes 9 and 2 occurred solely in subgenus Silurana (Fig. 4A–B). However, it has yet to be investigated how widespread this translocation is among the different species within Silurana. The crucial species is X. epitropicalis, the sister species of X. mellotropicalis, and thus in what evolutionary period it likely occurred (Knytl et al. 2023).
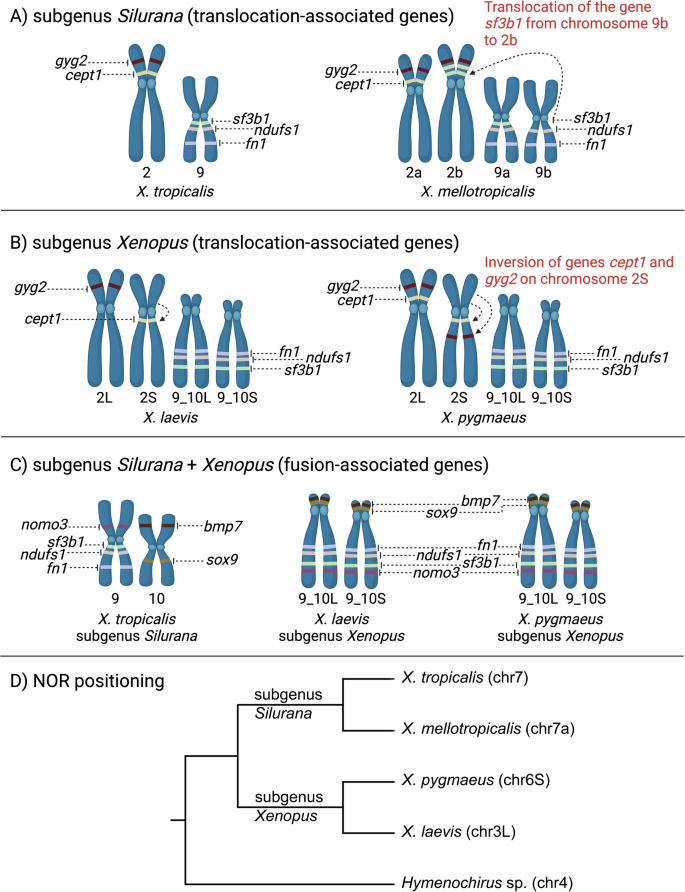
The gene positions in X. tropicalis and X. laevis were taken from genome databases (Bredeson et al. 2024; Session et al. 2016). Gene localizations in X. mellotropicalis and X. pygmaeus were adopted from Knytl et al. (2018) and this study, respectively. Translocation-associated genes (cept1, gyg2, fn1, ndufs1, and sf3b1) are shown in subgenera Silurana (A) and Xenopus (B). A In X. tropicalis (Silurana), genes are considered to have ancestral positions. In X. mellotropicalis, the sf3b1 gene was translocated from chromosome 9b to pericentromeric region of chromosome 2b (indicated by dashed arrow and described in red font). B In X. laevis, translocation-associated genes cept1 and gyg2 were annotated on one homeologous chromosome each, specifically on chromosome 2S and 2L, respectively. The remaining translocation-associated genes fn1, ndufs1, and fn1 were annotated on both homeologous chromosomes 9_10L and 9_10S. In contrast, we mapped all translocation-associated genes on both homeologous chromosomes in X. pygmaeus. In addition, positions of the cept1 and gyg2 genes were inverted on chromosome 2S (indicated by dashed arrows and described in red font). C Fusion-associated genes (fn1, ndufs1, sf3b1, nomo3, bmp7, and sox9) depicted on X. tropicalis chromosomes 9 and 10, and X. laevis and X. pygmaeus chromosomes 9_10L and 9_10S. The order of the fusion-associated genes in these three species revealed that the fusion between chromosomes 9 and 10 is shared in X. laevis and X. pygmaeus. D A schematic phylogenetic tree showing variation in the NOR positioning. Two species from subgenus Silurana (X. tropicalis, X. mellotropicalis) and two species from subgenus Xenopus (X. pygmaeus, X. laevis) are shown for clear understanding of evolution by rearrangements depicted in A, B, and C. Chromosomes in parentheses associated with each species are NOR-carrying chromosomes (this study; Gvoždík et al. 2024; Knytl et al. 2017; Tymowska 1991). Hymenochirus sp. was used as an outgroup. A–C Created with BioRender.com, (D): created with Geneious Prime and modified in Adobe Photoshop.
Importantly, our mapping of cept1 and gyg2 probes revealed the inversion that occurred on chromosome 2S in X. pygmaeus (Fig. 4B). The large inversion was also identified on X. laevis chromosome 2S but not in X. laevis chromosome 2L or X. tropicalis chromosome 2 (Session et al. 2016). However, it was not clear whether the cept1 and gyg2 genes were involved in this inversion. Available genomic data showed the position of cept1 exclusively on chromosome 2S and gyg2 on chromosome 2L in X. laevis. The presence of only the S copy of the cept1 in X. laevis is inconsistent with the hypothesis that the S-subgenome undergoes gene deletions and loses (Session et al. 2016), because the cept1 would has been lost in the L-subgenome. Therefore, the missing cept1.L annotation may be due to a gap or sequencing artifact in the X. laevis genome assembly. To explore whether the cept1 gene was involved in the inversion on X. laevis chromosome 2S, we compared the coordinates of the centromere position on chromosome 2S (54,347,978–55,190,352) (Smith et al. 2021) with the coordinates of the cept1 gene (55,993,167–56,072,139) on the same chromosome (genome database). Consequently, the cept1 gene is situated on the q arm of X. laevis chromosome 2S, as depicted in Fig. 4B, evidencing that cept1 was indeed involved in the inversion. Because our FISH analysis revealed inversion in X. pygmaeus chromosome 2S that is homologous to the inverted region in X. laevis, this suggests that the inversion occurred in a common tetraploid ancestor of X. pygmaeus and X. laevis about 10 Mya (Evans et al. 2015, 2024; Fornaini et al. 2023, for evolutionary relationships see Fig. 4D), or even earlier in a common tetraploid ancestor of X. pygmaeus, X. laevis, and X. borealis or in a diploid ancestor of the S-subgenome (Knytl et al. 2024). However, whether this inversion is also present in other species of subgenus Xenopus remains to be investigated. Identifying its presence in additional species would help to more accurately date when the inversion occurred. Inconsistencies in the number of homeologous cept1 and gyg2 copies detected in X. pygmaeus by FISH and in X. laevis by inspection of the genome database may be caused by high divergence of these fragile regions, allowing enough time for the loss of one copy in X. laevis. Another explanation for this discordance is that both homeologous copies of the cept1 and gyg2 genes are present in the genomes of both X. pygmaeus and X. laevis.
The highest difference in the l and i values between homeologs was observed between X. pygmaeus chromosomes 8S and 8L. This finding highlighted chromosomes 8S and 8L as the most morphologically distinct homeologs in the karyotype. In X. laevis, the greatest divergence in i was also found between chromosomes 8L and 8S (Matsuda et al. 2015). Because both chromosomes 8S of X. pygmaeus and X. laevis include the pericentromeric inversion (this study; Knytl et al. 2024; Session et al. 2016; Uno et al. 2013), this indicates that X. pygmaeus and X. laevis share the same inversion, which likely caused the highest morphological difference between chromosomes 8L and 8S. Inversions in Xenopus appear to be significant drivers of divergent subgenome evolution and the re-diploidization process.
The location of fusion-associated genes in X. pygmaeus corresponds to the location of these genes in X. laevis (Session et al. 2016; Uno et al. 2013). The identical localization of these genes within both species confirms that the fusion of ancestral chromosomes 9 and 10 into chromosome 9_10 most likely occurred in a common diploid ancestor of subgenus Xenopus, before the divergence of the two subgenomes at least 30–35 Mya. The FISH mapping also revealed the fusion points and fate of centromeres in X. pygmaeus (Fig. 4C), which correspond to the same fusion discovered in X. laevis (Session et al. 2016) and X. borealis (Evans et al. 2022), and probably correspond to the fusion in all other species of subgenus Xenopus as all these species have chromosome numbers that are multiples of 18 (Tymowska 1991).
Evolution of ribosomal genes and positions of NORs
The presence of 28S rDNA on one homologous pair of chromosomes in X. pygmaeus confirms the previously proposed hypothesis that one pair of homologous NORs has been lost in a tetraploid species/ancestor of genus Xenopus, since it is generally assumed that both diploid ancestors of allopolyploid species in both subgenera Silurana and Xenopus carried a pair of NORs. Hereafter in the text, one NOR equals a homologous pair of NORs, i.e. one NOR per each haploid complement. However, variation in NOR placement is inconsistent with the hypothesis that the Silurana a- and Xenopus L-subgenomes are more stable and the Silurana b- and Xenopus S-subgenomes tend to be more susceptible to rearrangements (Knytl et al. 2023; Session et al. 2016). Xenopus laevis, X. gilli, and X. petersii (then “X. species nova IX”; all three from the X. laevis species group) have NOR on the p arm of chromosome 3L (Roco et al. 2021; Session et al. 2016; Tymowska 1991; Tymowska and Kobel 1972). Xenopus pygmaeus and X. parafraseri (then “X. fraseri”, re-identified on the basis of the geographic origin “Foulassi, Cameroun”; both species from the X. amieti species group) have NOR on chromosome 6S (this study; Tymowska 1991). NOR in X. clivii (sister lineage to the X. muelleri species group) and X. borealis (X. muelleri species group) was detected on chromosome 4L (Schmid and Steinlein 2015; X. borealis genome database), and in X. muelleri (X. muelleri species group) on chromosome 5L (Schmid and Steinlein 2015; Tymowska 1991). Furthermore, the locations of NORs across subgenus Silurana differ from the locations of NORs in subgenus Xenopus (X. tropicalis has NOR on chromosome 7; X. calcaratus, X. epitropicalis, and X. mellotropicalis on chromosome 7a; Knytl et al. 2017, 2023; Tymowska 1991) and NORs evolved independently in each subgenus (Roco et al. 2021). NOR structures show highly dynamic character and tend to translocate from one chromosome to another across both subgenomes. Since all but one NOR position was identified in the L-subgenome, misidentification of chromosome 6S is possible. We used measurements of the l and i values, which are similar for chromosomes 5L, 5S, 6S and 7L in X. pygmaeus (Fig. 1B, C). An additional mapping marker co-localizing with NOR on the same chromosome is required to accurately identify the chromosome carrying NOR. Also, Tymowska (1991) identified NOR on X. pygmaeus chromosome 6S and therefore we are inclined to conclude that the NORs (not those ancestral ones that have been lost) have changed locations between chromosomes and subgenomes by a jump without prior deletion or duplication. The jumping mechanism supports the hypothesis that losses occurred in the Xenopus S-subgenome. We propose that the ancestral NOR was lost in the S-subgenome, and subsequently, the NOR jumped from the L-subgenome to the S-subgenome, as observed in contemporary X. pygmaeus. It is generally assumed that the jumping mechanism is a horizontal transmission of transposable elements caused by copy-and-paste or cut-and-paste transposition. These elements cause breaks on a chromosome and increase the probability of rearrangement (Castro et al. 2001; Chan et al. 2008; McClintock 1950; Rebollo et al. 2010). A similar mechanism that triggers the rearrangement of small nuclear DNA repeats in genus Hymenochirus was also suggested (Gvoždík et al. 2024). The jumping mechanism was also implicated in the context of horizontal translocation of sex-determining genes (e.g., Tennessen et al. 2018).
Taking the differences in NOR position and origin together, we are unable to clearly identify the ancestral position of NOR in subgenus Xenopus, although the ancestral position in subgenus Silurana is on chromosome 7 (Fig. 4D, Knytl et al. 2017, 2023; Tymowska 1991). Given the same NOR location in X. clivii and X. borealis, we can speculate that the ancestral NOR position in subgenus Xenopus is on chromosome 4L. The latter two species belong to the X. muelleri species group, and X. clivii is one of the most basal lineages of the subgenus. The sequence content of NORs is also worth investigating to find out if and what type of transposable elements surround the jumping NORs in genus Xenopus.
Another important characteristic is the copy number of repeats per locus. The copy number of repeats may be reduced in one subgenome but expanded in another, as proposed for X. laevis by Fornaini et al. (2023). In our focal species X. pygmaeus, we cannot count the number of 28S copies per locus, because its genome has not yet been sequenced. We consider that a low copy number per NOR locus can be undetectable by FISH mapping. The alternative that more NOR loci are present in the genome of X. pygmaeus than detected by our FISH method is less likely because only one NOR has also been identified in the genome of X. laevis (Session et al. 2016), as well as other cytogenetic studies have identified only one NOR in entire genus Xenopus (reviewed in Tymowska 1991). The pattern that only one NOR is present in the whole genome of most frogs, regardless of ploidy level (Gvoždík et al. 2024; Schmid et al. 2015; da Silva et al. 2024; Stöck et al. 2005; Tymowska 1991) indicates complete functional diploidization of these structures in allopolyploids. Exceptions among frogs include tetraploid Odontophrynus americanus (Odontophrynidae) and octoploid Ceratophrys ornata (Ceratophryidae), which show two NORs. The finding of two NORs indicates co-dominant expression of parental NORs and that their genomes have recently arisen from a single ancestral species via autopolyploidization (reviewed in Schmid et al. 2015). The results of the present study are consistent with the allotetraploid origin of X. pygmaeus and the loss of one ancestral NOR.
The 5S rRNA (along with the 5.8S, and 28S rRNAs) forms a large ribosomal subunit, the number of which varies among amphibians, but the location is generally telomeric (Knytl et al. 2017; Pardue 1974; Pardue et al. 1973). Using the FISH method, we found out that all but one X. pygmaeus chromosome carry 5S locus. There are only a few studies in which the 5S rDNA loci have been localized in genus Xenopus. Xenopus laevis has 5S rDNA signals on almost all chromosomes (Pardue et al. 1973) and, in contrast to X. muelleri, which has 5S rDNA locus on chromosome 6L (Schmid and Steinlein 2015). Species of subgenus Silurana have multiple 5S rDNA loci regardless of the diploid and tetraploid ploidy levels (Knytl et al. 2017, 2023). The number of 5S rDNA signals in X. pygmaeus is most similar to that of tetraploid X. laevis and diploid X. tropicalis. Given the high abundance of 5S rDNA loci detected across both Xenopus subgenera, we hypothesize that the presence of 5S rDNA loci on almost all chromosomes have been shared with their common ancestor for at least 45–50 Myr (Feng et al. 2017; Session et al. 2016), and the number of these loci has been duplicated by polyploidization events. However, in some species, such as X. muelleri, massive deletion of 5S rDNA has occurred (Schmid and Steinlein 2015).
Sex chromosomes
All species of genus Xenopus have homomorphic sex chromosomes (Tymowska 1991), making cytogenetic investigation of sex chromosomes challenging. We could not identify the sex in our individuals, because we prepared chromosomes from young tadpoles. We analysed four individuals and found no differences in chromosome structure and morphology that would have indicated heteromorphy of sex chromosomes, thus confirming their homomorphy. Xenopus pygmaeus has chromosome 8L as a sex chromosome containing a sex-linked locus, which according to the coordinates of the X. laevis reference genome is located at 117–135 Mb, representing a telomeric region (Evans et al. 2024). None of the genes we mapped on X. pygmaeus chromosomes were situated on chromosome 8L except for the 5S locus. While the 5S locus on chromosome 8L mapped to the telomere, there is no indication that this 5S locus is associated with sex, given the presence of multiple 5S rDNA signals throughout the X. pygmaeus genome.
Conclusion
Genus Xenopus is an exceptional model for evolutionary and genetics research due to its wide range of diverse genomic characteristics, such as one of the highest ploidy-level variations in animals (Tymowska 1991) and high variability in sex determination mechanisms (Evans et al. 2024; Furman et al. 2020; Song et al. 2021). Such variability can typically arise, for example, through various modes of asexual reproduction such as parthenogenesis (Dedukh et al. 2022), gynogenesis (Knytl et al. 2022), or hybridogenesis (Dedukh et al. 2020). However, none of these asexual modes of reproduction have been described in genus Xenopus. Therefore, there must be another mechanism that explains the exceptional genomic variation in these frogs. The most likely mechanism driving ploidy-level variation is hybridization between divergent ancestors, a hypothesis that has been repeatedly postulated and evidenced (e.g., Evans et al. 2005, 2015; Knytl et al. 2023; Session et al. 2016). However, the occurrence of natural hybrids is rare and documented only in closely related species (Kobel et al. 1981). In the present study, we found and highlighted that NORs in genus Xenopus are dynamic jumping structures and, interestingly, their number does not reflect ploidy level, as all species studied have a single NOR. Additionally, different tetraploid species have NORs on non-homologous chromosomes, demonstrating the jumping phenomenon. Nevertheless, some consistency in the NOR location is evident within subgenus Silurana and species groups of subgenus Xenopus, i.e. closely related species. The number and location of NORs in species with ploidy levels higher than tetraploid also need to be investigated. Interestingly, interchromosomal rearrangements, aside from the jumping NORs, are rare in genus Xenopus.
Responses