Flexible, multimodal device for measurement of body temperature, core temperature, thermal conductivity and water content

Introduction
Body core temperature, as an important physiological indicator for self-health monitoring and medical diagnosis1,2,3,4,5, has attracted much attention due to its high sensitivity to fever symptoms caused by inflammation such as COVID-196,7,8,9,10. Body core temperature refers to the temperature of the internal thoracic cavity, abdominal cavity, and central nervous system of the body, which is relatively stable and higher than the body surface temperature. The ideal sites for clinical monitoring of body core temperature include bladder11, nasopharynx12,13, pulmonary artery14, tympanic membrane15,16, oral cavity17, esophagus18,19, armpit20, rectum21,22, etc., and the corresponding measuring instruments contain implantable temperature sensor23,24,25, lanthanide luminescence nanothermometer26, CMOS temperature sensor27, thermocouples28,29, thermistors30,31,32 and optical fiber thermometers33, which are all invasive examination or inserting measurement equipment. Obviously, the above methods are not suitable for real-time monitoring of body core temperature in daily life. The proposed non-invasive measurement methods include photoacoustic method34, infrared thermometry35,36,37, ultrasonic transmission method38,39, nuclear magnetic resonance method40, microwave radiometry method41,42, and heat flux method43, among which the first five methods need to be equipped with a large volume of auxiliary instruments and thus are not applicable for daily continuous monitoring. In a marked contrast, the heat flux method only requires a small volume of auxiliary instruments and thus is suitable for wearables. With the aid of the special design of the sensor, the heat from the deep tissues of the skin can only be conducted into the sensor along a direction perpendicular to the body surface, and the corresponding temperature gradient is formed along that heat conduction channel. Such methods include single-heat-flux method43,44, double-heat-flux method45,46,47, and zero-heat-flux method48,49,50,51. The single-heat-flux method assumes that the skin thermal conductivity is constant44, and thus generally causes a large measurement error as individuals are with large differences in skin status. The dual-heat-flux method can directly extract the body core temperature by comparing the temperature gradients in two heat conduction channels with different heights, and thus the measurement result does not rely on the error in estimated thermal conductivity47. Actually, the accuracy in the measurement of body core temperature by this method is determined by the uni-directional heat conduction implementation of two heat conduction channels, which suggests the sensor size needs to be large enough and thus is not easy to wear. In addition, it is difficult to get the accurate subcutaneous depth of detection by using the dual-heat-flux method, and thus this method does not have a clear physical significance. The zero-heat-flux method counteracts the heating effect from the deep skin tissue by constructing an equal heat flux in the opposite direction, so that the bottom surface temperature of the heat conduction channel is equal to the core temperature50. However, the establishment of reverse heat flux has a large error and it is time-consuming in complex environments, and thus it is not suitable for real-time monitoring of body core temperature in subjects with continuous movement. In general, it is difficult for the existing devices to accurately and continuously monitor the body core temperature, due to their invasive or motion-restricted working principles. Therefore, a new type of wearable device that can accurately and continuously monitor the body core temperature is urgently needed.
In this work, based on the single-heat-flux method, a wearable flexible device integrated with multimodal sensors consisting of seven pairs of ring-arranged temperature sensors, one thermal conductivity sensor located in the center, data processing module and wireless communication module was developed. The thermal conductivity sensor can portably measure the thermal conductivity of human skin and deduce the thermal wave penetration depth, and thus can accurately and continuously measure the body core temperature with corresponding subcutaneous depth for various subjects in different conditions. The continuous monitoring of the body core temperature for 24 h and the portable monitoring of the skin thermal conductivity were realized using this device. The feasibility and effectiveness of the device were evaluated by the skin-like material test and the population test. Owing to the ultrathin design of the device and the annular distribution design of the temperature sensors, a uni-directional heat conduction within the device is achieved. Skin-like material test has demonstrated that this device is comparable in accuracy and stability with commercial instruments that is based on invasive or motion-restricted working principles. Moreover, the accurate measurement of the skin thermal conductivity is achieved through the calibration of heat flux distribution coefficient and the high responsiveness of the temperature measurement is ensured by the conformal attachment. The simultaneous monitoring of the same subject for 8 h using our device and the axillary temperature patch showed that the temperature trends of the two devices were mostly in good agreement, and our device exhibited higher responsiveness than the axillary temperature patch.
Results
Flexible single-heat-flux device
Figure 1a illustrates a typical scenario for wearing the flexible single-heat-flux device around a subject’s wrist, which can simultaneously monitor the body core temperature, surface temperature and skin thermal conductivity, and skin water content. The bottom of the device is intimately contacted with the wrist skin while its top is exposed to the environment. As shown in Fig. 1b, the device consists of a top layer, a bottom layer and a partition layer in the middle. Both the upper and the lower layers are 0.5 mm-thick polydimethylsiloxane (PDMS) films including seven pairs of annular distributed platinum temperature sensors (diameter: 1 mm, thickness: 100 nm) and one platinum thermal conductivity sensor in the center (diameter: 3 mm, thickness: 100 nm). The PDMS films were pre-treated with parylene-c to avoid the platinum pattern cracking during deposition process52. The layout of the temperature sensors effectively expanded the temperature monitoring region, and thus realized the average temperature measurement in a 10 mm-diameter circular area, which ensures the single-heat-flux assumption. Increasing the measurement area and decreasing the overall thickness of the device, i.e., reducing the height–radius ratio (h/R) of the device, can induce the heat from the skin tissue to be approximately conducted only in the direction perpendicular to the skin, thereby improving the accuracy of core body temperature measurement. Such flat shape of the top and bottom layers (total diameter of 20 mm, total thickness: ~2 mm) strongly promoted the uni-direction conduction of heat from the deep skin tissue into the device, and thus satisfies the single-heat-flux assumption. The core body temperature measurement simulations based on the finite element method was done to prove the above deduction. As shown in Supplementary Fig. 9a, six single-heat-flux sensors with the same radius (10 mm) and different heights were modeled to simulate the core body temperature measurement. Ttop and Tbottom were calculated by extracting the temperature at the seven temperature sensors and the thermal conductivity sensor in the center, and the simulation of the core body temperature measurement was completed by using Eq. (4). As shown in Fig. S9b, with the height–radius ratio (h/R) decreases, i.e., the device becomes more flattened, the core body temperature measurement error gradually decreases and approaches 0. The partition layer is 1 mm-thick PDMS molded by liquid PDMS encapsulation process, which can greatly reduce the thermal contact resistance between layers to achieve a rapid thermal equilibrium between the temperature sensors and the skin. The thermal equilibration time required is ~25 s when the temperature sensor is first attached to human skin, as shown in Supplementary Fig. 1. This is the key to ensure the high responsiveness of the temperature sensors. The existing thermal conductivity measurement device53,54,55 in the asymmetric scene usually is a single-layer device, which is directly attached to the subject’s skin and the thermal conductivity was measured with the aid of the joule heating effect of the device. As shown in Supplementary Fig. 10, this type of device was replicated to carry out the thermal conductivity measurement of skin-like materials, and after attaching the single-layer device to the sample, the device will be exposed to the external environment. Multiple thermal conductivity tests on the same material show that the measurement results are less consistent. Taking polyimide (PI) as an example, the three temperature-rise curves generated by the three measurements did not coincide well (Supplementary Fig. 10), and the thermal conductivity were measured to be 0.40, 0.54, and 0.35 W/m·K, respectively. It is speculated that the heat generated from the device during the measurement process is also transferred to the external environment, and the change in ambient convection intensity and temperature causes the share of heat transferred to the external environment in the total heat to change constantly, and thus the difference among the results of multiple measurements for the same sample is so large. The above problems can be overcome by covering a single layer of insulation material on the top of the single-layer device to form a double-layer device. As shown in Fig. S11, the thermal conductivity of the silicone rubber at different ambient temperatures shows that the temperature-rise curves coincide well, which indicates that the double-layer device has strong resistance to ambient temperature interference. Therefore, a 4-mm diameter through hole was dug in the center of the partition layer, which forms a thin air gap on the top of the lower layer thermal conductivity sensor to inhibit the back-conduction of heat. This design notably improved the measurement accuracy in asymmetrical scenarios and the robustness to interference from the external environment.

a Illustration of the wearable scenario for the device. b Detailed structure of the multimodal sensors and the heat transfer route for the temperature sensor. c Skin-like PDMS measurement scenario to calibrate the device. d Comparison between the measured core temperature of skin-like PDMS by our device and the true core temperature, and the measured surface temperature. e The temperature-rise signals versus time for the thermal conductivity sensor measuring four skin-like materials. f Signal acquisition and processing units of the device and the detailed circuit components.
To calibrate our device, a skin-like PDMS sample was measured on a hot plate with continuously increasing temperature from 31 to 39 °C implemented by a PID control module, mimicking the varying body core temperature (Tcore), as shown in Fig. 1c. Two thermometers were used to obtain the hot plate temperature. It is clearly seen that the measured core temperature (Tcore-esti) for the PDMS by our device just have <±0.1 °C deviation from true core temperature when the detection depth is 4 mm (Fig. 1d). More skin-like samples, i.e., nylon 66 (PA66), polyimide (PI) and high-density polyethylene (HDPE) with validated thermal conductivity by Hot-Disk method (TPS 2500S, Goteborg, Sweden) and validated heat capacity by Differential Scanning Calorimeter (DSC, TA SDT-Q600) were utilized to test the function of thermal conductivity measurement of our device. The above four materials were chosen because their thermal conductivity are in the range of 0.18–0.52 W/m·K, which is consistent with the thermal conductivity distribution range of human skin56,57,58. In order to verify the measurement accuracy of our device on the skin thermal conductivity, only the thermal conductivity distribution range is adopted as the selection criterion for skin-like materials, and other materials with thermal conductivity in the range of 0.18–0.52 W/m·K can also be selected as skin-like materials. The rubber sheet used by Huang et al.59 is close to the PDMS selected in our paper in terms of hardness and thermal conductivity. As shown Fig. 1e, the temperature-rise signals of the thermal conductivity sensor can be clearly discerned for the four materials with slightly different thermal conductivities (0.185–0.496 W/m·K), indicating our device has good sensitivity to the skin thermal conductivity for individuals.
The device also contains a flexible printed circuit (FPC) cable and a signal acquisition & control board composed of an upper control panel and a lower measure panel (Fig. 1f). The upper control panel is integrated with ESP32 SOC module, power supply module, USB to serial port module, display panel module and IO Ports module. The ESP32 SOC module is responsible for switching between the body core temperature measurement mode and the thermal conductivity measurement mode, the wireless transmission of the measurement signal and the calculation of the collected data. The power supply module consists of a lithium rechargeable battery (3.7 V, 1500 mAh) which supplies the power to the entire board. The display panel module is responsible for the real-time display of the collected data. The IO Ports module is responsible for the data communication between the upper control panel and the lower measure panel. The lower measure panel is integrated with multiplexer module (4 × TMUX6208), low dropout regulator (LDO), operational amplifier (OPA), analog to digital converter (ADC, ADS1220), current supply module and IO ports module. The multiplexer module consisting of four TMUX6208 is responsible for the sampling sequence control of seven pairs of annular distributed temperature sensors to perform the point-by-point measurement of body surface and core temperatures. The current source module provides 0.1 mA and 3 mA precise currents. The LDO that can stabilize the input voltage to a constant output voltage is applied to ensure the signal stability. The ADC module is responsible for the measurement of voltage signal. The OPA that can amplify voltage signals and the ADS1220 that can convert an input voltage signal into an output digital signal are adopted to complete the voltage acquisition.
Working principle
Combining the plane heat source method for accurately measuring the skin thermal conductivity, the device is based on a modified single-heat-flux method to extract the body surface temperature (Tbottom, Fig. 1d) and core temperature (Tcore-esti, Fig. 1d) by monitoring the temperatures of the bottom layer (Tbottom) and the top layer (Ttop). Figure 1d demonstrated that Tbottom is significantly lower than Tcore-esti, and the variation amplitude of Tbottom is smaller than Tcore-esti. In addition, the variation of Tbottom lags slightly behind Tcore-esti, which indicated that Tcore-esti could reflect the change of body core temperature more timely and accurately comparing with Tbottom.
As shown in Fig. 1b, if the heat flow from the deep skin tissue is perfectly perpendicular to skin surface, according to the in-series thermal resistance network theory, the relation among the above-mentioned three temperatures can be described by:
where,
where R denotes the thermal resistance, ttissue denotes the thermal wave penetration depth in the subcutaneous tissues, κtissue denotes the thermal conductivity of the skin, tpartition is thickness of the partition layer, κpartition is the thermal conductivity of the partition layer. Then, Tcore can be directly estimated by using Ttop and Tbottom:
where g is the ratio of Rtissue to Rpartition.
The experimentally obtained signal is the voltage (U) instead of the temperature, which needs to be converted by:
where UT=T0 denotes the initial voltage of the sensor at the temperature T0, α denotes the temperature coefficient of resistance for the sensor. The linear correspondence relationship between the temperature (T) and voltage (U) is shown in Supplementary Fig. 2.
As mentioned above, the accuracy of the single-heat-flux method for body core temperature measurement relies on the accurate measurement of κtissue and the probing depth ttissue for varying skin conditions. To achieve this, the heat flux distribution coefficient (A1) was introduced to describe the real share of heat flux penetrates vertically into the skin (Supplementary Fig. 3). Since the diameter of the thermal conductivity sensor is much smaller than the side length of the four samples (~50 mm), the thermal conductivity sensor can be regarded as a point heat source with a constant power, and thus its temperature rise can be described by:
where ΔT* denotes the temperature rise of the thermal conductivity sensor, A2 is the thermal penetration depth, Q is the heating power of the sensor, τ is the heating time, ρskincp,skin is the heat capacity of the skin. By performing the least-square fitting of the temperature-rise data of the thermal conductivity sensor with the predication from Eq. (6), κtissue and A2 for the four above-mentioned skin-like materials can be obtained.
The lsqcurvefit function in MATLAB was adopted for the nonlinear fitting of the temperature-rise time curve. The temperature-rise equation (Eq. (6)) of the point heat source with the heat flux distribution coefficient A1 was used as the fitting equation. The thermal penetration depth A2, the thermal conductivity κfit and the volume-specific heat capacity ρcp of the sample to be measured were selected as the parameters to be fitted. The initial value of the thermal penetration depth A2 was 0.01 m, and the upper and lower limits were set to [0.001, 0.1]. The initial value of thermal conductivity κfit was 0.3 W/(m·K), and the upper and lower limits were set to [0.01,1]. The initial value of the volume-specific heat capacity ρcp was 133,765 J/(m3·K), and the upper and lower limits were set to [105,108]. When the change of the residuals in the fitting process is less than the specified tolerance of 10−6, the output parameters to be fitted are regarded as the final result.
Measurement flowchart
In the actual human skin test, the thermal conductivity measurement mode was first used. In brief, after a 3 mA current was applied to the thermal conductivity sensor for 7 s, the ADC voltage acquisition module began to record the voltage of the sensor, and the deduced temperature rise of the sensor versus time curve was used to extract the skin thermal conductivity κtissue and the corresponding thermal wave probing depth A2. Then the thermal conductivity sensor was naturally cooled down for 5 min to avoid interfering with the subsequent temperature measurement. In the temperature measurement mode, the 0.1 mA current was applied sequentially to the seven pairs of sensors, and the ADC voltage acquisition module synchronously measured the corresponding voltage one by one, and then the voltage was converted to the temperature signals by Eq. (5).
As shown in Fig. 2a, the total procedures for extracting the thermal conductivity of the skin can be described as: (1) Acquiring the temperature rise versus time curve; (2) Using the final temperature-rise data ΔTend to pre-specify a heat flux distribution coefficient A1 according to the A1 selection database (Fig. 2d); (3) Based on the specified A1, the temperature rise versus time was least-square fitted by using Eq. (6), obtaining the thermal conductivity κfit, A2 and skin thermal diffusivity afit; (4) Comparing κfit with the reference value, if the difference is large, reducing A1 and calculate again until the difference is less than 0.001 W/(m⋅K); (5) When the best κfit was found, the corresponding thermal penetration depth A2 was also determined.
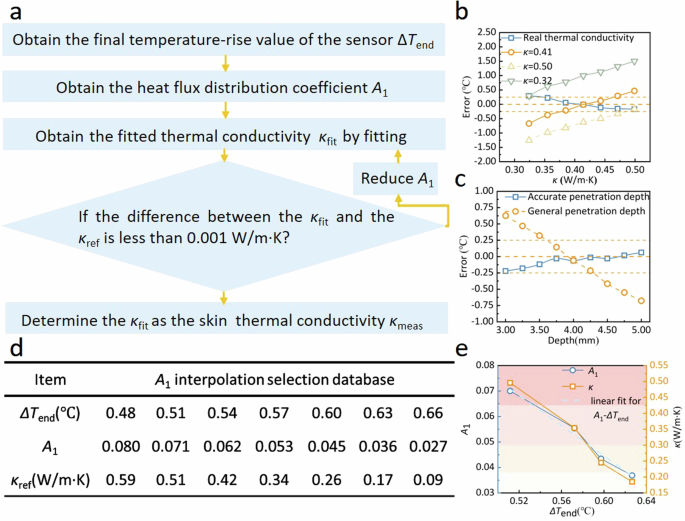
a Iterative solution algorithm for heat flux distribution coefficient A1. b Comparison of the effect of true and empirical skin thermal conductivity on the measurement error of the body core temperature (simulation). c Comparison of the effect of true and general probing depth on the measurement error of the body core temperature (simulation). d A1 interpolation dataset. e The linear correspondence between the heat flux distribution coefficient A1, the thermal conductivity of the skin-like material κ and the final value of temperature rise ΔTend.
Furthermore, the simulation based on finite element method was adopted to verify the advantages of this flexible single-heat-flux device with real-time thermal conductivity measurement function over the counterpart. Figure 2b compares effect of true and empirical skin thermal conductivity on the measurement error of the core body temperature according to the finite element analysis, in which the temperature of the skin bottom is set as a constant (37.5 °C) as the core body temperature Tcore, and the Error is defined as the difference between Tcore-esti and Tcore, so the trend of Error is equivalent to that of Tcore-esti. Only Tcore-esti obtained by substituting the actual thermal conductivity in Eq. (4) shows a decreasing trend in Fig. 2b, because the skin thermal resistance Rtissue gradually decreases with the increase of the actual thermal conductivity κtissue, leading to a gradual decrease in the thermal resistance ratio g (g = Rtissue/Rparti). Therefore, according to Eq. (4), it can be seen that Tcore-esti decreases gradually with the decrease of g. Additionally, Tcore-esti obtained by substituting the fixed thermal conductivity in Eq. (4) shows an upward trend in Fig. 2b. Taking κ = 0.32 as an example, 0.32 is still used to calculate the skin thermal resistance Rtissue when the actual skin thermal conductivity gradually increases from 0.32 to 0.50 W/m·K, which actually underestimates the skin thermal conductivity and thus overestimates the skin thermal resistance. Therefore, the thermal resistance ratio g is overestimated. With the increase of the actual skin thermal conductivity, the degree of overestimation of g is further expanded, and thus the curve corresponding to κ = 0.32 shows an upward trend.
The same is true for the curve trend analysis corresponding to κ = 0.41 and κ = 0.50, which is also due to the overestimation of the thermal resistance ratio g caused by the underestimated thermal conductivity value substituted in Eq. (4), resulting in an upward trend of the curve. It is clearly seen in Fig. 2b that using the true thermal conductivity instead of the empirical one can effectively reduce the measurement error for the body core temperature, and the over-high and over-low empirical thermal conductivity would result in a huge measurement error.
In addition, using accurate penetration depth instead of the general one can also effectively reduce the measurement error of the body core temperature (Fig. 2c). For the four skin-like materials with known thermal conductivity κskin, volume-specific heat capacity ρskincp,skin and thickness A2, four temperature-rise curves were obtained by applying the point heat source of known power Q to the four materials (Fig. 1e), and the heat flux distribution coefficient A1 of each material can be solved by fitting these four curves according to Eq. (6). As shown in Fig. 2e, A1 decreases slowly with the decreasing thermal conductivity of the sample κref, and κref decreases slowly with the increasing final temperature-rise value ΔTend. There is obvious linear dependence on A1 of ΔTend and obvious linear dependence on on ΔTend of κref. After the linear correspondence was interpolated to enrich the dataset, A1 database was obtained (Supplementary Table 1).
As shown in Fig. 2e, the relationship between the final temperature rise (ΔTend) and the thermal conductivity of the sample (κ), and between ΔTend and A1 are not sufficiently linear. Hence, there is still a certain deviation between the first fitting thermal conductivity κfit and the reference thermal conductivity value κref corresponding to A1 obtained according to the interpolated table (Supplementary Table 1). To address the above issue, an iterative algorithm was introduced to gradually clarify the corresponding relationship among ΔTend, κ and A1. A1 has a step size of 10−4 in the iterative program. The iterative program finds the best correspondence among ΔTend, κ and A1 by fine-tuning A1. When the difference between κfit and κref is less than 0.001 W/m· K, it is indicated that the optimal A1 and κref corresponding to ΔTend have been found by iterative fitting algorithm, and the κfit at this time is the thermal conductivity value of the sample to be measured.
The thermal conductivity of the four skin-like materials was measured according to the above process, and the results are summarized in Table 1. It is clearly seen that A1 is linearly dependent on the thermal conductivity of the material. Therefore, a linear correlation between A1 and κtissue was established, which greatly improved the conventional plane heat source method60,61 in the asymmetrical scenarios. The thermal conductivity of the four skin materials covers the thermal conductivity range of human skin, and the thermal conductivity measurement error of our device is within 5%.
Theoretically, this device can be applied to the thermal conductivity measurement of any material with the thermal conductivity range of 0.12–0.59 W/m·K (Supplementary Table 1) with a resolution of ~0.01 W/m·K, which has covered the range of possible values of human skin thermal conductivity. The A1 and ΔTend of any material of unknown thermal conductivity within this range will not exceed the range of values listed in the ΔTend–A1–κ interpolation table. When the device is applied to a material with unknown thermal conductivity, the iterative program will first find A1 based on the ΔTend measured on the unknown material, then fine-tune A1 and fit the temperature-rise curve constantly until κfit is close to a certain κref in the ΔTend–A1–κ interpolation table, and finally output the κfit as the final measurement result. Therefore, this device can accurately measure the skin thermal conductivity of different subjects, as well as the change in the skin thermal conductivity over time of the same subject.
Anti-environmental interference ability
To analyze the anti-environmental interference ability of the device, finite element method (FEM) simulation based on COMSOL software was carried out. As shown in Fig. 3a, the skin thickness was set to 5 mm in the model, and the body core temperature Tcore at the bottom of the model was set to 37.5 °C. Varying boundary conditions (e.g., convective heat transfer coefficient and ambient temperature) and different skin property parameters (e.g., thermal contact resistance between the skin and the device, thermal conductivity of the skin, blood perfusion rate and temperature in the skin) were set individually to simulate different scenarios in practical applications. Simulation results indicate that large-scale change in the thermal contact resistance between the skin and the device (10−7–10−4 K·m2/W), the convective heat transfer coefficient (10–25 W/m2·K), the ambient temperature (20–36 °C), the blood perfusion rate (0.0018–0.004 s−1) and the blood temperature (36.8–38.0 °C) would not induce large measurement error for the body core temperature, which can be controlled within ±0.2 °C for our device (Fig. 3b–f), and thus it is suitable for daily practical scenarios.
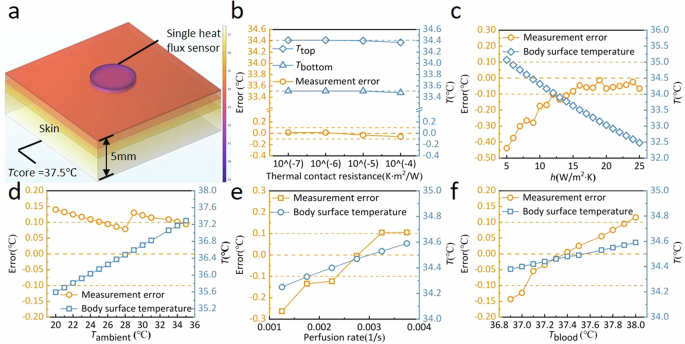
a Physical model for the body core temperature measurement based on the single-heat-flux method. b Effect of thermal contact resistance on the measurement error of the body core temperature. c Effect of convective heat transfer coefficient at the skin surface on the measurement error of the body core temperature. d Effect of ambient temperature on the measurement error of the body core temperature. e Effect of blood perfusion rate in the skin on the measurement error of the body core temperature. f Effect of perfused blood temperature in the skin on the measurement error of the body core temperature.
Analysis of factors affecting measurement accuracy
Effect of thermal wave probing depth
To explore how the thermal wave probing depth affects the measurement accuracy on the body core temperature, PDMS blocks with varying thicknesses were employed to mimic different probing depths. The PDMS blocks were placed onto a hot plate with controllable temperature, while two thermos-sensors were placed onto the bottom of the block to monitor the true core temperature Tcore (Fig. 1c). Our device was attached to the top of the PDMS blocks to get Tcore-esti according to Eq. (4). For the 4 mm-thick PDMS, the measurement error (Tcore-esti − Tcore) ranges from 2.37 to 2.49 °C as the hot plate slowly warms up to provide a core temperature from 31 to 39 °C (Supplementary Fig. 4).
Since the 10-nm-thick platinum layer that acts as a temperature sensor is deposited on a flexible substrate, a slight bending of the substrate causes the platinum layer pattern to stretch and leads to a change in the resistance value of the device. The temperature measurement component of this device can be divided into two parts: upper device and lower device. The upper and lower devices are separately attached to the temperature-controllable hot plate to establish a linear relationship between the resistance value and the temperature value of the device, and the upper and lower devices are naturally tiled on the hot plate at this time. The accuracy of the temperature measurement of the upper device cannot be guaranteed if the above calibration process is carried out after the upper and lower devices are packaged. However, when the upper and lower devices are stacked and then encapsulated by PDMS, the upper and lower devices are slightly bent due to the polycondensation of the PDMS when it solidifies from a liquid to a solid state. Due to the small overall thickness of the stacked devices (~2 mm), the bending degree of the upper and lower devices is approximately the same, which results in the resistance values of the upper and lower devices increasing by about 18 Ω (total resistance is ~3000 Ω) relative to the natural tiling state on the hot plate. It can be seen that the temperature measurement deviation of the upper and lower devices is caused by the variation of resistance introduced by the package according to Eq. (5), and the resistance variation of the device does not change after the completion of the package anymore. Therefore, only one time of correction is required to correct the temperature measurement deviation, and then there is no need to correct it again. Since the pressure of the device remains constant, the deviation of Ttop and Tbottom can be regarded as equal. Then the deviation of the term g(Tbottom − Ttop) is canceled out, the deviation of core temperature only originates from Tbottom. Therefore, a correction of −2.43 °C was applied to all Tcore-esti subsequently to correct the intrinsic deviation originating from Tbottom. After applying that correction, the core temperature measurement error is within ±0.1 °C for 4.04-mm-thick PDMS block.
As shown in Fig. 4b, a data point is zoomed in to illustrate the error bar, and the standard deviation of the error data for all of five body core temperature measurements in a stable environment is less than 0.05 °C (Fig. 4b–g).
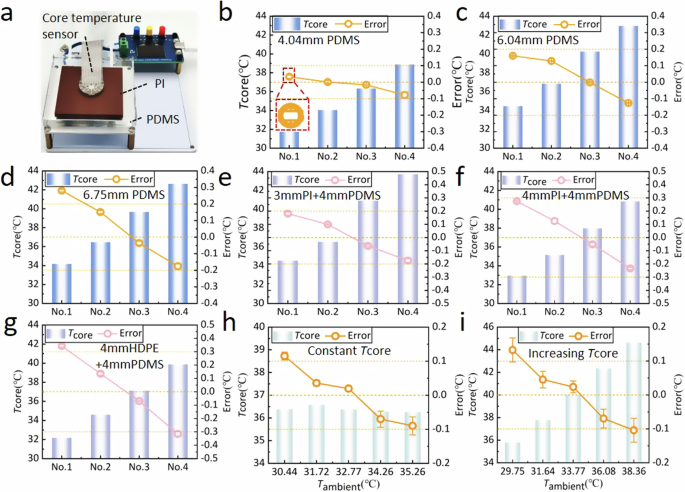
a Core temperature measurement experiment bench of skin-like materials. Measurement error of (b) 4.04-mm-thick PDMS material, (c) 6.04-mm-thick PDMS material, and (d) 6.75-mm-thick PDMS material under different core temperature. Measurement error of (e) 4.04-mm-thick PDMS + 3-mm-thick PI materials, (f) 4.04-mm-thick PDMS +4-mm-thick PI materials, and (g) 4.04-mm-thick PDMS + 4-mm-thick HDPE materials under different core temperature. Measurement error of 4.04-mm-thick PDMS material for (h) constant core temperature and (i) increasing core temperature under different ambient temperature. (The x axis of (b–g) only represents the order of experiments, and the temperature of the hot plate Tcore is changed for each experiment. The x axis of (h, i) represents the different ambient temperature, with each experiment changing the ambient temperature and the hot plate temperature Tcore.).
Similarly, for the 6.04 mm-thick and 6.75 mm-thick PDMS blocks, the core temperature measurement error of our device is within ±0.15 °C and ±0.25 °C as Tcore increases continuously from 34 °C to ~43 °C (Fig. 4c, d). This small measurement error indicate that our ultrathin design of the device (2 mm thick) and the annular distribution design of seven pairs of temperature sensors effectively ensures a uni-directional heat conduction within the device. Since the heat from the hot plate was no longer uni-directionally conducted with the increasing thickness of the material, the core temperature measurement error increased gradually with the increasing thickness of the material.
The Tcore test range in the above measurements is generally between 33 and 42 °C, which has covered the range of possible core body temperature values, so this device can ensure the accuracy shown in Fig. 4 when used for body temperature measurement. It is to be noted that this device is not intended for core temperature measurement other than the human body.
Effect of skin thermal conductivity
To reveal the influence of the skin thermal conductivity on the measurement accuracy of body core temperature, three dual-layer material, e.g., 4 mm PDMS + 3 mm PI composite (representing typical low skin thermal conductivity: 0.32 W/m·K), 4 mm PDMS + 4 mm PI composite and 4 mm PDMS + 5 mm HDPE composite (representing typical high skin thermal conductivity: 0.48 W/m·K), were used as skin-like materials. The core temperature measurement error for the three materials are within ±0.2 °C, ±0.3 °C, and ±0.40 °C as the core temperature Tcore increases continuously from ~32 to ~44 °C (Fig. 4e–g).
Generally, the measurement error of the above dual-layer materials was greater than the pure PDMS, owing to the fact that the overall thickness (≥7 mm) is larger than the pure PDMS. If the thickness of the upper layer increases to a certain extent (>3 mm), the measured thermal conductivity can only reflect the thermal conductivity of the upper layer material which is directly in contact with the device, and thus fails to accurately characterize the equivalent thermal conductivity of the upper and lower layer materials. Actually, the total thickness of the human wrist skin is less than 3 mm. Therefore, according to the measurement results of “4 mm thick PDMS + 3 mm thick PI”, our device can ensure a small measurement error within ±0.2 °C for body core temperature by in-invasive contacted with the human wrist.
Effect of ambient temperature
To explore the effect of varying ambient temperature, the skin-like materials were placed onto a larger temperature-controllable hot plate and completely covered with a plastic incubator to create a locally temperature-controlled environment (Supplementary Fig. 5). As shown in Fig. 4h, the measurement error of the core temperature by using this device can be controlled within ±0.12 °C when the ambient temperature rises from 30.5 to 35 °C. When the core temperature Tcore gradually increased from 36.1 to 44.2 °C and local ambient temperature gradually increased from 29.8 to 38.4 °C, the measurement error of the core temperature can be controlled within ±0.15 °C (Fig. 4i). The temperature of the skin-like material bottom is set as a constant (36.5℃) as the core body temperature Tcore (Fig. 4h), and the Error is defined as the difference between Tcore-esti and Tcore, so the trend of Error is equivalent to that of Tcore-esti and Tcore-esti decreases as the ambient temperature increases as shown in Fig. 4h. This is because the increased ambient temperature will slightly increase the upper temperature of the sensor Ttop. Therefore, Tcore-esti calculated according to Eq. 4 shows a decreasing trend as Ttop increases. However, as long as the ambient temperature is lower than Tcore, Error caused by the ambient temperature will be controlled within a reasonable range (Fig. 4i).
In Fig. 4h, i, as the ambient temperature increases, there is a trend of the error becoming more negative. Therefore, a larger range of ambient temperatures have been tested. This will give a better understanding of the device’s performance. Therefore, the core temperature measurement experiment of skin-like materials at an ambient temperature of 0–40.5 °C was supplemented. As shown in Supplementary Fig. 12, using 10 mm-thick white silica gel with thermal conductivity of 0.52 W/m·K as the skin-like material, the core temperature measurement error of our device can be controlled within the range of ±0.25 °C as the ambient temperature changes in the range of 0–40.5 °C. When the ambient temperature varies in the range of 0–35.5 °C, Tbottom is greater than Ttop, and the core temperature is calculated using Eq. (1). When the ambient temperature changes in the range of 36.8–40.5 °C, Ttop is greater than Tbottom, because the ambient temperature is already greater than the hot plate temperature (~36.5 °C). In this case, the hot plate to be measured becomes the low-temperature side, and the ambient temperature becomes the high-temperature side, so the conjugate form of Eq. (1) is listed to calculate the core temperature (Eq. (7)). It can be seen that our device is highly resistant to interference caused by changes in ambient temperature, so the obvious response of the device to changes in environmental conditions is more reflective of the real deep body temperature changes of the wrist, rather than the unreliable body temperature results affected by changes in ambient temperature.
Continuous monitoring of body core temperature
As shown in Fig. 5a, the signal acquisition & control board was worn on the subject’s upper arm, and the sensor group was worn on the subject’s wrist to continuously monitor the body core temperature at that site for about 8 h, during which the axillary temperature patch was attached to the subject’s armpit for synchronous monitoring of the armpit temperature. If the sensor comes off the wrist, the device will not be able to accurately measure the skin temperature, resulting in significant deviations in core temperature. To prevent this, it is common to use tape to secure the device to the wrist during the human test to simulate the binding effect of a watch wristband on the device. Because the tape exerts a certain amount of pressure on the device to squeeze out the air between the skin and the device as much as possible, the effect of air on the measurement has been greatly reduced. The activity trajectories of five subjects include: (1) sit quietly in the laboratory for 3 h, (2) walk outside for 30 min, (3) return to the laboratory and sit quietly for 3 h, (4) walk outside for 30 min, (5) return to the laboratory and sit quietly for 30 min. Although the subjects were asked to keep the axillary temperature patch clamped as tightly as possible, it was inevitable that the subjects would unconsciously unclamp the axillary temperature patch during this long time test, resulting in a temperature drop, as reflected by a sudden temperature change in the patch temperature curve that was not captured by the single-heat-flux sensor at the wrist. Similarly, our device can sensitively capture the temperature drop at the wrist caused by central air conditioning or fan blowing in the laboratory, while axillary temperature patch was difficult to reflect the influence of short-term body surface convection on body surface temperature.
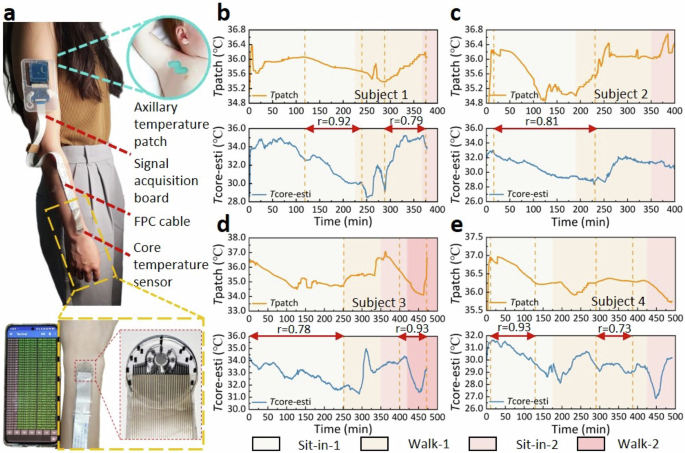
a Schematic diagram of the subject wearing the flexible single-heat-flux device and axillary temperature patch. The simultaneous monitoring for 8 h through the flexible single-heat-flux device and the axillary temperature patch on (b) Subject 1, (c) Subject 2, (d) Subject 3, and (e) Subject 4.
As shown in Fig. 5b, c, synchronous monitoring of Subject 1 and 2 for ~8 h showed that the evolutional trends of the body core temperature measured by our device and axillary temperature patch were generally in good agreement, with correlation coefficients r of 0.92 (subject 1 during 118–240 min) and 0.81 (subject 2 during 15–220 min), respectively. During the underground laboratory sit-in stage, both devices demonstrated a decreasing trend in Subject 3’s body core temperature and a good correspondence with each other (Fig. 5d). At the beginning of the first outdoor walking stage, both devices exhibited an increasing trend in Subject 3’s body temperature, and both exhibited a further increasing trend after entering the canteen (Fig. 5d). When Subject 3 left the canteen and returned to the underground laboratory, the flexible device demonstrated a decreasing trend in the body temperature while the axillary temperature patch demonstrated a flatten trend. This is because Subject 3’s long-term armpit clamping during the meal has raised the axillary temperature to the highest level (drinking hot beverages is also helpful for hyperthermia), and the same posture was maintained on the way back to the underground laboratory to stabilize the axillary temperature. The deep temperature at the wrist also rose to a high value during the dining process, and immediately showed a decreasing trend due to strong convection after leaving the canteen and walking outside. After returning to the underground laboratory, the high armpit temperature began to decline continuously due to the absence of high-temperature environment. However, the deep temperature of the wrist gradually rose after entering the underground laboratory due to the excessive drop of body temperature during the outdoor walking stage.
For Subject 4, the temperature-drop trend of the two devices was also well corresponding at the beginning of the first outdoor walking stage (Fig. 5e). However, the axillary temperature patch demonstrated that the temperature tended to stabilize later in the stage, while the temperature curve measured by our flexible single-heat-flux device fluctuated. This is because the outdoor wind was strong during the walking stage, and the body temperature at the wrist changes significantly, while that under the armpit was not affected. The second outdoor walking stage was implemented at night when the outdoor temperature was low, so the measured body core temperature by both devices showed a notable downward trend at the beginning of the stage. After Subject 4 returned to the laboratory, our flexible device worn at the wrist immediately exhibited a warming trend, while the temperature patch did not, which is attributed to the fact that the body temperature of the wrist decreased more than the armpit after Subject 4 walked outdoors for 30 min with lower outside temperature. Once the subject returned to the laboratory, the temperature in the deep layer of the wrist immediately rose to normal level, while the temperature in the armpit continued to drop until 30 min later when reach an equilibrium.
Subject 5 was tested in a violently convective environment, where his wrist was continuously affected by wind due to his upwind position during the sit-in stage for ~1 h in the underground laboratory (Supplementary Fig. 6). After sitting in the underground laboratory for 1 h, Subject 5 entered into a room with central air conditioning turning on where the convection was still violent and multiple people moved around frequently, which caused the deep temperature at the wrist to fluctuate violently at the first three stages. Although the temperature curve measured by our device worn at the wrist fluctuated drastically, the two devices still showed the same temperature trend after entering the last stage. However, the fluctuation amplitude of the temperature measured by our device at this stage was larger than the axillary temperature patch, indicating that the deep temperature of the wrist skin was more susceptible to the temperature changes of the external environment.
Simultaneous monitoring of the same subject for 8 h using our device and axillary temperature patch indicated a relatively high correlation (~0.8 in single scene) for the body core temperature measurement of 5 subjects with different skin conditions. Therefore, the measurement of core body temperature using this device realized a considerably high correlation with the axillary temperature patch, while also captured transient body surface temperature changes that are difficult to be perceived by the axillary temperature patch. This study was approved by the Ethical Review Committee of University of Science and Technology Beijing (The review project number is: No. 2022-3-103). All subjects participating in this test had signed the informed consent of the experiment.
According to our previous study62,63,64,65, the relationship between the skin thermal conductivity and its water content was established based on the effective media theory model. Therefore, after measuring the equivalent skin thermal conductivity of the five subjects, that relationship can be adopted to further calculate their skin water content. In order to verify the accuracy of the measurement of skin water content, a sponge and a watering can were used to increase the subject’s skin water content from the initial state gradually, and used a commercial water content meter (Real Bubee, RBX-916, Ningbo, China) to determine the subject’s skin water content, so as to calibrate our device as a reference value to derive the correlation between skin thermal conductivity and skin water content. It is found that the skin water content measured by our device is in good agreement with the results measured by commercial water content meters62. In the population test conducted in this paper, the skin water content was calculated using a equation calibrated by the commercial water content meter, and the error between these measurements and the measured values of the commercial water content meter was controlled within 10%. As shown in Table 2, the skin water content of the five subjects distributed in a reasonable level, and a higher skin thermal conductivity indicates a higher skin water content.
Discussion
The previously studied non-invasive body core temperature measurement methods based on thermal principle, such as the zero-heat-flux method, is limited by the high power consumption of supporting equipment, and thus it is difficult to realize the continuous monitoring of body surface and core temperatures. The existing single-heat-flux method and the dual-heat-flux method cannot obtain the true thermal conductivity and probing depth of the skin, and thus it is difficult to judge the authenticity of the results. To overcome the above problems, we fabricated a flexible single-heat-flux device which can accurately and continuously measure the body surface and core temperatures together with skin thermal conductivity and water content by integrating a well-designed thermal conductivity sensor and seven pairs of temperature sensors.
Owing to the ultrathin design of the device and the annular distribution of seven pairs of temperature sensors, which effectively satisfies the uni-directional heat conduction within the device, the body core temperature tests on four representative skin-like materials with varying depths have shown that the measurement error of our device was within ±0.25 °C when the body core temperature increasing continuously from ~32 to ~43 °C.
Moreover, owing to the accurate measurement of skin thermal conductivity by the sensor calibrated by heat flux distribution coefficient algorithm, the measurement error of the device for the body core temperature of three double-layer skin-like materials with varying thermal conductivity was within ±0.4 °C. When the upper layer is as thin as 3 mm, the measurement error of the body core temperature for the double-layer skin-like material can be as low as ±0.2 °C.
Due to the conformal adhesion of the PDMS flexible substrate to the human skin, the thermal contact resistance between the two was effectively reduced. In addition, the PDMS partition was designed to be only 1 mm thick, and the liquid PDMS encapsulation method was used to complete the connection of the upper and lower sensors to reduce the thermal contact resistance, which greatly shortens the time to reach thermal equilibrium with the skin, thereby greatly improving the responsiveness of continuous monitoring of body core temperature. Simultaneous monitoring of the same subject for 8 h using our device and axillary temperature patch indicated an extremely high correlation (~0.8) between the two devices for five subjects with different skin conditions.
In summary, our device can realize continuous and accurate monitoring of body core temperature, and is expected to play a significant role in scenarios such as wound infection and fever warning, athlete’s physical status assessment and hospital auxiliary diagnosis.
Methods
Fabrication of the flexible single-heat-flux device
The flexible single-heat-flux device was prepared by the following steps, as shown in Supplementary Fig. 7: (1) A 5 w/v% poly-methacrylic acid solution was spin-coated onto a 4-inch silicon wafer at 2000 rpm as a sacrificial layer, the silicon wafer was transferred to a hot plate at 95 °C and heated for 2 min to evaporate the water contained in the solution, and then the liquid PDMS mixture was spin-coated onto the aforementioned silicon wafer at 1250 rpm to obtain a 150-μm-thick PDMS film, which was then cured in an 80 °C oven for 2 h; (2) A 1 μm-thick parylene-c layer through chemical vapor deposition (SI 500D, SENTECH Corp., Berlin, Germany) was deposited on the fully cured PDMS film to complete the fabrication of the parylene-c treated PDMS substrate; (3) a 25/100 nm thick Ti/Pt layer was deposited by electron beam evaporative deposition (Peva-600E, Advanced system technology co., Taiwan, China) on the parylene-c treated PDMS substrate; (4) The electrode pattern was fabricated by photolithography using positive photoresist (AZ5214, Merck KGaA, Darmstadt, Germany) and wet etching of Ti/Pt; (5) A 3 μm-thick parylene-c layer was deposited on the electrode pattern for insulation and subjected to reactive ion etching (PlasmaPro NGP80, Oxford Instruments, Oxford, England) for 75 min at 50 W power to expose the active electrode position; (6) The silicon wafer was then soaked in deionized water for 12 h to peel the layer off the silicon wafer. After these procedures, two identical components were manufactured as upper and lower layers. The upper layer, the central hollow PDMS partition layer and the lower layer were sequentially and vertically placed into a pre-prepared mold with the equal size, and then a small amount of liquid PDMS was poured into the mold until it was slightly submerged over the surface of the upper layer. The cured structure was carefully removed from the mold after 48 h under room temperature to obtain the modified single-heat-flux device. Finally, an anisotropic conductive film bonder was used to connect the electrodes of the device with the signal acquisition & control board by using FPC cables.
Calibration of the device
To calibrate the measurement accuracy of the device, a special-designed experimental platform was developed. In brief, a skin-like material was placed onto a temperature-controllable hot plate mimicking the body core temperature, and two temperature sensors were placed onto the bottom of the skin-like material to monitor the variation of the temperature. The temperature stability of the hot plate was controlled within ±0.05 °C by proportional–integral–derivative (PID) controller (Supplementary Fig. 8), and the probing depth is regarded as the thickness of the material. The hot plate is composed of an ultra-thick aluminum plate (1.6 mm) with resistance heater in the shape of fractal curves on the bottom. The extremely high thermal diffusivity of the aluminum plate ensured the temperature uniformity. Although the thermal conductivity of liquid PDMS (0.18 W/m·K) is lower than that of human skin (0.3–0.5 W/m·K), its ability to be gradually cured at room temperature is convenient for embedding the temperature sensors at the bottom of the material, which ensures the measurement accuracy. For the hot plate, the temperature of the region covered by the skin-like materials is 0.3–0.5 °C higher than the non-covered region (Supplementary Fig. 8), suggesting that covering by the skin-like material leads to non-uniform temperature distribution of the hot plate. Therefore, two temperature sensors were embedded at the bottom of the skin-like material to obtain the true body core temperature. Those two temperature sensors were commercial temperature probe based on the temperature measuring chip with a precision of ±0.1 °C (TMP117AIDRVR, TI, Texas, USA). The probing sites of the temperature sensors is almost completely flush with the bottom of the PDMS, which ensures that the PDMS is in intimate contact with the hot plate and thus a real-time and accurate measurement of the body surface and core temperature.
Procedures for population test
The signal acquisition & control board was worn on the subject’s upper arm, and the flexible single-heat-flux sensor was worn on the subject’s wrist to continuously monitor the body surface and body temperatures for about 8 h, during which the axillary temperature patch (VV-200, vivalnk, Hangzhou, China) was attached to the subject’s armpit for synchronous monitoring of the armpit body temperature. The following measurement process was performed for five subjects: (1) sit quietly in the laboratory for 3 h, (2) walk outside for 30 min, (3) return to the laboratory and sit quietly for 3 h, (4) walk outside for 30 min, (5) return to the laboratory and sit quietly for 30 min.

Responses