Focal cortical dysplasia (type II) detection with multi-modal MRI and a deep-learning framework
 detection with multi-modal MRI and a deep-learning framework")
Introduction
FCDs are focal areas of abnormal and morphological brain cortex cell development that increase the risk of developing sudden, recurrent, and unprovoked drug-resistant seizures1,2. FCDs are grouped into three types3,4: FCD-I (cortical dyslamination allied to radial/ tangential migration2), FCD-II (abnormalities in cortical structure, dysmorphic neurons1,2,3, etc.), and FCD-III (hippocampal sclerosis1, seizure allied tumors1,2, etc.). Among them, FCD-II is considered a main factor in the formation of abnormal brain cells and the development of drug-resistant epileptic seizures, and the treatment option could be the abscission of epileptic seizures4,5,6,7. Indeed, FCD-II exhibits intricate clinical and pathological disparities afflicted by demographic characteristics (i.e., age, sex, etc.)5,6. Addedly, FCD-II shows age-dependent histopathological features and manifestations, ranging from evolving issues in adolescents to drug-resistant epileptic seizures in adults2,8. In addition, FCD-II can manifest differently in the brain hemispheres, and the brain lobes are more susceptible, impacting onset and severity2,9. FCD-II is mostly diagnosed by visualizing its characteristics, including dysmorphic neurons, unclear gray matter-white matter junctions, balloon cells, hyperintense/hypointense portent, and abnormal cortical thickness3,4,5. Indeed, FCD-II is found in more than 30% of patients who undergo epilepsy surgery2,10. Surgical resection is associated with a voluminous success rate of 30–70%, and a substantial number of patients become seizure-free3,4. Structurally, FCD-II is divided into FCD-IIa and FCD-IIb based on neuro histopathological features, including dyslamination of the cortical structure and dysmorphic neurons4,10. FCD-IIb is separated from FCD-IIa by the presence of balloon cells3. Certainly, an analysis of FCD-II and its subtypes, is protean and arduous due to the overlying histopathological similarities and clinical signs, requiring a multidisciplinary approach for accurate diagnosis and prognosis2,3,4,5.
MRI stands out among the available tools due to its distinct modalities, superior soft tissue contrast, multi-planar imaging capabilities, and non-invasiveness, making it highly beneficial for detailed and accurate analysis2,8,9. Indeed, it plays a pivotal role in distinguishing and monitoring FCD-II by imaging cortical structure abnormalities, assisting in precise localization, presurgical planning, and postoperative care11,12,13,14. Specifically, MRI is an advanced and constructive technique for revealing the underlying distinct characteristics of FCD-II and its subtypes. These characteristics are often discernible across distinct MRI modalities, including FLAIR and T1w, as well as in their three distinct imaging planes—axial (ax), coronal (cr), and sagittal (sg), providing complete insights and enhanced viewpoints. Considering these three different views for inclusive anatomical assessments, the choice of MRI imaging plane has distinct advantages and significant impacts on FCD analysis by providing distinct insights into cortical structures and abnormalities from various perspectives.
In recent years, several studies have employed various statistical and ML techniques to classify FCD-II using voxel and surface-based features extracted from the limited number of neuroimaging data2,6,7,12,13,14,15,16,17,18,19,20. The success of DL models in image analysis, including feature extraction, interpretability, scalability, and handling of limited data, can be useful for FCD-II21,22,23,24,25,26,27,28,29. DL enables the automatic learning and capture of high-level hidden key features from data through the stacking of multiple layers with dissimilar weight procedures21,22,23. Certainly, efficient DL models can distinguish and analyse features of FCD-II and its subtypes11,20,30,31,32,33,34. Moreover, several recent studies have utilized several DL models, including basic convolutional neural networks (CNNs), pre-trained auto-encoders, and deep CNNs to classify FCD-II using MRI22,23,24,25,26,27,28. These studies used small, inaccessible datasets along with limited details of FCD-II and its subtypes, as well as inadequate details about the demographics and clinical characteristics. In this view, successful and efficient DL models that improve performance while dealing with limited and composite data by utilizing knowledge from similar source tasks could be suitable21,35,36. Therefore, six diverse and advanced pre-trained DL models, including VGG1637, VGG1937, Xception38, DenseNet20139, Inception-ResNetV240, and a lightweight MobileNetV241 have been utilized. The basic DL, VGG16 enables the capture of more intricate features from MRI data, which is further improved by a few extra weight layers in VGG1937. However, Xception is computationally efficient and has residual links in its convolution blocks to learn hierarchical and abstract features from input data38. Inception-ResNetV2 utilizes inception blocks and residual connections to capture diverse features to make the model more efficient and robust40. Moreover, the DenseNet201 model incorporates densely connected layers, enhances feature reuse, improves gradient flow during training, and exhibits significant performance, particularly with limited data20,39. Furthermore, MobileNetV2 features inverted residuals and depthwise separable convolutions, which makes the model efficient and adaptable41.
Specifically, FCD-II is classified as a malformed cortex region that is highly affected by demographic factors (i.e. age, sex, etc.)4 and clinical features (i.e., brain hemisphere, lobes, etc.)2,7,8. The features may differ across diverse age groups, sexes, and brain regions, impacting the lesion prevalence and features. Addedly, lesions may vary in orientation and location; hence, a potentially useful approach is to consider 2D MR images. These images provide details on subtle brain abnormalities with multiple planes that ensure thorough brain coverage. Moreover, understanding these aspects is vital for FCD-II analysis and treatment. Therefore, an inclusive FCD-II dataset, including demographic and clinical details, is essential for analysis. Thus, in this study, a publicly available 3T FLAIR and T1w MRI dataset, with inclusive details about imaging planes, FCD-II subtypes, demographics, and brain characteristics, was explored for the analysis of DL frameworks. Overall, this study provides an inclusive analysis of FCD-II and its subtypes, offering valuable insights to aid in their classification and clinical decisions. This analysis can assist in the selection of suitable DL models, MRI modalities, and imaging planes, while considering diverse demographic and clinical characteristics for specific tasks.
Results
We performed a comprehensive analysis of FCD-II using a publicly available MRI dataset from the Life and Brain Centre, Bonn on OpenNeuro42. In the dataset42, 3T MRI data were captured from 170 subjects (85 with FCD-II and 85 healthy subjects) in two distinct modes: FLAIR and T1w sequences. We framed the analysis by considering six distinct aspects, including the classification of FCD-II and subtypes (IIa and IIb) as well as impacts of age, sex, left and right hemispheres, and lobes of the brain (see Fig. 1). We chose 50 patients who underwent surgery and compared with the same number of healthy control (HC) subjects while maintaining the age and sex ratios. We extracted 2D images from all three planes of the 3D scan in MRI modes. Certainly, each plane can provide specific details of brain anatomy; for instance, axial is useful for identifying spatial locations and the extent of cortical abnormalities; coronal offers valuable evidence about the extent of lesions and their proximity to the specific brain regions; sagittal is essential for assessing the mediolateral extent of lesions and abnormalities in cortical thickness.
 detection with multi-modal MRI and a deep-learning framework")
Two modes of 3T MRI, T1-weighted, and FLAIR sequences of FCD-II and healthy control subjects of the Bonn University Hospital-MRI (BUH-MRI) dataset and pre-trained DL neural networks (VGG16, VGG19, Xception, Inception-ResNetV2, DenseNet201, and MobileNetV2) were employed to discriminate FCD-II and analysis the influence of demographic and clinical characteristics. The analysis has been framed by considering subtypes (FCD-IIa and FCD-IIb), age (adolescents (aged 11–21 years) and adults (aged 21–60 years)), sex (male/female), brain hemisphere (left/right), and brain lobes (frontal/parietal brain lobes). In total, 100 (50 patients with FCD-II and 50 healthy controls, age span 11–60 years) were selected for analysis. The experiment was executed in three stages — in the first stage, the considered dataset was pre-processed, including skull-stripping of brain regions (removal of unnecessary uninformative parts), followed by the selection of apposite 2D images from each plane of both MRI modes followed by denoising and normalization. Furthermore, the dataset was framed in several subsets to analyse its diverse facets and influence. In the second stage, five efficient DL frameworks along with the lightweight neural network MobileNetV2 were employed to perform several classification tasks using 2D images of each planes together and separately as input. The input formats, where a indicates 2D images of the three planes together and b indicates separate imaging planes, of each MRI modes have been considered. For experimental validation, we used five performance metric scores, including accuracy, weighted precision, F1-score, specificity, and MCC, along with the AUROC/AUPR curves. In the third stage, we performed a comprehensive analysis of FCD-II and its subtypes, offering valuable insights to aid in their classification and clinical decisions. This analysis can assist in the selection of suitable DL models, MRI modalities, and imaging planes, taking into consideration diverse demographic and clinical characteristics. Ax, Cr, Sg depict axial, coronal, and sagittal planes, respectively; FL and PL represent frontal and parietal brain lobes; LH and RH indicate left and right hemisphere of brain.
Hereafter, 2D images of three imaging planes collectively and separately (axial, coronal, and sagittal) of respective FLAIR and T1w modes have been considered as input for DL models. We performed all the experiments by involving k-fold (k = 5) stratified cross-validation technique. This technique is significant for the robustness and generalization of models as well as for reducing bias and variance43. Finally, we evaluated the performances by well-known metrics—accuracy, weighted precision, F1-score, and Mathew’s correlation coefficient (MCC)43. Additionally, we measured the mean area under the receiver operating characteristic (AUROC) and precision–recall (AUPR) curves. We systematically conducted tasks in phases and presented outcomes of the highest-performing model for specific MRI modes and planes. We tailored the analysis to choices, developing a detailed corresponding experimental outline that is detailed in / subsequent sections.
Classification of FCD-II using MRI planes separately and together
First, we performed a binary classification FCD-II vs. HC using 2D images of three planes collectively and separately for FLAIR and T1w modes, details in the Supplementary Data (Table S1.1.0). The numbers of FLAIR (ax: 1202, cr: 1076, sg: 983) and T1w (1260, 1199, 1024) images of FCD-II patients and FLAIR (1339, 1168, 971) and T1w (1354, 1098, 872) images of HCs were used. For the classification of FCD-II, the Xception model obtained the highest performance values, when using 2D images of all three planes together (Iacs) for FLAIR and T1w sequences. For FLAIR sequences, the accuracy was 0.921 ± 0.160 [0.95 confidence interval (CI): 0.809, 1.000], the weighted precision was 0.937 ± 0.119 [CI: 0.854, 1.000], the weighted F1-score was 0.84.4 ± 0.168 [CI: 0.801, 1.000], the specificity was 0.873 ± 0.334 [CI: 0.612, 1.000], and the MCC was 0.851 ± 0.284 [CI: 0.659, 1.000]; whereas for T1w, the values were 0.945 ± 0.126 [CI: 0.858, 1.000], 0.912 ± 0.115 [CI: 0.869, 1.000], 0.945 ± 0.127[CI: 0.857, 1.000], 0.912 ± 0.193 [CI: 0.780, 1.000], and 0.895 ± 0.241 [CI: 0.727, 1.000] respectively. Moreover, the confusion matrix using Xception for each fold is displayed in Table 1. For individual planes, DenseNet201 had the highest performance scores for the FLAIR mode for ax with values of 0.952 ± 0.081 [CI: 0.895, 1.000], 0.954 ± 0.073 [CI: 0.904, 1.000], 0.951 ± 0.082 [CI: 0.894, 1.000], 0.925 ± 0.158 [CI: 0.816, 1.000], and 0.906 ± 0.156 [CI: 0.797, 1.000], respectively, and for the T1w, 0.975 ± 0.085 [CI: 0.915, 1.000], 0.976 ± 0.079 [CI: 0.920, 1.000], 0.974 ± 0.086 [CI: 0.914, 1.000], 0.955 ± 0.147 [CI: 0.853, 1.000], and 0.950 ± 0.166 [CI: 0.835, 1.000], respectively. T1w outperformed FLAIR, for Iacs and ax. The performance values obtained using other models are shown in Table 2. Xception recorded the highest performance values for both MRI modes when images of all three planes were used.
Further, we investigated performance in a lightweight model, MobileNetV2, for all the cases. The model achieved the highest performance values when using Iacs and ax for both MRI modes, as shown in Table 2. In addition, AUROC/AUPR values obtained by the other models when using Iacs of MRI modes have been displayed in Fig. 2. Xception and MobileNetV2 captured the highest, while DenseNet201 recorded the highest for axial imaging plane. The AUROC/AUPR values were obtained using the models for each individual plane in the Supplementary Results (Fig. S1).

The mean values obtained with five DL models and one lightweight neural network framework during the classification of FCD-II and HC samples using 2D images of three planes together (Iacs) of FLAIR and T1w MRI modes separately, are displayed. In each row, the first two representations depict the AUROC and AUPR values obtained with the respective models, when using Iacs of FLAIR sequences. Moreover, the last two representations depict outcomes, when using Iacs of T1w MRI mode. The areas under the curves obtained for each FCD-II and HC with standard deviation values are shown (result format: mean ± standard deviation), the blur gray and blue colors represent ±1 standard deviation. The AUROC/AUPR values obtained using a VGG16, b VGG19, c Xception, d Inception-ResNetV2, e DenseNet201, and f MobileNetV2 in the classification of FCD-II vs. HCs, when using Iacs of FLAIR and T1w separately.
Classification of FCD-II subtypes (IIa and IIb)
We investigated subtypes of FCD-II, which are complex and often involve clinical, imaging, and histopathological criteria. For the classification of subtypes, we used the available FLAIR and T1w images of 16 patients with FCD-IIa (number of images, FLAIR (391, 354, 320) and T1w (415, 378, 300)) and 34 patients with FCD-IIb (number of images, FLAIR (811, 722, 663) and T1w (845, 821, 724), details of the dataset are in the Supplementary Data (Dataset_1.2 and Tables S1.2.0, S1.2.1). For Iacs of FLAIR, the DenseNet201 model achieved the greatest performances of 0.973 ± 0.088, [CI: 0.912, 1.000], 0.974 ± 0.082 [CI: 0.916, 0.923], 0.973 ± 0.086 [CI: 0.913, 0.978], 0.971 ± 0.084 [CI: 0.912, 1.000], and 0.941 ± 0.191 [CI: 0.808, 0.895] respectively, and for T1w, values of 0.971 ± 0.107, [CI: 0.895, 1.000], 0.975 ± 0.089 [CI: 0.913, 1.000], 0.968 ± 0.117 [CI: 0.886, 1.000], 0.907 ± 0.338 [CI: 0.673, 1.000], and 0.933 ± 0.244 [CI: 0.763, 1.000] were obtained, respectively. In addition, the AUPR values obtained by the models have been shown in Fig. 3a. Meanwhile, in case of imaging planes for specific MRI modes, DenseNet201 achieved the highest scores for sg for both modes. The performance values and their respective AUPR values are displayed in Fig. 3b. In addition, the highest performance scores recorded by MobileNetV2 when using Iacs and sg with corresponding AUPR values are shown in Fig. 3c. The outcomes of models are remarkable. The outcomes of the other models are shown in the Supplementary Results (Table S1 and Fig. S2).

a AUPR values obtained with DenseNet201 in classification of FCD-II subtypes (FCD-IIa and FCD-IIb) using Iacs of FLAIR and T1w MRI modes respectively (the first two images of the first and second rows, respectively), b The highest performance values (box plots) and corresponding AUPR values obtained with DenseNet201 model in the classification of FCD-IIa and FCD-IIb using 2D images of the individual sagittal plane of FLAIR (the last two representations of the first row) and T1w (the last two representation of the second row), where the whiskers range within 95% of the confidence interval. c The highest performance scores recorded with MobileNetV2 for Iacs (FLAIR) and the sagittal plane (T1w) in the classification of subtypes, along with the corresponding AUPR values, are shown.
Classification and influence of age on FCD-II
Age can influence treatment options, recovery rates, decision-making, and the patterns of FCD-II across different age ranges. We considered two groups—adolescents (number of patients: 14, aged 11–20 years) and adults (36, aged 21–60 years) to analyse the effect of age. Furthermore, we selected an equal number of HCs (Dataset_1.3 and Table S1.3.0). Here, we performed three classification tasks—adolescent vs. HCs (Table S1.3.2), adults vs. HCs (Table S1.3.3), and subtypes in the adult group (Table S1.3.4).
Adolescent versus HCs
For the FCD-II classification in the adolescent age group, DenseNet201 displayed the overall highest performance values of 0.985 ± 0.052 [CI: 0.949, 1.000], 0.986 ± 0.046 [CI: 0.954, 1.000], 0.985 ± 0.109 [CI: 0.948, 1.000], 0.970 ± 0.109 [CI: 0.894, 1.000], and 0.971 ± 0.098 [CI: 0.903, 1.000] when using Iacs of FLAIR; while for T1w, performance values of 0.993 ± 0.026 [CI: 0.974, 1.000], 0.992 ± 0.026 [CI: 0.975, 1.000], 0.993 ± 0.026 [CI: 0.975, 1.000], 0.996 ± 0.016 [CI: 0.985, 1.000], and 0.985 ± 0.015 [CI: 0.949, 1.000] were obtained respectively. The AUROC/AUPR values obtained using DenseNet201 are shown in the Supplementary Results (Fig. S2). In the case of individual MRI planes, DenseNet201 achieved the best performance for the ax and cr of the FLAIR and T1w modes, respectively. The performance scores, along with respective AUPR values, are displayed in Fig. 4a. In addition, the MobileNetV2 model recorded the highest performance scores for the Iacs (T1w) and ax (FLAIR) images. The outcomes along with their respective AUPR curves are depicted in Fig. 4b. All the results are shown in Supplementary Results (Table S3 and Fig. S3).
Adults versus HCs
For the classification of FCD-II lesions in the adult, the Xception model achieved the highest classification scores of 0.938 ± 0.148 [CI: 0.835, 1.000], 0.941 ± 0.140 [CI: 0.843, 1.000], 0.937 ± 0.150 [CI: 0.833, 1.000], 0.906 ± 0.246 [CI: 0.735, 1.000], and 0.878 ± 0.292 [CI: 0.675, 1.000], respectively, when using Iacs of FLAIR, whereas, DenseNet201 attained the highest values of 0.968 ± 0.079 [CI: 0.913, 1.000], 0.969 ± 0.079 [CI: 0.913, 1.000], 0.969 ± 0.079 [CI: 0.913, 1.000], 0.968 ± 0.079 [CI: 0.913, 1.000], 0.973 ± 0.085 [CI: 0.913, 1.000], and 0.937 ± 0.159 [CI: 0.827, 1.000], respectively, for Iacs captured in T1w. The AUROC/AUPR obtained using both models are shown in the Supplementary Results (Fig. S4).

a The highest performance metric scores along with respective AUPR values obtained with DenseNet201 in the classification of adolescent FCD-II patients are shown when the axial plane of the MRI modes was used. (whiskers range within 95% of the confidence interval), b The highest performance scores and corresponding AUPRs obtained when using Iacs (T1w) and ax (FLAIR) as inputs for lightweight MobileNetV2 to classify FCD-II in adolescent patients are depicted, c In the case of MRI planes for the classification of FCD-II in adults, the highest performance values and their corresponding AUPRs recorded for the ax plane of both MRI modes using DenseNet201, are shown, and the whiskers spread within 95% of the confidence interval, d For the classification of FCD-II in adults, the highest performance scores and their corresponding AUPRs obtained with the lightweight framework when Iacs and the axial plane of the T1w mode were used as inputs, are displayed. e In the classification of FCD-II subtypes (FCD-IIa and FCD-IIb) in adults, the performance metrics scores and corresponding AUPRs obtained with MobileNetV2 for Iacs in both MRI modes are shown. In each row of Fig. 4, the first and second AUPRs are related to the inputs shown on the horizontal axis of the performance metric plot.
In the case of imaging planes, DenseNet201 recorded the highest performance values for ax for both MRI modes. The obtained performance values and their respective AUPR values are presented in Fig. 4c. Moreover, the highest performance scores and their corresponding AUPRs obtained using the lightweight framework for Iacs (T1w) and the axial plane (T1w) are displayed in Fig. 4d.
Classification of FCD-II subtypes in the adult group
In this section, we utilized only the Iacs of both MRI modes to distinguish FCD-IIa from FCD-IIb. DenseNet201 demonstrated superior classification performance for both MRI modes. For FLAIR, 0.974 ± 0.090 [CI: 0.911, 1.000], 0.975 ± 0.086 [CI: 0.915, 1.000], 0.973 ± 0.090 [CI: 0.911, 1.000], 0.963 ± 0.138 [CI: 0.867, 1.000], and 0.949 ± 0.176 [CI: 0.826, 1.000] were obtained; while for T1w, 0.978 ± 0.061 [CI: 0.936, 1.000] 0.980 ± 0.056 [CI: 0.940, 1.000], 0.978 ± 0.061 [CI: 0.935, 1.000], 0.972 ± 0.110 [CI: 0.895, 1.000], and 0.958 ± 0.117 [CI: 0.876, 1.000] were obtained, respectively. Furthermore, the classification scores and respective AUPR values obtained using MobileNetV2 for Iacs in both MRI modes are shown in Fig. 4e. The performance of the model is significantly better for T1w. The results of other models can be found in Supplementary Results (Tables S3–S5 and Figs. S3–S5)
Classification and influence of sex on FCD-II
Sex-related brain differences affect the distribution and features of FCD-II lesions, highlighting the importance of sex in the diagnosis and clinical decisions. In this context, we performed four tasks—females vs. HCs (females) (Supplementary Data, Dataset_1.4, and Table S1.4.1), males vs. HCs (males) (Table S1.4.2), FCD-II females vs. males (Table S1.4.3), and classification of subtypes in both males and females (Table S1.4.4 (females) and Table S1.4.5 (males)).
Female patients vs. HCs
For the classification of FCD-II in female patients, DenseNet201 had the highest classification metric values of 0.965 ± 0.111 [CI: 0.888, 1.000], 0.966 ± 0.109 [CI: 0.889, 1.000], 0.965 ± 0.111 [CI: 0.889, 1.000], 0.970 ± 0.088 [CI: 0.909, 1.000], and 0.932 ± 0.221 [CI: 0.778, 1.000] respectively using Iacs from FLAIR mode, for Iacs of T1w, the Xception model had the highest performance metrics of 0.973 ± 0.076 [CI: 0.921, 1.000], 0.975 ± 0.072 [CI: 0.925, 1.000], 0.973 ± 0.077 [CI: 0.920, 1.000], 0.983 ± 0.041 [CI: 0.954, 1.000], and 0.948 ± 0.149 [CI: 0.845, 1.000], respectively. In addition, the DenseNet201 recorded the highest metric scores for cr among all the other planes in both MRI modes. The performance metric scores, as well as the AUROC and AUPR of T1w and MobileNetV2 models, are summarized in the Supplementary Results (Table S6 and Fig. S6).
Male FCD-II vs. HC
For FCD-II classification in male patients, the DenseNet201 model achieved the highest performance metrics when using Iacs and plane sg of both MRI modes. For Iacs of FLAIR mode, the metrics were 0.958 ± 0.114 [CI: 0.879, 1.000], 0.959 ± 0.111 [CI: 0.882, 1.000], 0.958 ± 0.114 [CI: 0.878, 1.000], 0.941 ± 0.154 [CI: 0.834, 1.000], and 0.918 ± 0.226 [CI: 0.761, 1.000]. For Iacs of T1w mode, the performance values of 0.975 ± 0.088 [CI: 0.913, 1.000], 0.976 ± 0.086 [CI: 0.916, 1.000], 0.975 ± 0.089 [CI: 0.913, 1.000], 0.985 ± 0.041 [CI: 0.956, 1.000], and 0.951 ± 0.177 [CI: 0.828, 1.000] respectively, were recorded. In the case of MRI planes, DenseNet201 achieved the highest performance values when using the sagittal slices of FLAIR and T1w MRI modes as input individually. The performance metric values and respective AUROCs/AUPRs of specific imaging planes for both modes recorded by the other models are shown in Supplementary Results (Table S7 and Fig. S7).
FCD-II in females vs. males
For the discrimination of FCD-II features in female and male patients, the DenseNet201 model achieved the highest performance scores for Iacs in both MRI modes. For Iacs of FLAIR, the performance values were 0.938 ± 0.154 [CI: 0.831, 1.000], 0.947 ± 0.130 [CI: 0.856, 1.000], 0.936 ± 0.158 [CI: 0.826, 1.000], 0.893 ± 0.296 [CI: 0.687, 1.000], and 0.883 ± 0.288 [CI: 0.683, 1.000], respectively, while for Iacs in T1w mode, the values were 0.984 ± 0.057 [CI: 0.944, 1.000], 0.984 ± 0.054 [CI: 0.946, 1.000], 0.984 ± 0.057 [CI: 0.944, 1.000], 0.990 ± 0.032 [CI: 0.968, 1.000], and 0.968 ± 0.112 [CI: 0.889, 1.000] respectively. We observed that 2D images of three planes in T1w mode displayed a higher and more remarkable classification performance than those of the FLAIR mode. In the case of individual MR imaging planes, for the coronal plane in both MRI modes, higher performance values were recorded using the DenseNet201. The metric scores and respective AUPRs for the coronal plane are displayed in Fig. 5a. Addedly, the maximum performance values and respective AUPRs obtained using MobileNetV2 for Iacs and the axial plane of the T1w MRI are shown in Fig. 5b. The outcomes of the other models are shown in the Supplementary Results (Table S8 and Fig. S8). Furthermore, we performed an intra-sex analysis of specific types of FCD-II by considering female patients.
Classification of FCD-II subtypes in female subjects
For the classification of FCD-IIa and FCD-IIb in female patients, DenseNet201 achieved the highest performance when using Iacs of FLAIR and T1w modes. For FLAIR, the performance values were 0.985 ± 0.051 [CI: 0.949, 1.000], 0.986 ± 0.051 [CI: 0.950, 1.000], 0.985 ± 0.052 [CI: 0.949, 1.000], 0.982 ± 0.072 [CI: 0.932, 1.000], and 0.971 ± 0.103 [CI: 0.899, 1.000], respectively. For T1w, values were 0.980 ± 0.058 [CI: 0.943, 1.000], 0.985 ± 0.055 [CI: 0.946, 1.000], 0.984 ± 0.059 [CI: 0.942, 1.000], 0.969 ± 0.112 [CI: 0.891, 1.000], and 0.968 ± 0.116 [CI: 0.887, 1.000] respectively. The FCD-II subtypes in female patients are better distinguished in FLAIR mode than in T1w. For all other models, the experimental outcomes can be found in the Supplementary Results (Table S9 and Fig. S9).
FCD-IIa vs. FCD-IIb in male patients
For the discrimination of FCD-IIa and FCD-IIb, the DenseNet201 model obtained the maximum performance scores when using Iacs from both MRI modes. For FLAIR images, performance values of 0.952 ± 0.176 [CI: 0.829, 1.000], 0.966 ± 0.121 [CI: 0.882, 1.000], 0.949 ± 0.185 [CI: 0.821, 1.000], 0.998 ± 0.006 [CI: 0.993, 1.000], and 0.917 ± 0.299 [CI: 0.709, 1.000] were recorded, while for T1w images, the values were 0.985 ± 0.050 [CI: 0.951, 1.000], 0.985 ± 0.050 [CI: 0.950, 1.000], 0.985 ± 0.050 [CI: 0.950, 1.000], 0.986 ± 0.047 [CI: 0.953, 1.000], and 0.971 ± 0.101 [CI: 0.901, 1.000], respectively. FCD-IIa and FCD-IIb could be better discriminated in male patients using T1w MRI mode. The lightweight model MobileNetV2 achieved better performance outcomes for Iacs in T1w mode than in FLAIR. The performance scores and AUROC/AUPR values of all the models are summarized in the Supplementary Results (Table S10 and Fig. S10).

The ability of DenseNet201 to discriminate between female and male FCD-II patients. a The highest performance scores, along with the AUROC values recorded for the coronal plane in both MRI modes, followed by the corresponding AUPRs, are shown. b The highest performance values and corresponding AUPRs obtained when using Iacs (T1w) and ax (FLAIR) as inputs for lightweight MobileNetV2 in the classification in FCD-II of female and male patients are presented, c Violin plots of the performance values and respective AUPRs for the sg and ax planes of FLAIR and T1w modes obtained using DenseNet201 in the FCD-II classification of the left and right brain hemispheres, respectively, and the whiskers spread within 95% of the confidence interval. d Similarly, plots of the performance scores and corresponding AUPRs for the cr and ax planes of FLAIR and T1w modes obtained using DenseNet201 in the FCD-II classification of frontal and parietal brain lobes, respectively, and the whiskers range within 95% of the confidence interval.
FCD-II is influenced by the brain hemispheres
The discrimination of FCD-II and its subtypes in the left and right brain hemispheres is crucial for distinguishing distinct features and accurately localizing the dysplastic lesions. It can be helpful for clinicians to gain insights into the spatial distribution, clinical significance, and lateralization of FCD-II. In this context, we performed two classification tasks: first, discrimination of FCD-II in the left and right hemispheres (Supplementary Data, Dataset_1.5, and Table S1.5.1) and of FCD-IIb in the left hemisphere vs. FCD-IIb in the right hemisphere (Table S1.5.2).
Classification of FCD-II in the left and right hemispheres
For the classification of FCD-II, DenseNet201 recorded the highest performance values for both MRI modes. For Iacs of FLAIR, values of 0.947 ± 0.177 [CI: 0.824, 1.000], 0.957 ± 0.141 [CI: 0.859, 1.000], 0.946 ± 0.183 [CI: 0.819, 1.000], 0.985 ± 0.032 [CI: 0.962, 1.000], 0.904 ± 0.318 [CI: 0.684, 1.000] respectively, were recorded. For Iacs in T1w, the classification performance scores of 0.958 ± 0.150 [CI: 0.853, 1.000], 0.965 ± 0.122 [CI: 0.880, 1.000], 0.957 ± 0.154 [CI: 0.850, 1.000], 0.988 ± 0.028 [CI: 0.969, 1.000], and 0.924 ± 0.274 [CI: 0.733, 1.000] were obtained, which are slightly higher than those of FLAIR mode. The performance values and AUROCs and AUPRs of the models are shown in the Supplementary Results (Table S11 and Fig. S11). For distinct MRI planes, sg and ax of FLAIR and T1w modes, respectively, recorded the highest performance values among all planes of the respective MRI modes using DenseNet201. The metric scores and respective AUPRs are displayed in Fig. 5c.
FCD-IIb in the left hemisphere vs. FCD-IIb in the right hemisphere
For the classification of FCD-IIb in the left/right brain hemispheres, the DenseNet201 model obtained the highest performance when using the Iacs of both MRI modes. For FLAIR, the values were 0.966 ± 0.116 [CI: 0.885, 1.000], 0.968 ± 0.108 [CI: 0.892, 1.000], 0.965 ± 0.121 [CI: 0.881, 1.000], 0.928 ± 0.257 [CI: 0.750, 1.000], and 0.929 ± 0.243 [CI: 0.759, 1.000] respectively, while for T1w, the values were 0.975 ± 0.089 [CI: 0.913, 1.000], 0.978 ± 0.077 [CI: 0.924, 1.000], 0.975 ± 0.088 [CI: 0.913, 1.000], 0.989 ± 0.027 [CI: 0.969, 1.000], and 0.952 ± 0.168 [CI: 0.835, 1.000] respectively. The performance outcomes and AUROCs/AUPRs of the models can be found in the Supplementary Results (Table S12 and Fig. S12). However, in the case of separate MRI imaging planes, for the sg and ax of FLAIR and T1w modes, respectively, the highest performance metric scores were recorded by the DenseNet201 model among all other planes of MRI modes. The outcomes of MobileNetV2 and the other models are in the Supplementary Results (Table S12 and Fig. S12).
Classification and influence of brain lobes on FCD-II
The brain lobes are the key regions of the brain and exert a substantial influence on FCD-II analysis. These lobes are involved in various cognitive functions and abnormalities within them can profoundly impact the FCD-II diagnosis and health care. We performed two classification tasks—FCD-II in the frontal vs. parietal lobe (Dataset_1.6 and Table 1.6.1) and IIa vs. IIb in the frontal lobe (Table 1.6.2).
FCD-II in the frontal lobe vs. parietal lobe of the brain
For the discrimination of FCD-II features of the frontal and parietal lobes, DenseNet201 obtained the best performance scores when using Iacs in both MRI modes. For FLAIR, the performance values were 0.963 ± 0.104 [0.890, 1.000], 0.965 ± 0.098 [0.896, 1.000], 0.959 ± 0.117 [0.878, 1.000], 0.995 ± 0.010 [0.987, 1.000], and 0.895 ± 0.300 [0.687, 1.000], respectively. The T1w values were 0.984 ± 0.055 [0.946, 1.000], 0.983 ± 0.056 [0.945, 1.000], 0.984 ± 0.055 [0.945, 1.000], 0.992 ± 0.030 [0.971, 1.000], and 0.956 ± 0.145 [0.857, 1.000] respectively. The classification outcomes are better with the T1w mode. In addition, the AUROCs/AUPRs obtained using the model can be found in the Supplementary Results (Table S13 and Fig. S13). However, for the cr and ax of the FLAIR and T1w, respectively, the highest performances were recorded using DenseNet201. The performance outcomes and respective AUPRs obtained using the model for specific imaging planes, including cr and ax planes, are shown in Fig. 5d. The performance and AUROCs/AUPRs obtained using MobileNetV2 and other models can be found in the Supplementary Results (Table S13 and Fig. S13).
FCD-IIa vs FCD-IIb in the frontal lobe
For the classification of FCD-II subtypes in the frontal lobe, the DenseNet201 model obtained the best performance values for the Iacs in both MRI modes. For FLAIR, the performance values were 0.963 ± 0.104 [0.890, 1.000], 0.965 ± 0.098 [0.896, 1.000], 0.959 ± 0.117 [0.878, 1.000], 0.995 ± 0.010 [0.987, 1.000], and 0.895 ± 0.300 [0.687, 1.000], respectively. The T1w values were 0.984 ± 0.055 [0.946, 1.000], 0.983 ± 0.056 [0.945, 1.000], 0.984 ± 0.055 [0.945, 1.000], 0.992 ± 0.030 [0.971, 1.000], and 0.956 ± 0.145 [0.857, 1.000], respectively. The experimental results demonstrated that the classification performance was better for the T1w. The respective AUROCs/AUPRs are within the Supplementary Results (Fig. S14). However, DenseNet201 achieved superior classification performance scores for the sg and ax planes in FLAIR and T1w, respectively, for FCD-IIa and FCD-IIb. In addition, the MobileNetV2 achieved impressive outcomes in the classification of the FCD-II subtype. The results obtained by other models are shown in the Supplementary Results (Table S14 and Fig. S14).
Discussion
The discrimination, diagnosis, and clinical management of FCD-II and its subtype (IIa and IIa) remain multifaceted challenges, and specialized skills for performing in-depth investigations are needed3,4. Moreover, the subtypes of FCD-II manifest similar neuro and clinical pathological characteristics4. Furthermore, variations in FCD-II lesions, intricate transmantle signs, heterogeneity, comorbidities, and treatment outcomes further complicate the diagnosis process5. However, more research and comprehensive analysis need to be performed in this direction to improve the diagnostic procedures and clinical perspective6,7. Such a detailed analysis is hurdled due to a lack of resources and limited access to publicly available clinical datasets10. Sometimes, the dataset may not have sufficient samples, has a low imaging resolution, lacks demographic and clinical data, limited annotations, etc. Recently, an open presurgery MRI dataset with a suitable number of FCD-II subjects containing MRI data with reasonable annotations has become publicly available42. Here, by taking advantage of this opportunity, we conducted a comprehensive analysis of FCD-II using MR images. In this study, we designed an interpretable pipeline for the classification of FCD-II and its subtypes, as well as the impacts of diverse aspects of demographics and clinical characteristics in the DL context. We used the FCD-II MRI dataset to explore its diverse aspects with respect to age, sex, and brain regions/lobes. Predominantly, neuropathological and transmantle signs, including abnormalities in the thickness and structures of cortical and dysmorphic neurons, with/without balloon cells, blurring of gray-white matter intersections, hyperintensity and hypointensity, etc., are often found using specific MRI modalities and are more specifies in diverse planes10,11,12,13. This comprehensive study provides possible outcomes that could help in selecting suitable MRI modalities, imaging planes, and DL models for the discrimination of FCD-II while considering clinical and demographic features. We used 2D images of MR images (axial, coronal, and sagittal) extracted from 3D-FLAIR and T1w MR images. For the in-depth analysis, we used all images of the planes together and separately from the respective MRI modes. A detailed description of the dataset, including the number of 2D images in each plane from the FCD-II patients and HCs, image dimensions, etc., can be found within the Supplementary Data (Dataset_1.0 and Tables S1.0.1, S1.0.2). Furthermore, we used six advanced and efficient DL models to perform the classification tasks.
The Xception model showed superior performance in the discrimination of FCD-II, when using images of all three planes together for FLAIR and T1w modes, with accuracies of 92.1% and 94.5%, respectively. However, for imaging planes, DenseNet201 achieved the highest performance scores when using the axial plane of FLAIR and T1w modes, with an accuracy of ≥95.2%, which was greater for the axial plane of T1w images. The noteworthy outcomes indicated that the DL models have efficiently learned and extracted intricate key features from input (Iacs/ax) to discriminate FCD-II patients from HCs using different MRI modalities and imaging planes. In addition, MobileNetV2 was employed to assess its usability in a low-resource environment. The model uses inverted residual blocks with bottlenecking features, which enables a reduction in the number of parameters, improves the training ability, real time inference, etc. The model achieved remarkable performance scores in the classification of FCD-II when using Iacs and ax of T1w mode.
Furthermore, discrimination between FCD-IIa and FCD-IIb has been challenging due to their similar neuropathological and clinical features, including, blurred junctions of gray and white matter (due to the presence of heterotopic neurons), dysmorphic neurons, and transmantle signs. In addition, FCD-IIb can be segregated from FCD-IIa by the presence of balloon cells and the dominance of the transmantle signs on MRI. The DenseNet201 model discriminated between FCD-IIa and FCD-IIb with a classification accuracy of 97.3% when images of all planes in FLAIR mode were combined. However, for T1w, the model achieved an accuracy of 97.1%, which was slightly lower than that of FLAIR mode. In the case of the individual MR imaging planes, the highest accuracy scores (≥97%) were recorded for the sagittal plane for both FLAIR and T1w sing DenseNet201. Notably, FCD-IIb lesions exhibit hyperintense (brighter than surrounding normal tissue) and hypointense (darker than surrounding normal tissue) signals in cortical zones as well as the dominance of balloon cells, while FCD-IIa lesions exhibit mild or no hyperintense/hypointense signals and an absence of balloon cells. Additionally, the maximum classification accuracy of MobileNetV2 was recorded, when using Iacs in FLAIR mode, while in the case of the imaging plane, the highest scores were recorded for the sagittal plane of T1w images.
Moreover, FCD-II can affect individuals in various age groups, including adolescents and adults. With respect to the classification of FCD-II in adolescent, DenseNet201 model had the highest classification score of 99.4% when using all the images of the T1w, which was slightly higher than using Iacs of FLAIR mode. However, in the axial and coronal planes of the FLAIR and T1w, respectively, the FCD-II images were discriminated based on the highest scores using the DenseNet201. Furthermore, MobileNetV2 discriminated FCD-II in adolescents with maximum scores ≥98% when using Iacs in T1w, and for the coronal plane of T1w images. FCD-II classification in the adult group yielded the highest score of 96.8% when using Iacs in T1w using DenseNet201. For FLAIR mode when using Iacs, the Xception model recorded the highest performance values, which were slightly higher than those of DenseNet201. In addition, the lightweight model achieved the greatest performance in the classification of FCD-II in adults when using Iacs and the axial plane of T1w. For the axial plane of both MRI modes, the maximum classification scores were recorded using DenseNet201. Moreover, the FCD-II subtypes in adults were efficiently discriminated for both MRI modes using all plane images together, with an accuracy of ≥97%. In addition, the MobileNetV2 classified FCD-IIa and FCD-IIb with a score of 98.4% using Iacs in T1w mode, which is higher than the percentage obtained using Iacs in FLAIR mode. Overall, FCD-II lesions in adolescents were efficiently discriminated with higher performance values than in adults by the DL model, DenseNet201 for Iacs in T1w mode. Among the adolescents, FCD-II was discriminated with the highest classification scores in the coronal plane of the T1w images. However, the axial plane of the T1w mode was better for the discrimination of FCD-II lesions in adults. In addition, FCD-IIa and FCD-IIb were efficiently discriminated in both MRI modes. However, the low number of samples for individual planes limits the ability to perform subtype classification in adolescents. The presence of underlying cortical abnormalities such as cortical thickening (the cortex is thicker in adolescents than in adults) can be better visualized in the axial plane. However, specific regions and proximities of FCD-II lesions could be competently recognized in the coronal plane. In summary, the results and analysis showed that the detection of FCD-II and its subtypes in adults was lower than in adolescents. This result may be due to transmantle signs involving cortical thickness, gray/white matter, volume ratio, etc., being less pronounced over time in MRI of adults obtained using MRI modes.
FCD-II and its subtypes show diverse variations in distinct aspects of sex (male/female). The greatest classification of FCD-II in female patients compared to HCs was recorded by the Xception with an accuracy of 97.3%, which is slightly higher than that of DenseNet201 (97.1%), when using images of three MRI planes of T1w together. Moreover, in the case of the individual MRI planes, FCD-II was efficiently discriminated with the highest score of ≥97% by the DL model, DenseNet201. In addition, the MobileNetV2 model achieved remarkable and maximum classification scores when using Iacs and coronal planes of T1w images. Moreover, the classification of FCD-II in male patients compared with HC male subjects was performed. FCD-II lesions in male subjects were detected with the highest classification accuracy of 97.5%, when using Iacs in T1w mode with DenseNet201. However, for the sagittal plane of T1w images, FCD-II was discriminated with the highest performance scores. The DL models revealed the spatial distribution and abnormalities in the thickness of the cortex and sub-cortex as well as the mediolateral extent of FCD-II lesions, which can be found in the sagittal plane. In addition, the lightweight model achieved the maximum classification performance when using Iacs and the axial plane of T1w images (see the Supplementary Results). Furthermore, the FCD-II lesions in females and males were identified with the highest score of 98.4%, when all images of the three planes in T1w mode were used as the input for DenseNet201. However, for the coronal plane, FCD-II lesions in females and males were efficiently discriminated with the maximum performance values. The transmantle signs of FCD-II lesions may be more strongly identified in the coronal plane to achieve remarkable performance. In addition, the characteristics of FCD-II lesions in females may have been more pronounced than those in males, which are prominently perceived and discriminated by DL models. Furthermore, the FCD-II subtypes were also different between in males and females. The best classification of FCD-II and FCD-IIb in female patients was achieved with the DenseNet201 model when using Iacs in T1w mode (slightly more than FLAIR mode). Similarly, FCD-II and FCD-IIb in males were discriminated, with the highest classification score of 98.5% by DenseNet201 when using Iacs in T1w mode. MobileNetV2 attained the maximum scores when using Iacs in T1w mode for the classification of FCD-II subtypes in female and male subjects. However, the low number of samples for individual planes limits the analysis of the impact of individual imaging planes.
FCD-II lesions can occur in either hemisphere of the brain, which may impact clinical and demographic characteristics and symptoms. FCD-II lesion occurrence in the left and right hemispheres was discriminated competently by the DenseNet201 model with the highest classification score of 95.8% when using Iacs from T1w images. However, in the case of individual imaging planes, the highest classification accuracy was recorded for the axial plane of T1w images. Additionally, the classification of FCD-II by the lightweight model attained the maximum performance values when using Iacs and axial plane of T1w images. Furthermore, the classification of FCD-IIb lesions in the left and right brain hemispheres was the highest when using Iacs in T1w mode with the DL model DenseNet201. Moreover, in the case of MRI planes, FCD-IIb was efficiently discriminated in the axial plane of T1w with DenseNet201. In the case of MRI planes, FCD-IIb, which has distinctive features, including dysmorphic neurons and balloon cells, was prominently distinguished by DL models with preeminent values. In addition, MobileNetV2 attained the highest classification accuracy when using the Iacs of T1w mode and the sagittal plane of FLAIR mode. Notably, the proximity of FCD-IIb was more pronounced in the axial plane of T1w mode. FCD-II lesions exhibit variable and diverse characteristics across different lobes of the brain, including different lesion sizes and locations. Moreover, these variations influence the clinical appearance, diagnosis, and treatment development. FCD-II lesions may appear in the frontal and parietal lobes, or spread to different lobes with varying characteristics. The distribution of lesions can depend on various factors, including demographic and clinical characteristics, and the underlying source of FCD-II lesions. In this dataset, most of the suspected FCD-II lesions were found in the frontal lobes (66%) and parietal lobes (24%). A high probability exists that FCD-II lesions can occur within the frontal lobe. The discrimination of distinct attributes of FCD-II lesions in the frontal and parietal lobes using the DL model is vital and useful for diagnosis. Accurate classification is essential for understanding differences in FCD-II lesion occurrence in different brain lobes and scheduling appropriate treatment procedures. FCD-II lesions in the frontal and parietal lobes were discriminated with the maximum performance values when using all images of MRI planes of T1w mode. Regarding the MRI planes, for the axial plane, the highest classification score was recorded by the DL model, DenseNet201. In addition, the lightweight model recorded the maximum discrimination scores when using Iacs and axial plane of T1w mode. Furthermore, FCD-IIa and FCD-IIb lesions in the frontal lobe were efficiently discriminated with maximum scores attained when considering Iacs and axial of T1w images. MobileNetV2 recorded the maximum classification score for the discrimination of FCD-IIa and FCD-IIb when using Iacs of T1w mode, and in the analysis of individual planes, the axial plane of the FLAIR MRI mode was suitable for efficient discrimination of the FCD-II subtypes with performance metric values ≥ 95.9%. The overall outcome of the FCD-II analysis using diverse aspects of MRI modes based on the DL framework is summarized in Table 3. The performances of the Xception and DenseNet201 models were superior, when using 2D images of all planes together as well as individual planes for both MRI modes. The Xception has a depthwise separable convolution technique that excels in extracting fine-grained details and intricate patterns from complex input data. DenseNet201 performs well in capturing both local and global features with a limited amount of data. Additionally, DenseNet201 can handle complex and subtle patterns in neuroimaging data. Moreover, we have conducted a related study with recent works associated with FCD-II lesion detection in the DL-based framework. For instance, Gill et al.28, employed a CNN model to classify MRI voxels as FCD lesions in 40 patients and achieved a sensitivity and specificity of 87% and 95%, respectively. In a similar work, Dev et al.22, utilized a CNN to train on FLAIR sequences from 1.5 T and 3 T MRI of 43 subjects to detect FCD and achieved a recall of 82.5%. Gill et al.25, utilized 3D-T1w and FLAIR MRI of 148 patients to train a CNN with Bayesian uncertainty and achieved a sensitivity of 93% overall and 83% in an independent cohort and a specificity of 89% for both HCs and epileptic patients. Wang et al.24, used T1w axial slices for cortical patch extraction, employing a deep CNN with 5 convolutional layers, a max-pooling layer, and 2 FC layers to classify FCD lesions with 85% accuracy. Aliev et al.23, employed a pre-trained autoencoder and ensemble model to classify 15 labeled and 15 unlabeled FCD subjects, along with 17 HCs, with a top-20 accuracy score of 73.3%. House et al.27, trained a CNN on a dataset of 3 T T1w and FLAIR MRI sequences from FCD patients and further applied it prospectively to 100 clinical MRIs for detecting FCDs and achieved a sensitivity of 77.8%. The reported works exhibit limitations impacting model generalizability and reliability, including dataset diversity, imbalance, and small sample sizes. Some studies lack information on FCD-II subtypes and rely solely on single MRI modalities. The consideration of different MRI planes and demographics, as well as clinical characteristics, is limited. Moreover, a lack of performance assessments of DL-based frameworks and comparisons with other DL algorithms hinders broader assessments and applicability. However, this study achieved notable performance metric values (for example, the Xception model discriminated FCD-II, with accuracies of 92.1% and 94.5%, when using images of all three planes together for FLAIR and T1w MRI modes, respectively) using 3 T FLAIR and T1w MRI in DL-based frameworks, and analysed the impacts of demographic and clinical characteristics. Such an in-depth analysis can enhance interpretation approaches and clinical decisions.
This DL-based comprehensive study has limitations. One limitation is that we used single-site MRI data. However, developing a robust and generalized framework requires diverse and new data, as the utility of developed DL frameworks is heterogeneous. Heterogeneity arises from variable post-processing operating systems, software versions, and diverse and unequal distributions of subjects in respective demographic categories, including age, sex, brain hemispheres and lobes, and data dimensions. It may be affected by morphological and intensity features, as well as the resolution of the images. Moreover, in the dataset, limited data were recorded with the different software setups, for example, two different acquisition protocols were used, including 8 and 32 channel head coils. Among the 50 FCD-II patients (aged: 11–60 years), on whom surgery was performed, 8% (50% were type IIa) and 4% (50% were type IIb) had no signs of abnormalities, respectively. The ratio of females to males was 23:27, which is almost balanced. The differing age distributions, starting at 11 years for the FCD-II and 21 years for the HCs, may influence the analysis outcomes. The number of FCD-IIa patients (only 32%) was small compared to that of FCD-IIb patients. The impact of FCD-II subtypes has not been explored in adolescents due to the small number of FCD-IIa patients. The impact of distinguishing FCD-II with diverse MRI imaging planes has not been explored for FCD-II subtypes in adults, different sexes, etc., due to limitations in the data. Additionally, analysis of the diverse impacts of FCD-II and its subtypes on brain hemispheres and lobes has been limited. Detailed information about the MRI data Table 4 Summary and statistics of the demographic characteristics of FCD-II patients (surgery was performed) and HC subjects from FCD-II patients is very constructive and organized and few patients have different dimensions (see the Supplementary Data, Dataset_1.0). In addition, most of the FCD-II FLAIR images had dimensions of 160 × 256 × 256, however, three patients (sub_53, 74, 120) had differences, such as, 320 × 320 × 30, 280 × 320 × 35, and 336 × 384 × 35. According to T1w MRI, 30 patients had dimensions of 160 × 256 × 256, 19 had dimensions of 208 × 320 × 320, and one patient (sub_44) of 192 × 320 × 320. Moreover, the MRI dimensions of the FLAIR were 160 × 256 × 256, except for sub_2 had 157 × 256 × 256, while for T1w mode, most of the MRI data of subjects had dimensions of 208 × 320 × 320, except for four subjects (sub_82, 94, 156, and 160) had dimensions of 160 × 256 × 256. Overall, the dataset is very constructive, balanced, and well-annotated for the comprehensive analysis of various facets and their impacts.
In future studies, we aim to perform comprehensive analysis with more diverse MRI data collected at other sites and to consider other modalities of clinical data. Moreover, these considerations advance the outcomes and reproducibility of the models and enhance their robustness and generalizability. In addition, we will focus on the collection of clinical characteristics and demographic data related to FCD-II for the exploration of in-depth impacts and associations in the advanced DL context. Furthermore, we aim to collect post-clinical outcomes and demographic information to systematically analyse FCD-II (FCD-IIa/FCD-IIb), and assist clinicians in treatment.
In summary, the proposed method utilizes distinct imaging planes of FLAIR and T1 MRI to classify FCD-II and its subtypes (FCD-IIa/FCD-IIb) by employing six different pre-trained DL models. In addition, the impacts of demographic (i.e., age (adolescents/adults) and sex (male/female)) and clinical (brain hemisphere (left/right) and lobe (frontal/parietal)) characteristics were investigated. This in-depth analysis could aid in the selection of suitable MRI modes, MRI planes, and DL models for specific classification tasks. (see Table 3).
Methods
We present a comprehensive analysis and detection of FCD type II based on DL frameworks using different MRI modalities (T1w and FLAIR), as well as different planes (axial, coronal, and sagittal). For this purpose, we used the open-access FCD type II MRI dataset provided by the Bonn University Hospital, and we, the investigators, had no contact with patients and HCs
Dataset description
This study anticipated available presurgery neuroimaging data (3T FLAIR and T1w MRI) of people recorded due to histologically substantiated or radiologically suspected FCD-II and subtypes of FCD type II from 2006 to 2021 by the University Hospital Bonn, Bonn, Germany42. The dataset underwent rigorous peer-review processes to ensure validity and quality42. It contains extensive documentation and metadata, providing detailed insights into data collection, participant demographics, and experimental procedures. This transparency enhances the credibility and reproducibility of research outcomes. The dataset consists of 3D-T1w and 3D-FLAIR MRI images from 85 people affected by epilepsy due to FCD type IIa and type IIb and 85 healthy controls were analysed.
Among the 85 patients with epilepsy, 35 (41.2%) were female and 50 (58.8%) were male. We selected 50 FCD-II patients who underwent surgery and 50 healthy subjects whose age and sex ratio were maintained. 3D-T1w and FLAIR MRI data of FCD-II patients included, 50 FCD-II patients, aged 11–60 years, male (M) : female (F) = 27:23, grouped mean age (µ) ± grouped standard deviation (σ): 29.2 ± 11.9 years, grouped median (ḿ): 26.7 years, and grouped standard error of the mean (SEM): 1.69.
In addition, 16 (32% of FCD-II patients, aged: 11–55 years, M : F = 9:7, µ ± σ: 23.3 ± 9.5 years, ḿ: 21 years, SEM: 2.39, no patients in the age span of 36–50 years) and 34 (aged: 11–60 years, M : F = 18:16, µ ± σ: 31.5 ± 12.6 years, ḿ: 27.6 years, SEM: 2.17, no patients in the age span of 51–55 years) FCD-IIa and FCD-IIb patients, respectively, were included. The 50 HC subjects aged: 21–60 years, M: F = 25: 25, µ ± σ: 31.2 ± 11.7 years, ḿ: 26.6 years, and SEM: 1.65 were selected at the same proportion of age (approximately the same age span) and sex as the FCD-II patients (see details in Table 3).
Demographic details of the dataset
We framed the analysis by considering six distinct aspects, including the classification of FCD-II and subtypes (IIa and IIb) as well as the impacts of age, sex, left and right hemispheres, and lobes of the brain (see Fig. 1). We chose 50 patients who underwent epileptic seizure surgery and the same number of healthy control subjects maintaining the age and sex ratios, as listed in Table 4.
Details of MRI data from selected subjects
All images were in NIfTI format and the dataset was structured according to the BIDS specifications. The MRI protocol has been adjusted according to changing clinical standards, resulting in different sequences being performed across the sample. The details of 3T FLAIR and Tw MRI scans of the FCD-II patients and HC subjects are as described below:
Imaging information of the FCD-II patients
High-resolution 3D T1-weighted and FLAIR MRI data were acquired for all people with the FCD-II. The resolution of isotropic T1 sequences differed in terms of voxel size (mm3). Among the 50 FCD-II patients, the T1w sequence were acquired for 30 (60%) with voxels of 1 mm × 1 mm × 1 mm, and the T1w sequence acquired for remaining patients were 0.8 mm × 0.8 mm × 0.8 mm. An isotropic FLAIR sequence with a size of 1 mm × 1 mm × 1 mm was recorded for all 50 selected FCD-II patients. The dimensions of most of the FLAIR MRI of FCD-II patients were 160 × 256 × 256 (94%). In addition, three patients (sub–00053(male) and sub–00074(female) (both from 16–20 years of age span)) with 320 × 320 × 30 and 280 × 320 × 35, respectively, and sub–00120(M), aged span 36–40 years with 280 × 320 × 35, had different dimensions. For T1w sequences, most of the MRI data were 160 × 256 × 256 (60%) and 208 × 320 × 320 (38%) in size, while one patient (sub–00044(male), aged: 11–15 years) had a dimension of 192 × 320 × 320.
Imaging data from HC subjects
High-resolution isotropic FLAIR sequences with voxel sizes of 1 mm × 1 mm × 1 mm were acquired for all 50 selected HC subjects. However, the T1w sequences was acquired with a voxel size of 0.8 mm × 0.8 mm × 0.8 mm for 46 HC subjects, and with a voxel size of 1 mm × 1 mm × 1 mm for the remaining HC subjects. Most of the FLAIR MRI scans of HC subjects had dimensions of 160 × 256 × 256 (98%), while a subject (sub_2, aged 50–60 years) had dimensions of 157 × 256 × 256. Most of the T1w of HC subjects had dimensions of 160 × 256 × 256 (92%) and 208 × 320 × 320 (8%) (All details are provided in the Supplementary Data, Dataset_1.0).
More details can be found at:
https://openneuro.org/datasets/ds004199/versions/1.0.1.
Preprocessing of MRI data
The preprocessing step involves preparing raw data for further analysis by applying suitable techniques to select and extract an appropriate number of slices and specific regions of interest, which enhance the quality and multiplicity of data44,45 (see Fig. 6). We considered all FCD-II patients and HC subjects to extract 2D MRI planes (axial, coronal, and sagittal) from 3D-T1w and FLAIR MRI scan followed by skull-stripping. Next, a suitable number of 2D images (slices) was selected from each plane, followed by cropping, denoising, and normalization.
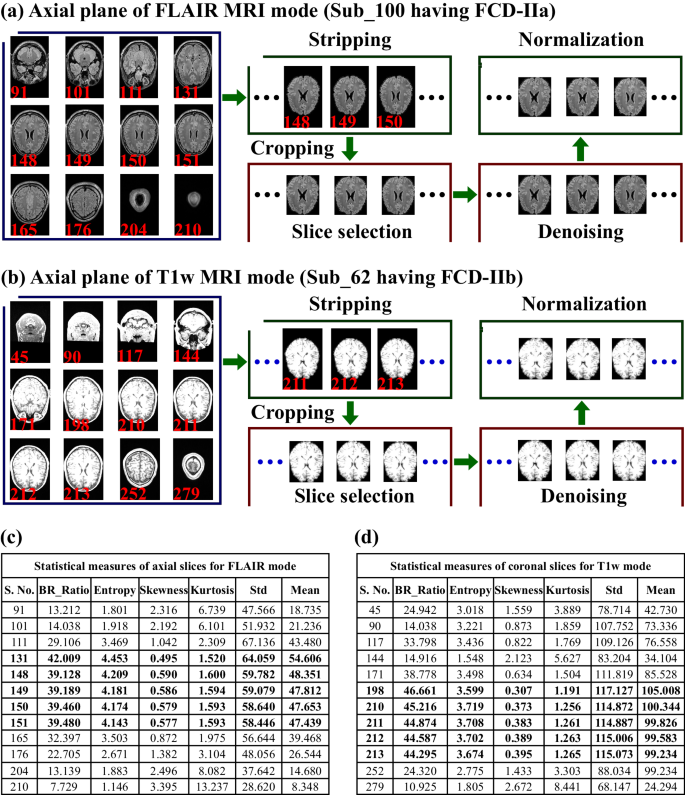
Preprocessing of MRI scans included the extraction of slices from three planes of both MRI modes, followed by skull-stripping/cropping, thereafter slice selection, denoising and normalization were performed. a For instance, the axial plane of the FLAIR MR images of an FCD-IIa patient (sub_100, aged 21–25 years, female) are shown, and c the respective statistical measures of slices are shown (with bold black text indicating selected slices). b The axial plane of the T1w images of an FCD-IIb patient (sub_62, aged 2–25 years, male) is presented, and d the corresponding statistical measures of slices are shown (bold black text shows selected slices) which were further used in the slice selection step. The BR_ratio indicates the ratio of the brain-specific region area to the whole 2D image area.
Skull-stripping
For skull-stripping, we follow a pipeline that is commonly used to isolate specific regions of interest46,47. First, we measured the threshold value by employing the OTSU thresholding technique to generate binary images followed by morphological operations, including erosion (eradicating the pixels on object boundaries, for erosion; for this purpose, we used a disk-shaped structuring element with a radius of 3 pixels) and labeling of connected components to find the largest region48. After that, binary mask images with the largest region were generated, followed by a dilation operation (with a radius of six pixels) to extract specific brain regions via elementwise multiplication of the original image and a dilated mask. Furthermore, we measured six diverse conventional statistical measures (CSMs) of each decomposed 2D image (from three imaging planes) from both FLAIR and T1w MRI modalities for the selection of imaging slices. The six measures included the mean pixel intensity (quantifying brightness level), standard deviation (variability in pixel values), skewness (dispersal of image intensities and highlighting deviations from symmetry), kurtosis (identifying image abnormalities and characteristics), entropy (highlighting areas with varying textures or patterns), and the ratio of the brain-region-to-whole-image area. These measures provide potential and hidden key information about the characteristics of images, which were further used in the selection of a suitable number of 2D images (slices) from each MRI plane.
Slice selection
A number of suitable 2D images from each plane of both MRI modes was selected using CSM measures while considering standard anatomical structures and avoiding corrupted slices44,45,49,50. We considered whole-brain regions of interest, including cerebrospinal fluid, visible gray-white matter regions, and image quality, to avoid unnecessary redundancy. For the selection of the appropriate number of image samples, we considered high mean, standard deviation, entropy, and brain-region ratio values and low values of skewness and kurtosis. In addition, we also considered the anatomical structure of the brain regions. The suitable number of slices selected from the three planes of both MRI modes for each FCD-II patient and HC subject are summarized in the Supplementary Data, Dataset_1.0 (Tables S1.0.1, S1.0.2). Due to the diversity in the image dimensions of the FCD-II and HC subjects, the number of suitable 2D images (slices) was selected in different ranges for each subject (see Supplementary Data, Dataset_1.0). The number of slices in the axial plane of the FLAIR MR images of the FCD-II subjects ranged from 7 to 35, while for the coronal plane, number of slices ranged from 5 to 35 (see the Supplementary Data, Dataset_1.0). The total numbers of images in the axial, coronal, and sagittal planes of FLAIR mode were 1202, 1076, and 983, respectively, and in the case of T1w they were 1260, 1199, and 1024, respectively. For the FLAIR images of HC subjects, 1339, 1168, and 971 were selected, whereas 1354, 1098, and 872 were selected for T1w MRI, respectively (see Supplementary Data, Material, and Dataset_1.0). Furthermore, the OTSU threshold method was employed to remove uninformative and irrelevant background information from the 2D MR images. In this threshold approach, first, the bounding rectangle was measured, followed by a cropping of the input image using the bounding rectangle coordinates.
Denoising
We employed a fast nonlocal denoising technique for all images by first estimating the noise level in the image using the mean of the sigma estimation function followed by the application of fast nonlocal denoising (we used the filter parameter, h = 1*sigma and the patch size and distance were adjusted to 10 and 2, respectively). Next, the normalization technique was employed to ensure consistent intensity ranges, aiding in fair comparisons, and accurate analysis.
Normalization
We employed the MINMAX approach to adjust in a specified range (0–255) using the minimum and maximum pixel values of the original image44. Preprocessing of three imaging planes of FLAIR MRI data of FCD-II subtypes and healthy control subjects (with the same ratio of age and sex) is shown in Fig. 6.
Input data for the pre-trained DL models
The input dimensions of the 2D images for all the pre-trained models were fixed to 224 × 224. Next, the images selected from all three planes of FLAIR mode were collectively (Iacs) and individually (ax, cr, and sg) used as input for DL models and analysed for specific classification tasks as well as for in-depth studies of the impacts of demographic and clinical characteristics. The same procedure was applied to images from T1w MRI mode for the analysis of specific tasks.
Transfer learning models
Transfer learning techniques refer to DL algorithms that improve performance when dealing with limited and composite datasets by utilizing knowledge from similar source tasks21,36,51. These approaches commonly rely on different multipart architectures and layers of architecture. The architectures enable automatic learning and capture of high-level features from data through the hierarchy of multiple layers35. In this analysis, we considered VGG16, VGG19, Xception, Inception-ResNetV2, DenseNet201, and the lightweight neural network MobileNetV2. All the pre-trained models were trained using the ImageNet database. These convolution neural network-based models were designed via transfer learning using pre-trained weights. We froze all the initial layers of each model. However, each model with the global max-pooling layer and two fully connected layers of 1024 and 512 nodes was fine-tuned to perform classification tasks. The two fully connected layers have a ReLU function and an L2 regularizer of 0.00001, along with a dropout rate of 0.5 in each pre-trained model. For all the models, the final output layer has a sigmoid function.
VGG16 and VGG19 models
Both the VGG16 and VGG19 models include convolutional layers followed by max-pooling and small 3 × 3 filters37. The fundamental DL architecture, VGG16, enables the capture of more intricate features from MRI, which is further improved by a few extra weight layers in the VGG19 model, but requires more computational resources. Both models demonstrated encouraging performance51.
Xception
The Xception model architecture is computationally efficient and has residual connections within convolution blocks38. The convolution blocks use depthwise and pointwise convolution to learn hierarchical and abstract features from input images. These characteristics have been successfully applied in complex and medical image classification. It achieved remarkable outcomes and maximum classification scores when using large amounts of data.
Inecption-ResNet201
The model employs inception blocks and residual connections to capture diverse and potential features40. It incorporates a stem block, batch normalization, and non-linear activation functions to ensure the rapid and stable convergence of model evaluation. The architectural characteristics enhance feature extraction approaches, which can benefit medical image analysis. It exhibited promising results.
DenseNet201
It integrates densely connected layers, enhancing feature reuse and improving gradient flow during training39. The efficient training model, facilitated by batch normalization and activation functions, promotes computational efficiency. It exhibits remarkable performance, particularly with limited data, which is highly valuable for medical image analysis. The highest performance metric scores and AUROCs/AUPRs values were recorded for this model for most of the classification tasks.
MobileNetV2
It is a lightweight DL network featuring inverted residuals and depthwise separable convolutions41. Its inverted residual blocks efficiently capture features while minimizing computational demands. The architecture prioritizes efficiency for critical medical image analysis tasks by learning features, making it ideal for mobile and embedded applications. The model has shown impressive performance, providing promising results with a nominal inference time. Its efficacy and adaptability have made it a preferred choice for resource-constrained environments and speed effectively.
Furthermore, each model was trained using a stratified fivefold cross-validation technique, where the samples from each task were randomly divided into training and testing sets. This approach ensures comprehensive training and evaluation of the models across different subsets of the data.
Hyperparameters of the DL models
We performed a stratified fivefold cross-validation technique, to ensure the high diversity and test of each sample of every class. For all models, the same learning rate (0.000001), optimizer (stochastic gradient descent (SGD), momentum: 0.9), loss function (binary cross-entropy), batch size (64), number of epochs (50), and kernel regularization (L2: 0.00001, fully connected layers) were used.
Performance metrics
We measured performance metrics43 for all classification tasks, including accuracy (Ac) (measures overall correctness), precision (Pr) (detects true positives), weighted F1-score (F1) (vital for imbalanced datasets), specificity (Sp) (prevents false positives), and the Matthew correlation coefficient (MCC) (offers unbiased evaluation, addressing class imbalance, robust against skewed datasets, and aids in optimal decision thresholds). In addition, the models were validated by computing the area under the ROC (AUROC) and precision–recall curve (AUPR) for each classification task; these models are adaptable and particularly useful due to their emphasis on positive class performance, compassion to imbalance, and the cost of false positives. The performance metrics ensure accurate detection, appropriate intervention in clinical decisions, and model optimization in medical image analysis.
Computational hardware and software
We processed all the data on a computing workstation with an Intel® Core(TM) i7-8700 CPU 3.20 GHz processor and an NVIDIA Tesla V100-PCIE-32GB card hardware configuration. The DL model pipeline was developed using TensorFlow (version: 2.8.0). For image analysis and visualization of 3D MRI data, the Mango (version: 4.1(1531, 2019), http://rii.uthscsa.edu/mango/) tool was used, as was a user interface to navigating image volumes. Statistical exploration and visualization of the data were completed using PAST (https://past.en.lo4d.com/windows) and the data were verified with Python (version: 3.9.7). All images were constructed using draw.io desktop version (version: 13.9.9.454, and Ink space (version: 0.92.4). Data and image processing as well as the model pipeline design code, were written using Jupyter Notebook (version: 6.4.5).


Responses