Fructose-responsive regulation by FruR in Faecalibacterium prausnitzii for its intestinal colonization

Introduction
Faecalibacterium prausnitzii, a predominant member of the human gut microbiota belonging to the phylum Bacillota1, is known for its significant contribution to intestinal health. This strictly anaerobic bacterium possesses notable anti-inflammatory properties and produces short-chain fatty acids (SCFAs) such as butyrate. Butyrate supports gut health by providing energy to colonic cells, strengthening the gut barrier, and modulating the immune system. Consequently, the presence of F. prausnitzii is often associated with a healthy gut microbiome, and its abundance is inversely correlated with various inflammatory diseases, such as inflammatory bowel disease (IBD) and Crohn’s disease2. As a result, F. prausnitzii is a subject of interest in the development of probiotic treatments and dietary interventions aimed at enhancing gut health.
The human gut microbial community is structured through the active exchange of metabolic nutrients across bacterial species and with the host3. Among the diverse resources in the gut environment, fructose has been suggested as a preferred energy source for successful colonization of bacteria within the host. For instance, Vibrio cholerae genes coding for the fructose-specific phosphoenolpyuruvate (PEP): carbohydrate phosphotransferase system (PTS), the 1-phosphofructokinase FruK, and the transcription factor FruR exhibit increased transcriptional levels during infection in a rabbit infection model4. Additionally, V. cholerae loses its competency in intestinal colonization when fruB encoding a PTSFru component or fruK is mutated5. In another example, the fructose levels in the mouse cecum positively correlate with the fecal Enterococcus levels and mouse commensal bacteria can restrict intestinal colonization of vancomycin-resistant Enterococcus strains by depleting fructose6. The abundance of F. prausnitzii is also known to positively correlate with fructose levels in human stool7. However, the mechanisms by which F. prausnitzii selectively utilizes fructose for gut adaptation remain poorly understood.
The PTS is an efficient sugar uptake system that couples the transport of sugars with their phosphorylation, integrating them into the glycolysis pathway, but also regulates various physiological processes by sensing the availability of carbon sources8. It was recently found that F. prausnitzii utilizes fructose and N-acetylglucosamine (NAG) through PTS-dependent transport9. In F. prausnitzii, HPr1 and HPr2 serve as phosphocarriers, with the histidine 15 residue transferring the phosphoryl group from enzyme I (EI) to the sugar-specific enzyme II (EII) components. The PEP-dependent phosphorylation at histidine 15 decreases when PTS-dependent carbon sources are available. In addition to the histidine 15 residue, only HPr2 has a serine 46 residue that is known to be phosphorylated by HPr kinase (HPrK) in an ATP-dependent manner and related to the metabolic regulation10. Previous studies have shown that the ATP-dependent phosphorylation at serine 46 is inhibited by PEP-dependent phosphorylation at histidine 15 of HPr and phosphorylation at serine 46 also lowers the affinity of phosphorylated EI for HPr10,11.
In many Bacillota, fructose-1,6-bisphosphate (FBP) is known as a positive allosteric effector of HPrK activity, leading to increased levels of serine-phosphorylated HPr (HPr(Ser-P))12,13,14,15,16. HPr(Ser-P) plays a crucial role in regulating the expression of several genes by interacting with transcriptional factors involved in carbon metabolism. For instance, HPr(Ser-P) acts as a corepressor of the catabolite control protein A (CcpA), a LacI-family transcriptional regulator, in Bacillus subtilis and MalR, a repressor of the maltose operons, in Enterococcus faecalis to prioritize the consumption of preferred carbon sources through carbon catabolite repression (CCR)14,17. However, the role of HPr(Ser-P) in the metabolic adaptation of F. praustnizii in the host intestine remains to be explored.
Transcription regulation of the fructose metabolic (fru) operon has been extensively studied in Gram-negative bacteria. FruR, a transcriptional regulator of the fru operon, belongs to the LacI/GalR family in Gram-negative bacteria18,19,20,21. In Escherichia coli and Pseudomonas putida, FruR (Cra) represses the fru operon by binding downstream of the transcription start site (TSS), with fructose-1-phosphate (F1P) acting as an inducer molecule18,19,20. In contrast, in Vibrio cholerae, FruR acts as an activator of the fru operon and binding of the FruR-F1P complex between the −35 and −10 elements results in a structural modification of DNA that facilitates RNA polymerase (RNAP) binding21.
In Gram-positive bacteria, FruR belongs to the DeoR family of transcriptional regulators, consisting of an N-terminal DNA-binding domain and C-terminal sensor domain possessing a ligand-binding pocket22. It has previously been reported that FruR functions as a repressor for the fru operon in Lactococcus lactis23, whereas FruR functions as an activator in Spiroplasma citri24, with F1P serving as an effector in both species. However, no mechanism has been clearly established regarding the FruR-mediated transcriptional regulation in these Gram-positive bacteria to date.
Here, we explore how F. prausnitzii responds to the availability of fructose in the animal intestine in light of the transcriptional regulation via FruR. The interaction between the transcriptional regulator and a PTS component promotes the uptake and utilization of fructose in the host intestine, enabling F. prausnitzii to adapt and colonize successfully. This study expands our understanding of how the DeoR family transcriptional regulators switch their regulatory mechanisms in response to the environmental conditions encountered in the host gut.
Results
Fructose-1-Phosphate and HPr2 are effector molecules for FruR regulation
In Lactococcus lactis, transcription of the fru operon is regulated by both CcpA and FruR23. BLAST searches against the whole F. prausnitzii A2-165 genome identified GXM22_RS08275 as the CcpA homolog and GXM22_RS09795 (denoted as FruR hereafter) as the FruR ortholog with the lowest E-values and highest similarity to CcpAs and FruRs, respectively, in other Gram-positive bacteria (Supplementary Table S1). GXM22_RS08275 had the highest similarity with CcpAs in other species among five LacI-family transcriptional regulators encoded in the F. prausnitzii A2-165 genome. To determine whether F. prausnitzii FruR and GXM22_RS08275 specifically recognizes the fru promoter, we conducted an electrophoretic mobility shift assay (EMSA) using a linear DNA template containing the full fru promoter sequence spanning −218 to + 71 relative to the transcription start site (TSS) and a negative control template spanning + 266 to + 569 relative to the TSS (Supplementary Fig. S1A). Unlike previous findings in L. lactis23, only FruR formed a complex band exclusively with the fru promoter, while GXM22_RS08275 exhibited nonspecific binding to both the fru promoter and the negative control. Consistent with this observation, while other Gram-positive bacteria possess a CcpA binding site (CRE site) within the fru promoter region23, no CRE site was identified in the F. prausnitzii fru promoter sequence (Supplementary Fig. S1B).
Given that some transcription factors are regulated by other protein factors in both Gram-positive and Gram-negative bacteria12,14,25,26,27, we hypothesized that FruR might also interact with partner protein(s) that influence its regulation of the fru operon in the presence of fructose. To identify proteins that interact with FruR, we conducted ligand-fishing experiments using FruR28, with GXM22_RS08275 as a control to verify the specificity of any FruR-interacting partners. The crude extract of F. prausnitizii A2-165 cells grown overnight at 37 °C was incubated with TALON metal-affinity resin in the presence of purified His-FruR or His-CcpA, followed by pull-down assays. We observed that a protein band with molecular mass of approximately 11 kDa was enriched only in the fraction containing His-FruR (Fig. 1A). Subsequent peptide mapping, following in-gel tryptic digestion, identified this protein as GXM22_RS11900, a histidine-containing phosphocarrier HPr29. Despite their functional similarity and sequence identity (31.33%, basic local alignment search tool (BLAST) search) between HPr1 and HPr2, only HPr2 was able to interact with FruR (Supplementary Fig. S2), suggesting that the differences in their amino acid sequences likely account for the selective interaction with FruR. Notably, GXM22_RS08275 did not interact with seryl-phosphorlyated HPr2, further suggesting that F. prausnitzii may lack typical CcpAs found in other Gram-positive bacteria (Supplementary Fig. S2C). HPr is known to play various regulatory roles not only in Gram-negative bacteria such as E. coli and V. cholerae21,29, but also in Bacillota like B. subtilis and E. faecalis14,17. Therefore, we decided to investigate how HPr2 regulates the expression of the fru operon in F. prausnitzii and explore its potential role in fructose sensing within the host intestine.

A A ligand fishing experiment was conducted to identify proteins that interact with FruR. Crude extract from F. prausnitzii A2-165 was mixed with purified 200 μg of His-FruR or His-CcpA, with protein purification buffer alone serving as a negative control. Each mixture was subjected to TALON metal affinity chromatography, and the proteins bound to His-FruR were analyzed as described in the “Methods” section. The protein size marker (Thermo Scientific, #26614) is labeled as M. The protein band corresponding to HPr2, identified by MALDI-TOF analysis, is indicated by a red arrowhead. B Purified untagged FruR (50 μg) and its mixture with each purified His-tagged form of wild-type HPr2 or the indicated phosphomimetic mutant HPr2 (50 μg) was subjected to TALON metal affinity chromatography as in panel (A). C The dissociation constants (Kd) of F1P with wild-type FruR and its mutants (5 nM each) were measured using NanoTemper Monolith NT.115pico. The Kd of F1P with the FruR(K73E) mutant and the Kd of FBP with wild-type FruR were not measurable. D The Kd of HPr2 with apo FruR, the F1P-FruR complex, and the F1P-FruR(K73E) complex were measured using NanoTemper Monolith NT.115pico. An excess of F1P (1 mM) was added to the reaction mixture to ensure full complex formation between FruR and F1P.
Since the phosphorylation state of histidine-containing phosphocarriers depends on the sugar source utilized by the bacteria, we sought to verify whether the phosphorylation state influences the interaction between FruR and HPr2 using phosphomimetic mutants of HPr2 (Fig. 1B), where histidine 15 and serine 46 were substituted with aspartate. We found that only the unphosphorylated HPr2 (lane 4) and serine-phosphomimetic HPr2 (HPr2(S46D)) (lane 6) formed complexes with FruR. In contrast, phosphorylation at histidine 15 disrupted the binding between FruR and HPr2 (lane 5 and 7). This suggests that FruR interacts with HPr2 only when F. prausnitzii utilizes PTS sugars, such as fructose and NAG9.
FruR is encoded in the same operon with FruK and the fructose-specific PTS FruA in F. prausnitzii. The phosphorylation of fructose during its uptake through FruA generates F1P, which is further converted to FBP by FruK. To determine whether F1P or FBP could act as an effector molecule of FruR in F. prausnitzii, as in other species18,19,20,21, we performed microscale thermophoresis (MST) assays. The quantitative analysis of the binding affinity between FruR and F1P revealed a dissociation constant (Kd) of approximately 1.74 μM, while no measurable interaction between FruR and FBP was detected (Fig. 1C). Then employing AutoDock Vina in PyRx virtual screening software (http://pyrx.sourceforge.io) for the molecular docking of the F1P30, we identified a F1P binding pocket in FruR. This pocket comprises basic residues including lysine 73 (K73) and K81, which form two-sided hydrogen bonds with the phosphate ion of F1P, and K195 and K213, which participate in single hydrogen bonds with the backbone of the furanose ring and the phosphate ion of F1P, respectively (Supplementary Figs. S3A and 3B). Using FruR mutants with lysine residues substituted with glutamate, we confirmed that these residues are responsible for the proper F1P binding, as evidenced by the decreased Kd values (Fig. 1C). Notably, the FruR(K73E) mutant completely lost its ability to bind F1P.
Our investigation reveals that in the presence of fructose, F. prausnitzii FruR interacts with two effector molecules, HPr2 and F1P. To determine whether these effector molecules can reciprocally influence their binding affinity to FruR, we conducted MST assays. The presence of the wild-type HPr2 facilitated F1P binding to FruR approximately four times more effectively than the presence of the HPr2(H15D) mutant, which does not interact with FruR (Fig. 1B and Supplementary Fig. S3C). Notably, F1P increased the binding affinity of HPr2 to FruR over 400-fold, with Kd values of 1.07 nM and 448.16 nM in the presence and absence of F1P, respectively (Fig. 1D). Interestingly, the FruR(K73E) mutant displayed a much higher binding affinity to HPr2 than the wild-type FruR, suggesting that substituting the K73 residue with an acidic residue may mimic the F1P-bound FruR (F1P-FruR) complex. These findings suggest that the F1P-FruR complex undergoes structural modifications that enhance its binding affinity to HPr2. While the HPr2-FruR complex may induce slight structural changes that increase the Kd value for F1P binding, this change is negligible compared to the change caused by F1P, indicating that F1P binding likely precedes HPr2 binding in the formation of the F1P-HPr2-FruR complex.
Phosphorylation of serine 46 of HPr2 is essential for transcription initiation
The presence of a PTS sugar causes the histidine 15 residue of HPr to remain unphosphorylated as its phosphoryl group is continuously transferred to the sugar via the sugar-specific EII, leading to an increase in the HPr(Ser-P)9,17. Given that F. prausnitzii transports fructose in a PTS-dependent manner, we hypothesized that transcription of the fru operon would increase when HPr2 is serine-phosphorylated, leading to transcriptional activation in the presence of fructose. To test this hypothesis, we performed in vitro transcription (IVT) assays in the presence and absence of FruR and its effector molecules (Fig. 2A). While the fruR transcript was barely detectable in the presence of FruR alone or with HPr2 or HPr2(S46D), the addition of F1P led to a measurable amount of the fru transcript in the presence of FruR, indicating that E. coli RNAP can recognize the F. prausnitzii fru promoter and F1P acts as a positive effector for FruR. As anticipated, transcription of the fru operon significantly increased when HPr2(S46D), but not wild-type HPr2, was included along with FruR and F1P. These results indicate that FruR functions as a transcriptional activator, requiring F1P as a positive effector and HPr2(Ser-P) as a coactivator for the transcription of the fru operon.
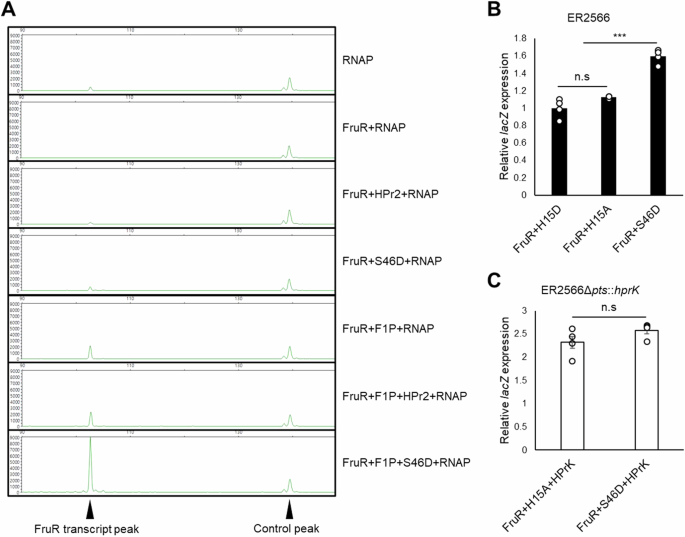
A In vitro transcription assays were performed to assess the effects of HPr2 and F1P on FruR regulation. A linear DNA template (1 μg) covering −219 to +272 bp relative to the transcription start site (TSS) of the fru promoter was incubated with E. coli RNAP holoenzyme (1 μg) in the absence or presence of FruR (4 μg), F1P (1 mM), HPr2 (4 μg), or HPr2(S46D) (4 μg) as indicated. The resulting RNA products were purified and annealed with a HEX-labelled primer, which binds to the region from +84 to +105 relative to the TSS, followed by extension using a cDNA synthesis kit as described in the “Methods” section. A 142 bp HEX-labelled control DNA, and the 105 bp fruR transcript are indicated by arrowheads. Fragment sizes were determined by comparison to the internal molecular weight standards. B A lacZ reporter assay was performed in E. coli ER2566, harboring a plasmid carrying E. coli lacZ and F. prausnitzii fruR(K73E), transcriptionally fused to the fru promoter and the constitutive cat promoter, respectively. A plasmid expressing phosphomimetic mutant HPr2 (H15D, H15A, or H15AS46D) from the cat promoter was co-transformed to verify the effects of HPr2 phosphorylation on transcriptional activation. Relative lacZ expression was determined based on Miller units in the HPr2(H15D) expressing strain. C A lacZ reporter assay was conducted in an HPrK-expressing strain, ER2566Δpts::hprK, harboring the plasmids used in panel (B) and grown in M9 medium supplemented with 0.2% glycerol. Relative lacZ expression was determined as in panel (B). Statistical significance was determined using the Student’s t-test (*P < 0.05, **P < 0.01, ***P < 0.001, n.s.: no statistical significance). Data are presented as means and SD (n = 5, independent measurements).
Next, we aimed to assess the effect of F1P and HPr2(Ser-P) on fru promoter activity in vivo. Since genetic manipulation tools for constructing targeted gene knockout mutants in F. prausnitzii are not yet available, we used an E. coli system carrying different combinations of plasmids. These plasmids included transcriptional fusions of the F. prausnitzii fru promoter to the lacZ gene and expression vectors for F. prausnitzii FruR and HPr2 variants. To circumvent indirect effects of F1P on fru promoter activity through other biochemical processes in E. coli, we used an expression vector for FruR(K73E) mimicking the F1P-FruR complex for the evaluation of the effect of F1P. Because E. coli lacks HPrK, we first used expression vectors for phosphomimetic mutants of HPr2 to evaluate the effect of HPr2’s phosphorylation state. Expression of HPr2(H15AS46D) resulted in significantly higher β-galactosidase activity compared to HPr2(H15D) and HPr2(H15A) (Fig. 2B). This result suggests that HPr2(Ser-P) forms a complex with FruR in the presence of F1P to activate expression from the fru promoter in vivo. We then engineered an E. coli strain to express F. prausnitzii HPrK to verify the dependence of FruR activity on HPr2(Ser-P) in vivo. As expected, the H15A-FruR complex activated lacZ expression to a similar level as the H15AS46D-FruR complex (Fig. 2C). This implies that F. prausnitzii HPrK can efficiently phosphorylate serine 46 of HPr2 in E. coli.
To further investigate the in vivo effect of F1P on fru promoter activity, E. coli strains were grown in LB medium supplemented with 0.2% galactose, NAG, or fructose. Consistent with previous results, the absence of HPr2(S46D) failed to initiate fruR transcription, even in the presence of fructose (Supplementary Fig. S4A). However, when a plasmid expressing HPr2(S46D) was co-transformed with a plasmid expressing FruR, fru promoter activity significantly increased exclusively in cells grown in fructose-supplemented medium. Notably, strains expressing both FruR(K73E) and HPr2(S46D) showed no significant difference in fru promoter activity, regardless of the sugar source (Supplementary Fig. S4B).
To assess the effect of different sugars encountered by F. prausnitzii in the host intestine on the HPr2 phosphorylation, we conducted an in vitro phosphorylation assay using HPrK, EI, ATP, and PEP in the presence of membrane protein extract of F. prausnitzii grown in galactose medium. Consistent with a previous study on B. subtilis showing that the phosphorylation state of HPr is dependent on the presence of PTS sugars17, phosphorylation occurred more at histidine 15 than at serine 46 when the non-PTS sugar galactose is added, whereas the addition of a PTS sugar resulted in more phosphorylation at serine 46 (Supplementary Fig. S5). The lower serine phosphorylation in the presence of galactose (31.1%) compared to fructose and NAG (74.2% and 42.4%, respectively) is likely due to increased phosphorylation at histidine 15, as predicted. It is noteworthy that fructose induced much higher serine phosphorylation than NAG did. Consistently, a ligand-fishing experiment using the crude extract of F. prausnitzii grown in YCFA medium supplemented with fructose (Fig. 1A) revealed that HPr2(Ser-P) was more abundant than dephosphorylated HPr2 (Supplementary Table S2). These results suggest that, when F. prausnitzii encounters fructose in the host environment, an increase in F1P and HPr2(Ser-P) leads to the transcriptional activation of the fru operon.
Binding of F1P to FruR alters its recognition sites on the fru promoter, enabling RNA polymerase access
In Gram-positive bacteria, FruR is a DeoR-type protein predicted to recognize four adjacent, directly repetitive sequences of 10 base pairs (TGAWWGWTTT) in the fru promoter, which are highly conserved across Bacillota23. The fru promoter of F. prausnitzii A2-165 contains eight of these repetitive sequences in the −47 to + 42 region relative to the TSS (Fig. 3A). It is noteworthy that the motifs 2 and 8 perfectly match the consensus sequence. To elucidate the functional role of these binding motifs in FruR regulation, we conducted several molecular experiments.
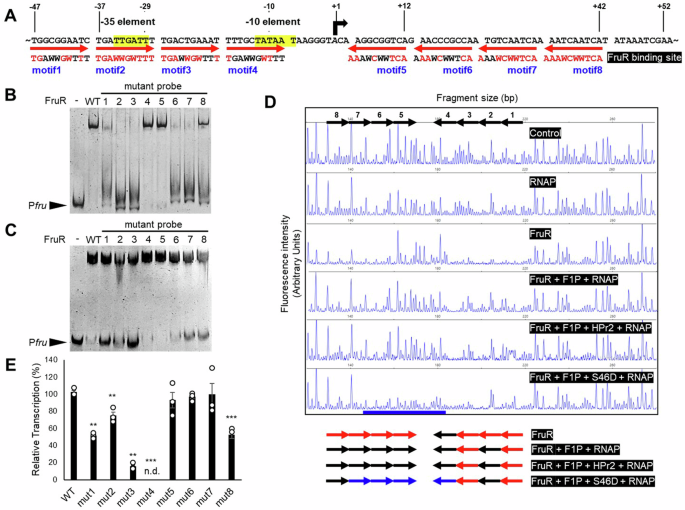
A Potential FruR-binding sites are depicted with positions relative to the TSS of the fru promoter. The bent arrow indicates the TSS, and each 10 bp binding motif is represented by a red arrow, indicating the 5’-3’ direction of the repetitive sequence. Bases identical to the TGAWWGWTTT consensus sequence are shown in red in each motif. B Mutant DNA fragments (−218 to +71 relative to the TSS; 40 ng), where the indicated motif was replaced by CATTTTCGCC, were incubated with FruR (1 μg), and their binding affinities were compared by EMSA. C The effects of HPr2 and F1P on FruR’s DNA binding pattern were assessed. Each DNA fragment (40 ng) was incubated with FruR (2 μg), HPr2(S46D) (1 μg), and F1P (0.5 mM). EMSAs were conducted on a 6% TBE polyacrylamide gel. D The effects of HPr2, F1P and FruR on RNAP binding were evaluated by DNase I footprinting. A 6-FAM-labeled reverse-complemented DNA probe (200 ng) covering −318 to +171 relative to the TSS of the fru promoter was incubated with E. coli RNAP holoenzyme (1 μg), FruR (1 μg), or both in the presence of either F1P (1 mM), HPr2 (1 μg) or HPr2(S46D) (1 μg) as indicated, prior to digestion with DNase I. Each motif is labeled with black arrows indicating the 5’-3’ direction above the panel. The motifs protected by FruR and RNAP binding are labeled with red and blue arrows, respectively, below the panel. RNAP protection sites are underlined in blue. The fluorescence intensity of the 6-FAM-labeled fragments is shown on the y-axis of each electropherogram and fragment sizes were determined by comparison with the internal molecular weight standards. E In vitro transcription assays were conducted using DNA templates (1 μg) with mutations in one motif of the fru promoter (“mut#”). Each DNA template was mixed with E. coli RNAP holoenzyme (1 μg), FruR (4 μg), F1P (1 mM), and HPr2(S46D) (4 μg). RNA products were purified, annealed with a HEX-labeled primer, and subjected to cDNA synthesis as described in Fig. 2A. Transcription levels were determined by measuring the area under the peak of the fruR transcript in arbitrary fluorescent units, relative to the transcription level of the wild-type template (WT). Statistical significance was determined using the Student’s t-test (*P < 0.05, **P < 0.01, ***P < 0.001, n.d.: not detected). Data are presented as means and SD (n = 3, independent measurements).
EMSA results demonstrated that FruR tightly binds to the promoter. Although F1P negatively modulated FruR’s DNA binding affinity, it did not completely release FruR from the promoter (Supplementary Fig. S6A), suggesting potential differences in the recognition pattern between apo-FruR and the F1P-FruR complex. EMSA results using mutant fru promoter templates, where each conserved motif was substituted with the sequence CATTTTCGCC, revealed that apo-FruR apparently binds to motifs 1, 2, 3, 6, 7, and 8 (Fig. 3B). Building on these results, we further assessed the relative affinities of each motif for apo-FruR and the F1P-HPr2(S46D)-FruR complex by comparing the bound fractions of the mutant fru promoter probes to those of the wild-type probe (Supplementary Fig. S6B and C). Bound fractions were used instead of Kd values because the exact number of FruR-bound motifs for each mutant probe, along with the potential complexity introduced by cooperativity among binding motifs, made it challenging to build an accurate interaction model. In EMSA without F1P and HPr2(S46D), FruR showed strong binding to motifs 2, 3, 6 and 7 (Fig. 3B and Supplementary Fig. S6B). However, when F1P and HPr2(S46D) were added, FruR’s affinity for motif 2 decreased, while its affinity for motifs 1 and 8 increased (Fig. 3C and Supplementary Fig. S6C). Notably, apo-FruR displayed the strongest binding to motif 2, whereas in the presence of F1P and HPr2(S46D), motif 3 exhibited the highest binding affinity. This suggests that, upon binding of F1P and HPr2(S46D), FruR loosens its interaction with motif 2, where −35 element is located. Negligible effect of mutations at motifs 4 and 5 on FruR’s DNA binding in both conditions suggests only little or no physical interaction between FruR and these motifs. These data together suggest that, while apo-FruR binds to motifs 1, 2, 3, 6, 7, and 8, thus hindering RNAP binding through spatial interference, the F1P-HPr2(Ser-P)-FruR complex mainly binds to the motifs 3 and 8 and may expose the RNAP binding site.
Consistent with the EMSA results, DNase I footprinting assays confirmed FruR’s binding to the conserved motifs of the fru promoter (Fig. 3D and Supplementary Fig. S7). FruR provided significant protection at motifs 1, 2, 3, 5, 6, 7 and 8, but negligible protection at motif 4, which shares the least similarity with the consensus sequence and includes the −10 element (Fig. 3A), both in the absence and presence of HPr2(S46D). Detailed analysis indicated that the reduction in fluorescence intensity at motifs 5 to 7 was largely restored with the addition of F1P. When RNAP was incubated alone with a DNA probe, little, if any, protection was observed compared to FruR alone (Fig. 3D). Upon the addition of F1P, FruR’s protection of the DNA became weaker, especially at motifs 2, 5, 6, and 7, where the −35 element and the regions adjacent to the TSS are located. When RNAP was co-incubated with FruR and F1P, RNAP still exhibited little binding to the fru promoter. Although F1P increases FruR’s binding affinity for HPr2 (Fig. 1D), the addition of F1P and HPr2 was not enough for binding of RNAP. However, the addition of HPr2(S46D) resulted in strong protection at motifs 4, 5, 6, and 7 by RNAP (underlined in blue, Fig. 3D) in the presence of FruR and F1P. Consistent with the IVT data (Fig. 2A), these data suggest that F1P changes the DNA-binding pattern of FruR and then HPr2(Ser-P) recruits RNAP to initiate transcription.
The sequence variations among motifs, along with the differing binding affinities observed in the assays (Fig. 3A–D, Supplementary Figs. S6B, S6C and S7), raise questions about whether the reorientation of FruR binding to each motif correlates with the level of transcription activation. To further investigate the role of these eight repetitive motifs in the FruR-mediated transcription activation, we performed IVT assays with FruR, F1P, and HPr2(S46D), using mutated DNA templates. We observed that motifs 1, 3, and 8 are crucial for transcription activation (Fig. 3E). Since motifs 2 and 4 correspond to the −35 and −10 elements, respectively, mutation of motif 2 led to a significant decrease in transcription, while mutation of motif 4 resulted in the complete loss of transcription. Although FruR showed weaker binding at motif 8 compared to motifs 1 and 3 (Fig. 3B–D), the binding of the F1P-FruR complex to motif 8 is required for efficient transcription. This is consistent with EMSA results showing an increased binding affinity of FruR to motif 8 in the presence of F1P and HPr2(S46D) (Fig. 3B, C, Supplementary Fig. S6B, and S6C). Interestingly, mutations at motifs 5, 6, and 7 induced transcription as efficiently as the wild-type promoter, suggesting that F1P-induced structural changes reduces FruR’s interaction with motifs 5, 6, and 7, allowing RNAP to initiate transcription (Fig. 3E).
Although motif 5 shared higher similarity to the consensus sequence than motif 6 (Fig. 3A), FruR displayed weaker, if any, binding to motif 5 compared to motif 6, especially in the presence of F1P (Fig. 3B–D, Supplementary Figs. S6B, S6C and S7). This prompted us to investigate how increasing motif 5’s binding affinity for FruR might affect FruR-mediated transcription activation. To test this, we substituted motif 5’s sequence with that of motif 3, which exhibited the highest affinity for FruR in the presence of F1P and HPr2(S46D) (Fig. 3C). DNase I footprinting assays using this mutated DNA probe revealed that the mutation led to stronger interaction with the F1P-HPr2(S46D)-FruR complex (Supplementary Fig. S8A). Notably, while the transcription level remained unchanged when motif 5 was replaced with the sequence CATTTTCGCC (Fig. 3E), it decreased when motif 5 was mutated to the motif 3 sequence (Supplementary Fig. S8B). This suggests that F1P-induced structural modification in FruR leads to a shift in DNA recognition, enhancing interactions with motifs critical for transcriptional activation, while reducing interactions with motifs necessary for transcription initiation.
Fructose-1-phosphate induces structural modification in FruR
Summarizing the results of a series of experiments, FruR undergoes structural changes upon binding of its effector molecules. MST results indicated that F1P induces structural modification in FruR that facilitate the binding of HPr2 (Fig. 1D and Supplementary Fig. S3C). Furthermore, EMSA and DNase I footprinting assays demonstrated that F1P alters the DNA recognition pattern and affects the strength of DNA binding (Fig. 3B–D, Supplementary Figs. S6A, and S7). To further investigate the effects of F1P on FruR structure, we performed molecular dynamics (MD) analysis using GROMACS31. The RMSD values of the F1P-FruR complex were higher than those of apo-FruR, implying that F1P increases the structural dynamics of FruR (Fig. 4A). Time-point analysis revealed that the N-terminal DNA-binding domain (DBD) of FruR was released from close contact with the C-terminal sensor domain upon F1P binding (Fig. 4B).
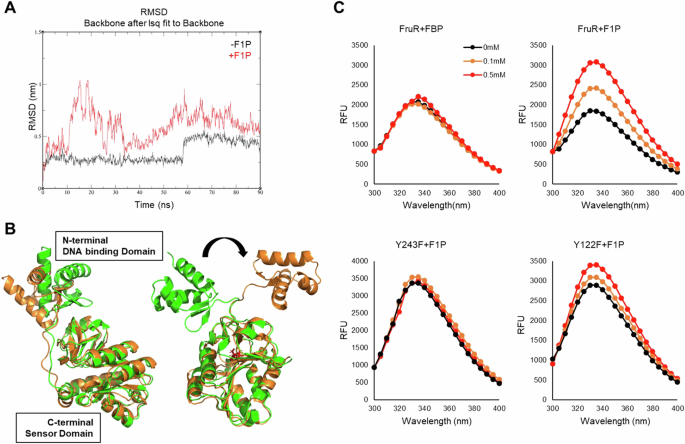
A Root mean square deviation (RMSD) values of the structures observed during 90 ns of molecular dynamics (MD) simulations were compared between FruR structures in the presence (red) and absence (black) of F1P. B Structural modifications were observed throughout the time-course analysis. Ribbon diagrams of FruR structures at 20 ns (orange) and 80 ns (green) time points for both apo FruR (left) and the F1P-FruR complex (right) were aligned using PyMOL for comparison. F1P is colored red for visualization. The N-terminal DNA binding domain and C-terminal sensor domain are indicated within white boxes. The black arrow highlights the structural change in the N-terminal DNA binding domain. C Fluorescence quenching was measured as described in the “Methods” section. FruR and FruR mutants were mixed with varying concentrations of FBP or F1P (0 mM; black, 0.1 mM; orange, 0.5 mM; red) to assess the degree of fluorescence quenching.
To understand how F1P binding induced this structural modification, we investigated the possible residues responsible for the interaction between the DBD and the C-terminal domain. Among the residues located at the interface of the two domains, the interaction between the tyrosine 243 (Y243) residue and threonine 24 (T24) shifted significantly upon F1P binding (Supplementary Fig. S9A and S9B). To confirm the increased flexibility of the N-terminal domain following the dissociation from the C-terminal domain, we substituted Y243 to phenylalanine (F) to disrupt the polar interaction between threonine and tyrosine and performed a fluorescence quenching experiment with different concentrations of F1P. Since the Y122 residue is also located in the C-terminal domain but distant from the DBD, the Y122F mutant was used as a control. While FruR and the FruR(Y122F) mutant exhibited significant structural movement in the presence of F1P, the FruR(Y243F) mutant showed little effect, suggesting that Y243 is involved in maintaining the interaction between the two domains (Fig. 4C). Thus, F1P binding disrupts this interaction by inducing structural change in the C-terminal domain of FruR. The rotation of the DNA binding domain has been linked to sequence-specific binding32. We propose that F1P binding shifts DNA recognition to target motifs 1, 3, and 8, while the F1P-induced weakening of the DNA-FruR interaction allows RNAP access to the −35 and −10 elements. The increased N-terminal domain flexibility likely reduces DNA binding affinity, facilitating release from motifs downstream of the TSS (Supplementary Figs. S6A and S7). Overall, these findings suggest that F1P binding is essential for the modulation of DNA binding by FruR, and possibly by RNAP as well.
F. prausnitzii colonization increases along with the elevated expression of the fru operon in inulin-fed mice
Dietary fibers are considered beneficial nutrients for health. Chitin-glucan and inulin are known to induce changes in human gut microbiota composition33,34. While chitinolytic bacteria in mammalian gut mainly belong to the Lachnospiraceae family35, F. prausnitzii is known to be an efficient degrader of inulin. Recent studies have shown that inulin-grown F. prausnitzii releases free fructose, which efficiently promotes the growth of intestinal epithelial (Caco-2) cells, when cocultured7. Additionally, the protein level of the PTSFru significantly increases in F. prausnitzii grown on inulin36. To assess whether the expression level of the fru operon is also regulated in the animal intestine and is relevant to the colonization ability of F. prausnitzii, we used a mouse model fed a normal chow diet (NCD) supplemented with either inulin or chitin (Fig. 5). These diets were formulated to deliver fructose and NAG to the large intestine, as inulin and chitin are polymers of fructose and NAG, respectively. Chitin was used as a control because, although NAG also increases HPr2(Ser-P) (Supplementary Fig. S5), it does not influence the expression of the fru operon. Before bacterial gavage, mice were administered an antibiotic cocktail ad libitum to remove resident gut microbes that might influence the colonization of F. prausnitzii (see “Methods”; Fig. 5A). Consistent with a previous study37, the group fed a 10% inulin-supplemented NCD not only showed better colonization than the control groups fed either NCD alone or a 10% chitin-supplemented NCD, but also persisted longer in the mouse intestine (Fig. 5B).
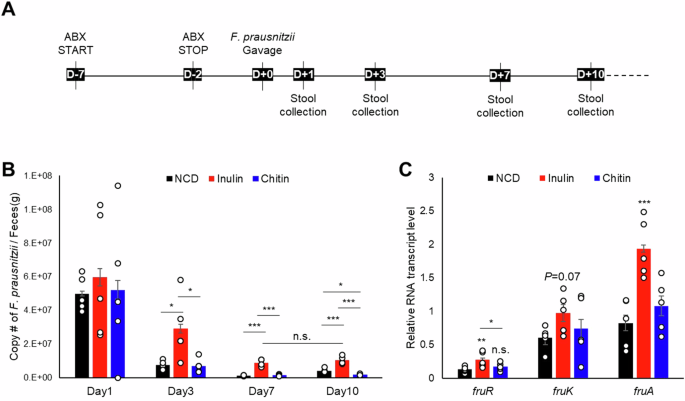
A Three groups of mice were fed a normal chow diet (NCD), an inulin-supplemented NCD, or a chitin-supplemented NCD for one month prior to gavage with F. prausnitzii. Each group was treated with a cocktail of antibiotics for five days to remove residual gut microbes. After a two-day recovery period from the antibiotic treatment, each mouse was orally inoculated with 1011 cells of F. prausnitzii. Stool samples were collected on the indicated days post-gavage to determine the abundance of F. prausnitzii. B The copy number of F. prausnitzii per gram of feces was quantified by quantitative real-time PCR and compared between the groups and the days on which stool samples were collected. C Relative mRNA transcript levels of fruR, fruK, and fruA in F. prausnitzii extracted from mouse stool were compared between the groups. Statistical significance was determined using the Student’s t-test (*P < 0.05, **P < 0.01, ***P < 0.001, n.s.: no statistical significance). Data are presented as means and SD (n = 5, independent measurements).
In Gram-positive bacteria, 1-phosphofructokinase (fruK) and a fructose-specific PTS transporter EII component (fruA) are encoded downstream of the DeoR family transcriptional regulator (fruR) in the fru operon (Supplementary Fig. S10A). Analysis of the RNA sequencing dataset (ref. 9, accession number PRJNA224116) from cells grown in YCFA media supplemented with designated carbon sources revealed significant upregulation of the fru operon in the presence of fructose (Supplementary Fig. S10B and S10C). To confirm the regulation of fru operon in response to fructose in vivo, we extracted RNA from stool samples collected on Day 3. Notably, the expression levels of the genes in the fru operon were significantly upregulated when mice were fed the inulin diet, but not the chitin diet (Fig. 5C). This suggests that F. prausnizii prefers an environment where fructose is available and precisely regulates the fru operon in response to fructose, enabling it to efficiently adapt and colonize in the gut environment.
Discussion
The human gut microbiome plays a crucial role in host health, with F. prausnitzii being a key commensal bacterium. In the competitive environment of the gut, the ability to efficiently detect and utilize carbon sources ahead of other bacteria is critical for outcompeting rivals and maintaining colonization. Fructose utilization via the fru operon appears to be particularly important for F. prausnitzii colonization and persistence in the gut, as it is positively correlated with fructose levels in the human intestine7. F. prausnitzii transports fructose, its major energy source in the gut often derived from inulin or oligofructose38,39, via PTS, where it is phosphorylated to F1P as it enters the cell and is simultaneously integrated into the glycolytic pathway9. In this study, we explored the regulatory mechanisms of the DeoR family transcriptional regulator FruR, focusing on the roles of F1P and the histidine-containing phosphocarrier protein HPr2, and highlight the complex regulation of the fru operon in F. prausnitzii.
In most Bacillota, FruR recognizes four repeats of the TGAWWGWTTT sequence located upstream of the −10 element, spanning the −35 element, and plays a role in repressing the fru operon23. In F. prausnitzii, the fru promoter contains eight of these repeats; four located upstream of the TSS, spanning both the −35 and −10 elements, while the other four positioned downstream of the TSS (Fig. 3A). In the absence of fructose, FruR binds to motifs both upstream and downstream of the TSS, preventing the RNAP holoenzyme from binding (Fig. 6). When fructose becomes available in the host intestine, F1P binds to FruR with high affinity, enhancing FruR’s interaction with its coactivator, HPr2(Ser-P) (Fig. 1C and Supplementary Fig. S3C), and inducing structural changes in FruR. These changes cause FruR to dissociate from the −35 and −10 elements, allowing RNAP to bind and initiate transcription (Fig. 3B–E). In this way, FruR functions as a transcriptional activator in the presence of its two effectors, F1P and HPr2(Ser-P), in F. prausnitzii. It is noteworthy that the regulation of FruR by HPr has also been recently reported in V. cholerae, where HPr inhibits FruR-mediated facilitation of RNAP binding to the fru promoter, in contrast to its role in F. prausnitzii27.
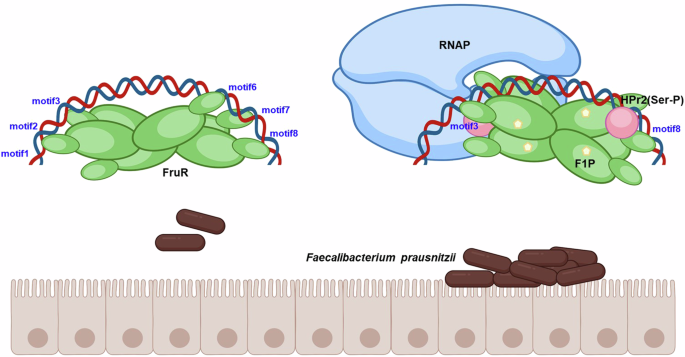
Prior to fructose exposure in the host intestine, FruR hinders RNAP interaction with the fru promoter by binding to motifs that cover the −35 and −10 elements. When fructose is available, it is transported into bacterial cells as fructose-1-phosphate (F1P) via the PTS phosphorelay system involving EI, HPr1, HPr2 and fructose-specific EII, with HPr2 undergoing serine phosphorylation. FruR then forms a complex with F1P, leading to its dissociation from the −35 and −10 elements as well as TSS downstream region, thereby freeing the RNAP binding site. Serine-phosphorylated HPr2 subsequently binds to the F1P-FruR complex, resulting in the formation of the F1P-HPr2(Ser-P)-FruR complex. This complex then facilitates RNAP binding to the −35 and −10 elements of the fru promoter, initiating transcription.
Since serine phosphorylation of HPr2 increases in environments rich in PTS sugars, and HPr2(Ser-P) binding to FruR alone is insufficient to activate fru operon transcription, F1P binding and its regulation of FruR’s binding to the specific motifs are crucial for proper regulation. This explains why, of the two PTS sugars, only fructose, and not NAG, can induce transcription of the fru operon (Fig. 5). Some transcriptional activators bind to the spacer sequence between the −35 and −10 elements of target promoters to optimize the binding of the RNAP sigma factor40. In F. prausnitzii, binding of the F1P-HPr2(Ser-P)-FruR complex to motif 3 appears to make the −35 and −10 elements of the fru promoter more easily accessible for RNAP, as a mutation in motif 3 nearly abolishes transcription (Fig. 3E). Structural studies are needed to clarify why only the HPr2(Ser-P) facilitates RNAP binding, leading to a transcriptional burst in the presence of FruR and F1P.
It is noteworthy that two HPr proteins exist in F. prausnitzii. In a previous study9, we speculated that HPr1 primarily participates in transferring the PEP-derived phosphate group from EI to PTS sugars via EII components, while HPr2 may play a regulatory role due to its strong phosphorylation at serine 46 but weak phosphorylation at histidine 15. Given that HPr1 is more efficiently phosphorylated by EI than HPr29, it is anticipated that HPr1 plays a major role in the transport and concomitant phosphorylation of fructose via FruA. The presence of fructose also increases HPr2(Ser-P) (Supplementary Fig. S5), enabling HPr2 to act as a coactivator of FruR, together with F1P, to strongly induce the expression of FruA and FruK, thus feeding fructose into glycolysis. Consequently, the presence of both HPr1 and HPr2 allows F. prausnitzii to fine-tune its fructose metabolism more precisely by separating the function of sugar transport (HPr1) from transcriptional regulation (HPr2). This division of roles might facilitate more efficient adaptation to fluctuating carbon sources in the gut and optimize energy usage, giving F. prausnitzii a competitive edge over other organisms, including most Bacillota that rely solely on a single HPr protein containing both histidine 15 and serine 46 residues, serving both catalytic and regulatory functions10. Further in vivo studies are needed to explore how these mechanisms enhance F. prausnitzii’s competitive advantage in colonizing the host, particularly in light of sensing and utilizing fructose.
Unlike other Bacillota, most Bacillus species possess a catabolite repression HPr-like protein (Crh) in addition to HPr. Crh is structurally similar to HPr, containing a serine 46 residue but lacking the histidine 15 residue required for PTS function. Crh, primarily studied in B. subtilis, has been implicated in CCR, where serine-phosphorylated Crh functions as a corepressor for CcpA10,41. However, studies suggest that serine-phosphorylated HPr alone is sufficient for CCR, implying that Crh may have additional, yet unknown, roles beyond CCR10,42.
In this study, we elucidated a regulatory role of HPr2(Ser-P) in facilitating RNAP binding to the fru promoter as a coactivator of FruR in the presence of fructose (Figs. 2A and 3B). HPr2 is likely to have a broader role in the metabolic regulation of F. prausnitzii compared to other Bacillota. Further studies on its functionality could deepen our understanding of F. prausnitzii physiology. Exploring these unique regulatory mechanisms may offer valuable insights into how F. prausnitzii adapts to and thrives within the human gut ecosystem, thereby enhancing our knowledge of host-microbe interactions.
Materials and Methods
Bacterial strains, plasmids, and culture conditions
The bacterial strains and plasmids used in this study are listed in Supplementary Table S3. Faecalibacterium prausnitzii A2-165 was cultured in YCFA medium as described previously9. Escherichia coli strains were cultured in Luria-Bertani (LB) medium. The following supplements were added if necessary: ampicillin, 100 μg ml−1; chloramphenicol, 20 μg ml−1; isopropyl-β-D-1-thiogalactopyranoside (IPTG), 238 μg ml−1; 5-bromo-4-chloro-3-indolyl-β-D-galactopyranoside (X-gal), 80 μg ml−1.
Purification of overexpressed proteins
Proteins were expressed in an E. coli ER2566 strain lacking ptsHIcrr, following previously described methods9,43. Briefly, His-tagged proteins were purified using TALON metal-affinity resin (Takara Bio, Inc., Otsu, Japan, #635507) according to the manufacturer’s protocol. Eluted fractions containing His-tagged proteins were further purified using a Hiload 16/60 Superdex 200 pg column (GE Healthcare) equilibrated with buffer A (20 mM Tris-HCl (pH 7.5), 300 mM NaCl, 5 mM β-mercaptoethanol, and 10% glycerol) to enhance protein purity and remove imidazole.
Ligand fishing using metal-affinity beads
Ligand-fishing experiments were performed, with minor modifications, to identify potential interaction partners of FruR43,44. Briefly, Faecalibacterium prausnitzii A2-165 cells were cultured overnight at 37 °C in YCFA medium supplemented with 0.5% fructose, harvested, and resuspended in lysis buffer (20 mM Tris-HCl, pH 8.0; 150 mM NaCl; 10 mM MgCl2; 1 mM PMSF; 5 mM β-mercaptoethanol; 10% glycerol) for ultrasonication. The lysate was incubated with 100 µg of His-FruR or buffer A (control) and TALON metal-affinity resin at 4 °C for 30 min. Bound proteins were eluted using buffer A containing 200 mM imidazole, separated by SDS-PAGE (4–20% gradient Tris-glycine gel, KOMA Biotech), and stained with Coomassie Brilliant Blue R. Protein bands specific to His-tagged FruR binding were excised, followed by in-gel digestion and peptide identification via MALDI-TOF MS29.
MST analysis
The binding affinities between FruR and F1P were measured using a NanoTemper Monolith NT.115pico instrument as previously described in refs. 43,45. Purified FruR was labeled with NT-647 using a Monolith protein-labeling kit and used at a concentration of 5 nM. Unlabeled HPr2 and F1P (Santa Cruz Biotechnology, Inc., Dallas, TX, USA, #sc-285345) were titrated in a 1:1 serial dilution in MST-binding buffer (25 mM HEPES-NaOH (pH 8.5), 300 mM NaCl, 2 mM TCEP, 0.05% bovine serum albumin (BSA), 0.05% (v/v) Tween 20) with maximum concentration of 50 nM HPr2 and 500 μM F1P. Measurements were conducted at 15% LED power and 30% MST power at 25 °C.
In vitro transcription (IVT)
In vitro transcription assays were performed with minor modifications from previously described methods27,46. Briefly, a 490 bp DNA template ( −219 to +272 bp relative to TSS) was prepared by PCR from pACYC-Pfru::FruR using primers FruR_pro_F and Pfru_IVT_R (Supplementary Table S4). Each reaction included 1 µg of DNA template, 2 µg FruR, and either 1 mM F1P or 5 µg HPr2 in a 36 µl volume with RNA polymerase buffer (NEB #M0550S). After a 15 min pre-incubation at 37 °C, NTPs (0.5 mM each, Invitrogen #18109017), 40 units of RNaseOUT™ (Invitrogen #10777019), and E. coli RNA polymerase holoenzyme (NEB #M0551S) were added, and the mixture was incubated for 1 h at 37 °C. DNA was then digested with DNase I (NEB #M0303S) for 30 min at 37 °C, and RNA was extracted using acid phenol-chloroform (Ambion #AM9722) and ethanol-precipitation. Purified RNA was annealed with HEX-labeled primer Pfru_IVT_R (HEX) or PfrulacZ_IVT_R (HEX) complementary to positions +84 to +105 relative to the TSS (Supplementary Table S4) at 65 °C for 15 min. cDNA synthesis was performed using the RNA to cDNA EcoDry Premix (Clontech #639545). A 142 bp HEX-labeled DNA fragment, prepared using Pfru_IVT_F and Pfru_IVT_R (HEX), was added to each sample at 0.1 ng/µl for calibration. Samples were analyzed using an ABI 3730xl DNA analyzer and Peak Scanner software v1.0 (Applied Biosystems).
β-galactosidase assay
Escherichia coli ER2566, ER2566Δpts and ER2566Δpts::hprK strains were transformed with a plasmid carrying E. coli lacZ and F. prausnitzii fruR or fruR(K73E), each transcriptionally fused to the fru promoter and the constitutive cat promoter. To evaluate the effects of HPr2 phosphorylation on transcriptional activation, a plasmid expressing the phosphomimetic mutant HPr2 (H15D, H15A, S46D or H15AS46D) under the control of the cat promoter was co-transformed. Cells were grown in M9 minimal medium supplemented with 0.2% glycerol to access HPrK activity and in LB medium supplemented with 0.2% galactose, N-acetylglucosamine, or fructose to evaluate the effects of F1P on the β-galactosidase activity. Cultured cells (80 μl) were 10-fold diluted in Z-buffer (0.06 M Na2HPO4, 0.04 M NaH2PO4, 0.01 M KCl, 1 mM MgSO4 and 0.04 M β-mercaptoethanol) and lysed with 20 μl 0.1% SDS and 40 μl chloroform at 37 °C for 15 min. The β-galactosidase activity was then measured as described by Miller47.
DNase I footprinting
DNase I footprinting experiments were performed with minor modifications from previously described methods27,48. Briefly, a 289 bp or 489 bp 6-FAM-labeled DNA probe spanning the fru promoter region was amplified from Faecalibacterium prausnitzii A2-165 genomic DNA using 5’ 6-carboxyfluorescein (6-FAM)-labeled primers (Supplementary Table S4). The purified probe was incubated with specified concentrations of proteins and metabolites in reaction buffer (10 mM Tris-HCl, pH 7.5; 5% glycerol; 1 mM DTT; 5 mM MgCl2; 100 mM KCl; 50 ng/µl BSA) at 37 °C for 15 min. DNase I (0.04 U, NEB #M0303S) was then added, and digestion proceeded for 1 min at 37 °C. The reaction was terminated with stop solution (200 mM NaCl, 30 mM EDTA, 1% SDS) and incubated at 75 °C for 10 min. DNA fragments were purified by phenol extraction and ethanol precipitation, then analyzed via capillary electrophoresis on an ABI 3730xl DNA Analyzer using Peak Scanner software v1.0 (Applied Biosystems).
Electrophoretic mobility shift assay (EMSA)
EMSA was performed as previously described in ref. 19. A 289 bp DNA fragment encompassing the full-length fru promoter (−218 to +71 relative to the TSS) was amplified by PCR using F. prausnitzii A2-165 genomic DNA as a template. Linear DNA templates with mutated FruR-binding motifs were generated by PCR using the pJK-Pfru::lacZ mutants (see Supplementary Table S3), using the same primers. The DNA templates were incubated with the indicated proteins and metabolites in TGED buffer (10 mM Tris–HCl, pH 7.5; 5% v/v glycerol; 0.1 mM EDTA; 1 mM DTT) and supplemented with 200 μg ml–1 BSA as a non-specific protein competitor at 37 °C for 15 min. Following incubation, the samples were resolved on a 6% polyacrylamide gel (acrylamide/bisacrylamide ratio of 29:1) in TBE buffer (89 mM Tris, 89 mM boric acid, 2 mM EDTA), stained with ethidium bromide (EtBr), and visualized using a gel documentation system (GDS-200C, KBT, Seongnam, Korea).
Molecular dynamics (MD) simulation for apo-FruR and F1P-bound FruR
MD simulations were preformed using GROMACS31. Both apo-FruR and the F1P-bound FruR complex were solvated with TIP3P water molecules and 150 mM NaCl, prepared using the CHARMM-GUI Solution Builder49. The solvated systems were placed in a cubic box with dimensions of 20 × 20 x 20 nm3 and subjected to energy minimization, followed by a 50 ps relaxation over 5000 steps using GROMACS’ minimization protocol. Simulations were conducted in the NPT ensemble, with isotropic pressure maintained at 1 atm using the Parrinello-Rahman barostat and temperature set to 303.15 K using the Nose-Hoover thermostat50,51,52,53. Both apo-FruR and the F1P-FruR complex were simulated for 100 ns, with trajectory snapshots saved every 100 ps for detailed analysis. Trajectory data were further analyzed using PyMOL54.
Intrinsic tryptophan fluorescence measurements
Fluorescence measurements were performed as previously described55. Briefly, fluorescence was measured using a FlexStation® 3 Multi-Mode Microplate Reader with an excitation at 280 nm at 37 °C. The spectral bandwidths were set to 5 nm for excitation and 10 nm for emission. Emission spectra were recorded between 300 and 400 nm. FruR, FruR(Y122F), and FruR(Y243F) were each prepared at 100 μg ml−1 in 20 mM HEPES (pH 7.5) containing 300 mM NaCl, 5 mM β-mercaptoethanol, and 10% glycerol. For Kd determination, various concentrations of FBP or F1P (ranging from 0 to 0.5 mM) were tested to assess the extent of fluorescence quenching.
Mouse model experiment
Eight-week-old mice were randomly assigned to one of three groups: a control group on normal chow diet (NCD), a group on a 10% inulin-supplemented NCD, and a group on a 10% chitin supplemented NCD (n = 5 per group). The diets were manufactured based on the 2018 Teklad Global 18% Protein Rodent Diet (DooYeol Biotech, Seoul, Korea) recipe. All groups were administered an antibiotic cocktail (0.5 mg ml−1 ampicillin, 0.5 mg ml−1 neomycin, 0.5 mg ml−1 tetramycin, 0.5 mg ml−1 streptomycin, 0.25 mg ml−1 vancomycin) ad libitum for five days. After two days of recovery from antibiotic treatment, approximately 1011 CFU of F. prausnitzii cells in PBS were delivered via oral gavage. Stool samples were collected daily from each mouse over a 24 h period to monitor the colonization of F. prausnitzii, as depicted in Fig. 5A.
Total DNA was extracted from the stool samples using the GeneAll® GENTi™ Advanced Fecal DNA/RNA Kit with GENTi™ 32 Advanced Automatic Extraction Equipment (GeneAll, Seoul, Korea). DNA (10 ng) was subjected to real-time PCR amplification using a FAST SYBR green master mix kit (Life Technologies, Carlsbad, CA) with F. prausnitzii A2-165-specific primers in a CFX96 Real-Time System (Bio-Rad, Hercules, CA).
For total RNA extraction, stool samples were bead-beaten for 10 s using 100 mg of ZR BashingBeads (Zymo Research, CA, USA, #S6012-50) and 700 μl of RNAiso plus solution (Takara Bio, Inc., Otsu, Japan, #9108). RNA isolation and ethanol precipitation were performed according to the manufacturer’s protocol. The isolated RNA was converted to cDNA as described earlier in the IVT section.
Statistics and reproducibility
All data are presented as the means ± SD from at least three independent experiments. Statistical analysis of RNA sequencing data was performed using DESeq2 (v1.32.0) with default settings, applying a minimum significance threshold of P < 0.05 after False Discovery Rate (FDR) correction for multiple testing. Statistical significance was defined as P < 0.05 and represented in bar plots as follows: *P < 0.05, **P < 0.01, ***P < 0.001, and n.s.: not significant.
Reporting summary
Further information on research design is available in the Nature Portfolio Reporting Summary linked to this article.


Responses