Full recovery of brines at normal temperature with process-heat-supplied coupled air-carried evaporating separation (ACES) cycle
 cycle")
Introduction
Achieving harmonious coexistence between human beings and nature is an indispensable goal for the sustainable development of all humankind1, in which promoting healthy and green recycling of water resources is also an important section on the road to green and sustainable development for all countries2. Carrying out clean, efficient and green recycling of wastewater is of great significance, which not only reduces the proliferation of water pollution, but also solves the problem of water shortage and reduces the comprehensive energy consumption of the water treatment industry chain, which is a multi-purpose endeavor.
Saline wastewater is a prevalent and typical recyclable wastewater, which is characterized by a huge amount of discharge. In 2022, the total wastewater discharge in China reached 69.97 billion tons, of which about 42% is recyclable saline wastewater3. Recovery of saline wastewater can effectively diminish the consumption of water resources and cut down the pollution discharge, whether it is for desalination4, chemical industry5, agricultural irrigation6 or fishery cultivation7. However, the current recovery technology is not satisfactory and the biggest drawback is that “zero discharge” and “energy efficient” cannot be attained concurrently8.
Currently, complete saline wastewater treatment process can be divided into three major steps: pretreatment, concentration and separation9. The pretreatment process focuses on the removal of impurities and some volatile substances from saline wastewater, mainly by filtration and biochemical methods. Concentration process is to concentrate the low concentration of saline wastewater, to recover a certain amount of water within it, and at the same time to increase the concentration for the subsequent separation arrangement. The separation process is the final step, which requires the complete separation of the concentrated wastewater into water and solid salts, which is traditionally achieved by heating and evaporation. Among them, the separation step is the most significant, which is directly related to the wastewater “zero discharge” and “water-salt recovery” and also the highest energy consumption in the process. Conventional evaporation separation technologies are incredibly energy-intensive, and its continued use of fossil fuels is neither sustainable nor eco-friendly. Therefore, in recent years, researchers have started to explore clean energy-driven, especially solar-driven saline wastewater evaporation separation technology10. The present solar-powered saline wastewater evaporation treatment technologies can be classified into the following three categories:
Mechanism of solar still evaporation (SE) technology involves direct irradiation of saline wastewater by the specific solar distillation unit, which allows direct evaporation of water for the separation purpose11. These systems are inherently simple and inexpensive to manufacture, while possessing a decent energy efficiency (nearly 50%)12. Elementary solar static distillation systems certainly have a low rate of water recovery, and there are numerous investigations devoted to improving this problem. For example, the solar multi-stage distillation technique summarized by Peng et al.13 improves the system efficiency by achieving evaporation energy recovery, while Delpisheh et al.14 effectively improves the system operational stability by using a thermosensitive oil-66 as a thermal storage medium for the solar SE desalination. However, the conventional solar SE system has an obvious drawback, namely, if the complete evaporation of saline wastewater is required, a high temperature heat source is necessary. However, relying on solar energy alone for heating is rarely enough to provide a continuous source of high temperature heat source, and in practical engineering applications, designers usually configure an additional set of electric or gas-fired heating devices. Relying on such additional equipment to supplement energy limits the share of clean energy in replacing traditional energy sources for energy supply, thus increasing the consumption of traditional energy sources, and the overall energy efficiency of the system cannot be improved either. Conversely, maintaining low temperature heat source by only solar energy does not allow for the complete separation of saline wastewater. Accordingly, solar SE technology cannot fulfil the dual requirements of “full recovery” and “high energy efficiency” simultaneously.
The mechanism of solar interfacial evaporation (IE) technology is to locally heat the wastewater interface to promote the evaporation driving potential of the wastewater at the interface, which can effectively break the limit of evaporation efficiency under the traditional volumetric heating15. The biggest advantage of this technology is the high evaporation efficiency, which is applied to make up for the short board of solar SE technology with low efficiency. At present, many academics are committed to identifying novel interfacial evaporation materials to further improve its applicability16, for example, Li et al.17 designed an interfacial evaporation material with a three-dimensional interconnected porous structure of carbon foam, whose evaporation rate can reach 10.9 kg/(m2·h), which is 7.5 times of the theoretical upper limit of the traditional system. However, the efficiency of solar IE technology when applied in real solar evaporators is only about 40%18, and it also fails to achieve complete separation and recovery of water and salt. Since interfacial evaporation does not essentially change the mechanism of wastewater evaporation, under the same conditions, the comprehensive energy utilization of interfacial evaporation and volumetric evaporation is consistent, only that interfacial evaporation responds faster19. Therefore, current solar IE technologies are equally incapable of achieving the simultaneous coexistence of “full recovery” and “energy efficient”.
Solar air-carried evaporating separation (ACES) technology, differs from regular technology in that it relies on air as the medium for evaporating separation principle and utilizes the difference in air’s capacity to carry water at different temperatures to evaporate, migrate and recover wastewater20. This technology allows to encompass various forms of energy supply such as air collection21, wastewater collection22, integrated collection23 and photovoltaic energy supply24. Therefore, solar ACES technology can effectively adapt to the treatment demands of saline wastewater with large fluctuations in concentration. At present, the typical applications of solar ACES technology include two types of systems: solar humidification and dehumidification (HDH) system, which focuses on high-efficiency saline wastewater water recovery; and solar air cycle evaporation and separation (AES) system, which focuses on the treatment of saline wastewater with “zero discharge”. The solar HDH system proposed by Kabeel25 can produce up to 6.7 kg/m3 of water per day with a gained output ratio (GOR) of 1.65 through the configuration of a new and improved spiral humidification tower, while the air bubbling solar AES system proposed by Sobhani26 can increase the rate of water recycling by 34.7% and the overall energy efficiency by 8.8% in comparison with the conventional system. In addition, in our previous work27, double-stage solar AES system was proposed, which ensures “full recovery” of brine from saline wastewater and maintains a considerable operational efficiency (from 44.7% for single-stage to 61.6% for double-stage). However, despite the fact that some modern systems have achieved “full recovery” of saline wastewater, the performance of these systems cannot be described as “energy efficient”. Due to the necessary air temperature for drying separation (above 90 °C)28, current solar ACES systems have to be set at higher operating temperatures, which also limits the energy efficiency of the system.
Collectively, the typical systems corresponding to the three different types of solar-powered brine evaporation technologies mentioned above can be illustrated in Table 1. With reference to the water and solid salt recovery ratios and energy efficiency of these typical systems, it can be discovered that: systems that can achieve high water recovery and high system energy efficiency (such as those mentioned in the literature14 and16) have a solid salt recovery ratio of 0; while systems that can recover both water and solid salt, namely, those that can satisfy the demand for ‘full recovery’ (such as literature27 and29), generally have a system energy efficiency below 65%. This means that the ‘full recovery’ and ‘high energy efficiency’ of existing solar-powered brine evaporation systems seem to be contradictory.
From the above literature surveys, it can be noted that the current solar evaporation technologies are unable to realize the dual demands of “full recovery” and “high energy efficiency” of saline wastewater. The following two key technological differences are crucial:
-
(1)
Divergence between high operating temperatures and high efficiency: The solar evaporating separation process used in the current system is essentially a process in which the fluid absorbs heat and increases its temperature to reach a critical state of evaporation for a complete separation. This results in a critical temperature (>90°C) that must be exceeded to achieve total separation of saline wastewater. However, high operating temperatures reduce the efficiency of solar collection, forcing systems to be replenished with fossil energy, thus reducing the cleanliness and efficiency.
-
(2)
Divergence between large temperature differences and energy recovery: Recuperation of evaporation latent heat in solar evaporating separation of saline wastewater can substantially reduce the energy consumption of the system. However, high operating temperatures lead to a large temperature difference between evaporation and condensation, which prevents the latent heat recovery heat pump technology (the larger the temperature difference, the lower the efficiency) from operating efficiently.
Thus, these two major divergences converge on the same key scientific question: how to reduce the excessively high operating temperatures in the solar evaporating separation thermodynamic process on the premise that the salts in the saline wastewater can be dried and separated? Although the above-mentioned divergent issues are not solved at present, the methods of process energy supply used in some special cases30,31,32 give the possibility to maintain a favorable evaporation rate of the wastewater brine, while maintaining the conventional temperature (around 50 °C). There exists a common feature that solar energy is directly applied to the process of evaporating separation of wastewater, rather than relying on a medium (air, wastewater, etc.). We designate this novel approach to providing heat as process-heat-supplied. In terms of changes in the overall thermodynamic process, this approach effectively avoids the problem of evaporation limitation problem caused by the mismatch between heat and mass transfer in the medium itself. This also gives the possibility to solve the key scientific problem mentioned above.
Consequently, the aim of this work is to implement that the saline wastewater can be completely evaporated and separated by adopting the process-heat-supplied action in the ACES cycle under the operating temperature of 45~60 °C. In addition, this work also aims to investigate the thermodynamic mechanism and process-related thermodynamic characteristics of the complete separation of water and salt from wastewater under process heat feed, so as to provide a theoretical basis for further research and development of this type of system in future.
Methods
In this paper, comprehensive investigations of the novel ACES cycle coupled process-heat-supplied is carried out adopting both experimental and simulation methodologies. The performance experiments of the evaporating separation unit with process-heat-supplied can effectively verify the feasibility at normal temperature (around 45 °C) and obtain the evaporating separation performance of this innovative unit, while the thermodynamic simulation can complement the subtle variations of the internal processes that cannot be measured by the experiments, and provide a comprehensive insight into the internal thermodynamic mechanism of the evaporating separation process. Both experimental and simulation studies are complementary to each other, which can thoroughly explore the thermodynamic mechanism, characteristics and influencing factors of the ACES cycle coupled with the process-heat-supplied. The core design of the ACES cycle coupled with the process-heat-supplied, specific experimental methods and thermodynamic simulation methods are given below, respectively.
Concept of process-heat-supplied and design of the unit
In traditional ACES technology, the evaporation of water from brine is typically accomplished through the thermodynamic method depicted in Fig. 1a. Since the phase transformation of evaporation requires the dissipation of latent heat, the hot air gradually drops in temperature as the process continues, while the evaporated water vapor continues to enter the air resulting in a gradual increase in the humidity of the hot air. The decrease of air temperature and humidity leads to the continuous decay of heat transfer driving potential (temperature difference) and mass transfer driving potential (water vapor partial pressure difference), which ultimately brings the heat or mass transfer to its limit and prevents further evaporation and separation. Therefore, to achieve complete evaporation of water from the brine and achieve complete separation of water and salt, this traditional technology suffers from the presence of a minimum necessary air temperature (Ta,limit) to ensure that evaporation is completed before the limitation of heat and mass transfer is reached. Ta,limit can also be obtained by solving for the thermodynamic limit of the process specific graphical illustration of the method given in Supplementary Information Fig. 1. As an example, the minimum necessary air temperature Ta,limit at the thermodynamic theoretical limit for a case in typical engineering applications with a fraction of droplet-ladens in the two-phase flow of 2.5%, an air inlet humidity of 10 g/kg dry air, and a brine concentration of 5 wt% is 90.11 °C. The presence of Ta,limit implies that in traditional processes there is always a minimum lower limiting air temperature when the inlet condition is determined. Whilst it is possible to reduce Ta,limit somewhat in engineering applications by adjusting the inlet condition parameters, such as reducing the inlet air humidity, lowering the operating pressure, this does not fundamentally (thermodynamically) remove this limitation. For example, with all other conditions of the above working conditions kept the same, and the working pressure reduced to 0.5 times atmospheric pressure, the Ta,limit is 77.56 °C, which is still maintained at a high value and at the cost of additional energy for vacuuming. Meanwhile, excessively high necessary air temperatures make such traditional technology less compatible with clean energy sources, and these system installations have to be powered by more polluting traditional fossil energy sources. Therefore, this excessive necessary air temperature is the key point.
 cycle")
a Diagrammatic illustration of the thermodynamic process of evaporation by heat mass transfer between droplets and air in traditional technology; b Diagrammatic illustration of the thermodynamic process of evaporation by heat mass transfer between droplets and air under novel process-heat-supplied; c Design diagram of the evaporating separation unit with process-heat-supplied; d Design diagram of experimental system of the evaporating separation unit with process-heat-supplied coupled ACES cycle; e Photographs of the ultrasonic brine nebulizer; f Photograph of the evaporating separation unit with process-heat-supplied; g Photograph of the experimental system).
According to the comprehensive findings from the large amount of previous investigations accumulated by our team, the above-mentioned key problem is needed to be tackled by starting from the thermodynamic process of the brine evaporation. In this paper, a novel evaporating separation thermodynamic process using process-heat-supplied is proposed to overcome the above problem, as demonstrated in Fig. 1b. Different from the traditional thermodynamic process, this novel process eliminates the need to preheat the air, rather, it directly supplies the heat demanded for heat and mass transfer during the flow process of air and droplets, and maintains a relatively stable driving potential for heat and mass transfer. In this manner, the latent heat captured by evaporation in the novel process and the heat required to increase the moisture holding capacity of the air are both supplemented by this sufficiently adequate process-heat-supplied. Thus, throughout the novel evaporation process based on process-heat-supplied there is no problem with the air temperature decreasing which would result in a decrease in its ability to hold moisture, nor is there a problem with heat or mass transfer reaching its limits prematurely. Meanwhile, this novel evaporation process also avoids the problem of the minimum necessary air temperature (Generally greater than 90 °C under typical operating conditions), which effectively reduces the heat supply temperature for brine evaporation. From the thermodynamic limitation (as illustrated in Supplementary information Fig. 1b), the heat supply temperature of this innovative process only requires to be slightly higher than the outlet air temperature (generally 35~60 °C) as long as the supply heat (Qsupply) is sufficient. Therefore, this new evaporation separation thermodynamic process using process-heat-supplied is as well more adapted to the working temperature of clean energy sources such as solar energy.
Concretely, the evaporating separation unit with process-heat-supplied is constructed as described in Fig. 1c. A sufficient number of flow pipes have been designed to ensure that the process-heat-supplied is always sufficient throughout the whole evaporating separation process. In addition, in order to verify the practical effect of this novel thermodynamic process, an experimental system has been designed as illustrated in Fig. 1d. It is briefly explained here that in order to improve the specific surface area of the droplets in the evaporating separation process which promotes heat and mass transfer, an ultrasonic brine nebulizer is incorporated in this system. Due to the small particle size of the droplets, the low-speed air can easily wrap these droplets and form a stable mixed two-phase flow together into the evaporating separation unit with process-heat-supplied. The object diagrams of the ultrasonic brine nebulizer and the evaporating separation unit with process-heat-supplied are presented in Fig. 1e and 1f. Based on the above design, our team members accomplished to build the experimental brine separation system using evaporating separation thermodynamic process with process-heat-supplied (as shown in Fig. 1g) and implemented the complete evaporation and separation of brine within the water supply temperature of 45~64 °C. Furthermore, the stable and effective operation of this system is illustrated in the video attached in Supplementary Video 1.
Experimental method
This paper is concerned with the performance experiments of the evaporating separation unit with process-heat-supplied. The experimental system illustrated in Fig. 1g can be constructed by combining the system design in Fig. 1d on the basis of the unit designed in Fig. 1c. The parameters of the main equipment and measuring instruments in the experimental system are indicated in Table 2. Control variable methods are mainly implemented in the experiment to test the basic performance of this unit with different influencing factors. The specific process is as follows:
-
(a)
Turn on all instruments; after stabilization, turn on the Q-ton CO2 heat pump water heater, brine pump and ultrasonic brine nebulizer in turn; adjust the mechanical float switch to the initial value and then turn on the fan.
-
(b)
Adjust the air valve and solution valve to the specified working condition, then set the supply voltage of the ultrasonic brine nebulizer; finally, adjust the water supply temperature of the Q-ton CO2 Heat Pump Water Heater, then waiting for the experimental system to reach a stable condition (according to the actual experiment, it takes about 1 h for the initial start-up, and about 40 min for the intermediate groups).
-
(c)
After the system is stabilized, the measured parameters such as air speed, brine temperature, air temperature and humidity are recorded, where the data are recorded every 2 min and repeated 3 times. After the completion of the record into the next set of conditions and repeat the steps (b), (c), until all the tests are completed.
-
(d)
Sequentially turn off the Q-ton CO2 heat pump water heater, brine pump, ultrasonic brine nebulizer and blower; turn off all instruments and complete powder collection and platform cleaning.
Table 2 Types and parameters of equipment components and measuring instruments
The above experimental process combined with the organization of the experiment setup conditions in Supplementary Information Table 2 allows for the completion of the performance experiments of the evaporating separation unit with process-heat-supplied. All the experimental data collection tables can be obtained in the Supplementary Experimental Measurement Data. Necessary experimental error analysis is also undertaken to ensure the accuracy of the experiment, and the uncertainty analysis method in the literature33,34 is primarily implemented in this work. Detailed experimental data processing and experimental error analysis can be referred to the Supplementary Information.
Simulation method
Implementation of a complete process thermodynamic simulation can effectively capture the distribution and variation of key parameters within the entire novel evaporating separation unit. In this paper, the method of microneutralization is applied to establish the thermodynamic balance model (kinematic balance, thermal balance and mass balance) between the process-heat-supplied wall, air and droplets within each micro-erization. The graphical illustration of the simulation model is depicted in Fig. 2a. Each control body is simulated by the thermodynamic process model to obtain the parameters of the inlet and outlet boundary conditions of all the microneutralization control bodies, thus obtaining the complete distribution of temperature, humidity and other important parameters inside the whole unit.

a Graphical illustration of the method for the microneutralization of this novel evaporating separation process with process-heat-supplied; b Diagrammatic illustration of the heating mechanism for process-heat-supplied; c Variation of temperature at each position along the height of the unit under typical operating condition; d Variation of Biot number and Peclet number along the height of the unit under typical operating condition; e Diagram of ultrasonic nebulizer droplet diameter distribution; f Variation of droplet diameter and fraction of droplet-ladens along the height of the unit under typical operating condition; g Comparative validation of simulation and experiment (air outlet temperature); h Comparative validation of simulation and experiment (air outlet humidity); i Comparative validation of simulation and experiment (evaporation rate)).
What matters to highlight in the simulation methodology is that, as illustrated in Fig. 2a, every channel of the process-heat-supplied is identical and there is no difference in the micro-erization control bodies at the same heights of this unit. However, along the flow direction, it is indeed different, especially for the droplets. Along the flow direction, as the evaporation and separation under the process-heat-supplied proceeds, the droplets in the two-phase flow go through the three stages of liquid-phase evaporation, droplet drying and drying completion, all of which are different. There are differences in the modelling of heat and mass transfer in these three stages. In the liquid-phase evaporation stage, the moisture in the droplets can evaporate directly from the contact surface between the air and the droplets, which results in larger heat and mass transfer coefficients. When entering the droplet drying stage, heat and mass transfer is impeded by the presence of a solid salt crust on the droplet surface. When entering the drying completion stage, heat transfer continues but mass transfer is no longer performed.
Therefore, the thermodynamic model for evaporating separation with process heat supply can be divided into three modules according to the state of droplets, which are liquid-phase evaporation, droplet drying and drying completion. all three modules contain three subcomponents, namely, momentum exchange model, mass transfer model, and heat transfer model. They are listed below in sequence:
Module of liquid-phase evaporation
Kinetic equilibrium equations for the droplet can be expressed as:
In which mad and uad denote the droplet mass (kg) and velocity of the droplet (m/s), respectively, as well as τ is the micron time (s). The right-hand side of this equation contains all the forces35 that the droplet is subjected to during the mixing and flow with air. They can be expressed as respectively:
Buoyancy force exerted by droplets in air FB.
Gravity of the droplet FG:
Added mass force of the droplet36 FM:
Viscous drag force between the droplet and air37 FD:
Basset force of the droplet38 FBasset:
In the above equation, dad and ρad denote the droplet diameter (m) and droplet density (kg/m3), respectively, while ua and ρa are the air flow velocity (m/s) and air density(kg/m3). g is the acceleration of gravity 9.81 m/s2. In addition, CD signifies the drag coefficient, which is related to the Reynolds number Read under the relative motion of the droplets and the air, which can be specifically expressed as39:
Above, μa,ad denotes the air viscosity (kg/m·s). For different micro-elementary control bodies, the droplet flow velocity is variable, and the micro-elementary time also varies from one control body to another. According to Fig. 2a, each micro-element control body is equipartitioned, thus the velocity of the droplet can be indicated as:
H is the total effective height of this unit.
The equilibrium relationship inside each microelement control body and the mass transfer equation of the droplet can be expressed as Eqs. (10) and (11), respectively.
Thereinto, mw,i and mw,i+1 stand for the total mass flow of inlet and outlet droplets of the control body (kg/s), respectively, whereas nad is the number of droplets entering the control body per unit of time(s−1). md is the dry air mass flow rate (kg/s), while wa,i and wa,i+1 are the air humidity (kg/kg dry air) at the inlet and outlet of the control body, respectively. ρa,ad denotes the air density in the equivalent state of the droplet (kg/m3), while βl provides the mass transfer coefficient for liquid-phase droplet evaporation (m/s). Ya and Yad, meanwhile, represent the water vapor concentration in the air and the equivalent water vapor concentration on the surface of the droplet, respectively (Yad–Ya) is the direct driving potential for mass-transfer evaporation, which acts similarly to the temperature difference for heat transfer). Ya and Yad can be obtained from Eq. (12–14)40:
Where wa is the humidity of the air in the control body, and wad is the humidity corresponding to the water vapor partial pressure (Pad (kPa)) at the surface of the droplet, which can be obtained from Eq. (14)41.
The evaporation mass transfer coefficient of the liquid phase βl, can be formulated as a dimensionless Sherwood number Shad42 in conjunction with its correlation equation:
In the above equation BM is the mass Spalding transfer number43, Dad is the mass diffusion coefficient (m2/s) corresponding to the contact surface between the liquid phase of the droplet and the air44, and Scad is the Schmidt number43. They can be individually stated as:
μa,ad denotes the air viscosity in the equivalent state of the droplet (kg/m·s). Additionally, the evaporation mass transfer of droplets leads to a decrease in droplet diameter, and the relationship between the mass transfer evaporation and the change in droplet diameter is as follows:
Where, dad,i and dad,i+1 are the droplet diameter (m) at the inlet and outlet of the control body, respectively.
Both the mass transfer model and the momentum exchange model are derived from the traditional model of the evaporation process of air and droplets, with the differences originating only from the specifics of the novel process, with little change in the mass and momentum balance equations. However, the heat transfer model is significantly different. The inclusion of process-heat-supplied complicates the heat transfer equations and the process thermal equilibrium equations, which need to be synthesized in a series of expressions as follows.
Total thermal equilibrium equations in the micro-erization control body:
In the equation ha,i and ha,i+1 respectively indicate the enthalpy of the air at the inlet and outlet of the control body. Qsupply is the heat supplied by the wall of process-heat-supplied (kW), and Qad is the heat of the droplets in the control body (kW).
Qsupply is the convective heat transfer between the wall and the two-phase flow, while Qad is the heat transfer between the air and the droplets. They can be represented by two sets of heat transfer equations respectively. Qsupply can be denoted as:
Above, Ta, Tsupply,water, Twall,in and Twall,out (°C) denote the air temperature in the control body, the supply temperature of the process heat, the inner wall temperature (on the side in contact with the two-phase flow) and the outer wall temperature (on the side in contact with the supplied hot water), respectively. msupply,water (kg/s) and Cpwater (kJ/kg·°C) represent the mass flow rate and specific heat capacity of the hot water supply. dpipe, in, and dpipe, out then represent the inner and outer diameters (m) of the individual process heat supply channel, respectively. npipe is the number of channels, which is equal to 91 according to the actual design, and n is the number of micro-erization control body. λwall is the thermal conductivity of the channel wall (W/m·°C), which is equal to the thermal conductivity of the copper pipe since copper pipe is used in this paper. αwall,in and αwall,out are the convective heat transfer coefficients on both sides of the wall (kW/m2·°C), which can be presented by their respective Nusselt numbers (Nu) and correlations45,46, as follows:
Among them, λa and Cpa are the thermal conductivity of air (W/m·°C) and the specific heat capacity of air (kJ/kg·°C). μwall,in is the air viscosity corresponding to the temperature of the inner wall surface (kg/m·s). And αwall,out can be denoted as:
In the above Eqs. (40) to (43), λsupply, Cpsupply, μsupply, ρsupply and usupply denote the thermal conductivity (W/m·°C), specific heat capacity (kJ/kg·°C), viscosity (kg/m·s), density (kg/m3) and flow velocity (m/s) of the supplied hot water, respectively. dout is the characteristic length of the hot water side of the process-heat-supplied. Here it is not equal to the outer diameter of the pipe since the outside of the channel is a longitudinally flowing pipe train. dunit is the barrel diameter of this process-heat-supplied unit, which according to the design value is 0.325 m.
Equation (23)–(34) are computational models of heat transfer for Qsupply, which describe how the process heat supply is delivered to the two-phase flow. It is necessary next to inspect the heat transfer from the droplets to the air, Qad:
In the above equation, it should be noted that since the droplets are continuously evaporating, a portion of the droplets’ own energy goes into the air (nad·had·(dmad/dτ)in the equation represents this portion of the energy). Therefore, the effect of this part needs to be considered and subtracted. tad and had represent the average temperature (°C) and enthalpy of the droplets (kJ/kg) in the control body. αl is then the convective heat transfer coefficient when the droplet is in the liquid phase evaporation process (kW/m2· °C), which can be denoted as the following series of correlations47,48:
Nuad is the Nusselt number for droplet evaporation and BT is the heat Spalding transfer number.
Equations (1) to (38) can be interpreted to solve the state conditions of the process heat-supplied-wall, air and droplets in the control body when the droplets are in the liquid-phase (that is, before the droplet concentration reaches the saturated concentration).
Module of droplet drying
As the droplets enter the drying stage, solid crystalline salts begin to precipitate from the surface of the droplets and form a shell that encapsulates the droplets. For the momentum exchange model, there is no change except that the droplet itself requires physical property parameters to be recalled according to the drying process. Therefore, the model Eqs. (1) to (9) can still be applied here.
The most straightforward difference between the drying stage and the previous liquid phase evaporation stage is the difference in the droplet mass transfer process. In the drying stage, the surface of the droplet is encapsulated by a solid crystalline shell, which blocks the evaporation of the saturated solution inside the shell. Therefore, the mass transfer coefficients in the mass transfer equation here are replaced by the mass transfer coefficients βs (m/s) in the drying stage, and the correlation between the mass transfer equation and the mass transfer coefficients43 is as follows:
In Eq. (40), dad2/(2Dad)(cdot)(1/dad,wet-1/dad) indicates that the evaporation of a wet core droplet is impeded by the mass transfer from the external salt shell, and dad,wet is the diameter of the wet core within the droplet. Therefore, it is clear that βs is to be lower than βl. In addition, since the mass equilibrium equation, which does not involve variations in specific droplets, only contains the case of the amount of water vapor transferred, Eq. (10) and its related other equations can be applied in this part.
Similar to the difference in the mass transfer model, the heat transfer coefficient αs (kW/m2· °C) in the heat transfer equation under the drying phase is also subject to variations due to the limitation of the solid shell. The heat transfer equation and heat transfer coefficient for this stage are solved as follows48:
Droplet heat transfer coefficient αs is similarly decreased, yet the total heat transfer equation and the process-heat-supplied equation are still applicable at this stage, namely, Equations (21) to (34).
Module of drying completion
When all the moisture inside the droplet is completely evaporated, the micro element control body then enters the drying completion stage. At this stage, the drying stage the mass of the droplets no longer varies, which means that the mass transfer stops, namely, the mass transfer equation is satisfied:
Although mass transfer no longer occurs the momentum and heat exchange between the droplets, the air and the wall still exist. Therefore, the Momentum Eq. (1) and the Heat Equilibrium Equation (21) and other models related to both can still be adapted to this stage.
By integrating the above models, the whole process can be simulated by using the logic language. All of the above mathematical model are coded in the EES-8.4 Software to create the different sub-module programs. The complete logic diagram of the simulation calculation can be illustrated by referring to the following Supplementary Information Fig. 2. Complete process thermodynamic model code source file can be found in the Supplementary Code 2 — Simulation Model Code of the Unit.
Special attention needs to be paid to the fact that after these thermodynamic mathematical modules is presented, it is essential to verify that the three key issues involved in this thermodynamic process are reliable. These three issues can be a direct reflection of the similarities and differences between the process-heat-supplied and conventional methods. They are specified below:
Heat transfer mechanisms for heating
The conventional process normally enters the hot air into the evaporation unit, which provides energy for the evaporation and separation of the droplets by utilizing the thermal energy of the hot air itself. Accordingly, the heat transfer of the conventional process only considers the convective heat transfer between the droplets and the hot air, and the heat before reaching the droplets only involves the convective thermal resistance between the air and the droplets. The process with process-heat-supplied is significantly different, as shown in Fig. 2b, where the supply hot water transfers heat through the channel walls to the air inside the channel, which finally transfers the heat to the droplets by convective heat transfer. Thus, holistically, the heat transfer thermal resistance of the process heat feed contains four components, which are: Thermal resistance of convection outside the channel, Thermal resistance of wall thermal conductivity, Thermal resistance of convection inside the channel, Thermal resistance of convective heat transfer between air and droplets. The whole process of the formation of the five temperatures also be presented as shown in Fig. 2b: Tsupply water > Twall, out > Twall, in > Ta > Tad. In addition, the channel wall surface temperature Twall, in cannot be kept constant.
Certainly, in the unit designed in Fig. 2a, since the convective heat transfer coefficient of the supply hot water outside the channel (about 180~220 W/m2· °C) is much larger than the convective heat transfer coefficient between the air inside the channel and the wall surface (about 4 ~ 6 W/m2· °C), and the channel is a copper pipe with excellent thermal conductivity, the outer convective thermal resistance of supply hot water the and conductive thermal of the wall is quite small. Therefore, as indicated in Fig. 2c, the inner wall surface temperature Twall,in, is remarkably close to the steady supply hot water Tsupply,water (at the maximum situation in this figure, Twall,in is only about 0.7 °C lower than Tsupply,water). The process-heat-supplied approaching constant wall surface temperature heating witnessed in the Results and Discussion section is also caused by the extreme proximity of these two temperatures. In addition, from Fig. 2c it is also noticeable that Tsupply, water also remains almost invariable, benefitting from the huge thermostatic water tank (1 ton) and the water flow rate which is much larger than the air flow rate (air flow rate of 12.41 m3/h in Fig. 2c, while the supply water flow rate of 19,000m3/h).
From the above heat transfer mechanism, it can be found that radiative heat transfer is not contemplated in the heat transfer process of the process-heat-supplied designed in this paper. Although the radiative heat transfer can often be neglected at conventional temperatures, it is worthwhile to examine the radiative heat transfer for the rigidity considerations. From the heat transfer mechanism shown in Fig. 2b, it can be seen that the radiative heat transfer is mainly concentrated between the inner wall surface of the channel and the droplets. The form of this radiative heat transfer is typical of internal thermal radiation in closed cavities39, and the radiative heat transfer Qra can be described by the following mathematical model:
where Aad and Awall,in (m2) denote the total area of the droplets and the total area of the wall, respectively. εad and εwall represent the emissivity of the droplets and the emissivity of the wall, based on the literature3 data εad = 0.25, εwall = 0.6. σ is the radiation constant, taken as 5.67 × 10⁻⁸ (W/m2·K4). In order to make a standardized comparison with the convective heat transfer coefficient, it is necessary to examine the radiative heat transfer coefficient γ, which is consistent with the convective heat transfer coefficient and can be expressed as:
The comparison between radiative heat transfer and convective heat transfer under several typical working conditions is illustrated in Table 3. As can be found from the table, the radiative heat transfer compared to the total convective heat transfer to the process heat, its share of the maximum is only 0.531%, the radiative heat transfer coefficient is also much smaller than the convective heat transfer coefficient. Consequently, the effect of radiative heat transfer is negligible, and the heat transfer mechanism described in Fig. 2 allows the effect of radiative heat transfer to be ignored.
Heat transfer and mass transfer mechanisms for evaporation of the droplets
In this paper, the macro-state variation of brine droplets and air during the thermal process under the action of process-heat-supplied is investigated. Therefore, the most common lumped capacitance method is adopted to deal with the heat and mass transfer between droplets and air. From Fig. 2a, it can be observed that the evaporation mass transfer of the droplets is driven by the heat transfer between droplets and air, thus it is initially necessary to determine whether the heat transfer conditions are in accordance with the requirements of lumped capacitance method. The Biot number (Bi) can be applied to determine whether this situation is applicable:
The lc (m) in the above equation denotes the characteristic length, which can be expressed as the form in Eq. (48) because the droplet particle size is so small in this paper that it can be approximated as a sphere. λad (W/m·°C) denotes the thermal conductivity of the droplet. According to the literature49, when Bi is less than 0.033, the difference between the maximum and minimum excess temperatures in the droplets becomes less than 5%, at which point it is feasible to adopt the concentrated parameter method. In Fig. 2d, the variation of Bi in the motion direction of the droplets can be seen for typical working condition (Tsupply, water = 45.43 °C cin = 10 wt%). As the thermal process proceeds, Bi decreases gradually and is much less than 0.033 throughout the whole process, hence, the lumped capacitance method is reliable from the heat transfer point of view.
In addition, from the mass transfer point of view, the Fickian diffusion inside the droplet can only be neglected and the concentration parameter method can only be applied if the concentration gradient inside the droplet is quite small. Smaller concentration gradients usually occur when the droplet particle size is small or the Peclet number (Pe) is much less than 150. The ultrasonic atomization used in this paper has an average particle size of around 20 µm, which satisfies the former. While Pe changes continuously with the change of droplet state, it is necessary to examine the change of Pe in the same way as Bi. Pe can be expressed as51:
Read and Scad are the Reynolds and Schmidt numbers of the droplet, respectively. Similarly, by calculating the Pe of droplets of all the microelements, as illustrated in Fig. 2d, except for a small portion of the droplets at the inlet end where the Pe reaches 0.19 (inlet effect), the subsequent Pe is less than 0.02, and the overall is not more than 1. This implies that the concentration gradient within the vast majority of the droplets during the process is very small, and therefore the Fickian diffusion in the droplets is negligible. The accounting for other operating conditions also satisfies the conditions of Bi < 0.033, Pe < <1.
By the above demonstration it can be assumed that the lumped capacitance method for droplets is reliable. However, it does not mean that all parameters can always be seen as average values during the whole process of droplets. After the concentration on the surface of the droplet reaches saturation, the surface of the droplet takes the lead in precipitating solids, which can still be regarded as spherical in the drying stage of the precipitated solids due to the small Pe and the regular outer tube of the solids. According to the literature52, the precipitated solid shell film is not completely isolated from mass transfer with its loose pores, thus the solution inside the shell can still evaporate through the pores, only its mass transfer coefficient is reduced. In conjunction with the concentrated parameter method for droplets inside the microelement, the mass transfer problem after crusting can be dealt with simply by adopting the mass transfer coefficient correlation equation provided by ref.52. Certainly, the above treatment still presupposes that Pe < <1.
Droplet diameter and droplet fraction of two-phase flow
From the above heat and mass transfer mechanism, it can be observed that another significant factor that requires verification and presentation is the droplet parameters, of which the droplet diameter and the fraction of droplet-ladens in the two-phase flow are the most critical ones. In this paper, the method of ultrasonic atomization is adopted, which results in a smaller droplet size than that of the conventional mechanical spray atomization method53. The average particle diameter of ultrasonic atomization can be obtained mainly by statistical calculations after experimentally measuring the particle size distribution, or by applying existing correlation-based equation54:
Where fu (Hz) is the frequency of ultrasonic atomization; ρl (kg/m3) is the density of the liquid; σl (N/m) is the surface tension of the liquid. Here we compare the mean droplet diameter from the experimental tests with the correlation-based calculation. Figure 2e shows the droplet distribution of ultrasonic atomization (a detailed report on the droplet distribution can be found in Supplementary Information Figs. 3 and 4). The difference between the experimentally measured particle size and the calculated one is very small, so Equation (50) can be used in the thermodynamic simulation in this paper in order to obtain the initial average particle size of the droplets. In addition, it can be appreciated from Fig. 2e that the particle size of the ultrasonic atomization is roughly around 20 μm, which is smaller than the 30–60 μm of the mechanical sprays used in the conventional spray drying technology53, leading to a larger specific surface area of the droplets in contact with the air, which is conducive to the overall heat transfer of the process-heat-supplied.
Another important parameter fraction of droplet-ladens in the two-phase flow fad can be obtained from the ratio of the atomized mass flow rate of droplets mad (kg/s) to the air mass flow rate md (kg/s):
The fad is different due to different initial and working conditions. Under all the experimental conditions involved in this paper, the inlet fad is basically in the range of 1~3%, which is in line with the range of 0.5~5% for conventional spray drying53.
More importantly, the above two parameters are constantly changing during the thermal process of the unit, due to the continuous evaporation of the droplets. As shown in Fig. 2f, the mean droplet diameter decreases continuously and finally remains constant after reaching the dry state. fraction of droplet-ladens also decreases gradually due to the changes in droplet particle size and relative flow velocity of the two-phase flow, and finally reaches a relatively equilibrium value.
The validation of these three key issues can demonstrate that the thermodynamic model established in this paper is reliable from a theoretical viewpoint. Furthermore, a comparison between experiments and simulations have also been carried out for validating the accuracy of the simulation investigation. The boundary conditions for the thermodynamic simulation are determined by applying the experimentally measured inlet conditions and comparing the three important parameters of outlet air temperature, outlet air relative humidity and evaporation rate obtained from the simulations, respectively. The comparison results are respectively illustrated in Fig. 2g, h and i. The comparison results reveal a maximum error of 4.25% for air temperature, 10.07% for air relative humidity and 8.10% for evaporation rate. The errors of all the main parameters are basically less than ±10%, consequently this thermodynamic model developed in this paper is accurate and the analyses in the Results and discussion Section have reliability.
Results and discussion
Feasibility of process-heat-supplied coupled ACES cycle for full recovery at normal temperature
Experimental investigations on the performance of the evaporating separation unit with process-heat-supplied were carried out according to Fig. 1d, and a thermodynamic model and simulation research on the novel thermodynamic process in Fig. 1b (for details to Supplementary Information) were also conducted. From both experimental and thermodynamic simulation perspectives, the feasibility of combining the ACES cycle with process-heat-supplied is verified to achieve the full recovery of saline wastewater at normal temperatures (45~60 °C). As shown in Fig. 3a–d (as well as Supplementary Video 2), when the initial concentration of treated NaCl brine is 5 wt% and the average heat supply temperature is 45.17 °C under the experimental conditions, no liquid carryover can be observed in the fumes at the outlet, the collected salt particles are sufficiently desiccated, and dry salt powder can be collected stably in the bag filter. This implies that this designed process-heat-supplied coupled ACES cycle can easily achieve the complete separation and recovery of saline wastewater at normal temperature.

a Photograph of the drying salt fumes at the outlet observed during the experiments; b Photograph of tiny salt particles captured with a backing plate at the outlet during the experiments; c Salt powder deposited at outlet pipe bends; d: Salt powder collected in bag filter; e Variation of droplet concentration inside the unit for different heat supply temperatures; f: Variation of droplet local mass flow rate inside the unit for different heat supply temperatures).
Moreover, the thermodynamic simulation results also revealed similarly. As illustrated in Figs. 3e and 2f, under the three experimental conditions of supplying temperatures of 40.17 °C, 50.93 °C and 55.37 °C, the concentration of the droplets reaches 100% (that is, completely dry) before reaching the outlet of the evaporating separation unit, while the average mass flow rate of the droplets also reduces to the minimum value and remains constant. In other words, under these three conditions, the water in the droplets has been completely evaporated in the unit, and the brine droplets have also achieved complete separation of water and salt at 45~60°C. The results of the thermal simulation also demonstrated that as the supply temperature increases, the position at which the droplets accomplish complete separation is earlier, for example, at an average supply temperature of 55.37 °C, the droplets can achieve complete evaporation at about 0.53 m of the effective working height of the tower. Additionally, as depicted in Fig. 3e, it is also found in the simulation that there is an inconspicuous but critical inflection point in the subsequent analysis for all the conditions that complete drying, and this inflection point is due to the variation of the droplet stage, which is analyzed detailly in next section.
Thermodynamic analysis of the evaporating separation process with process heat supply
It has been found in feasibility analysis that the brine evaporation and separation inside the evaporating separation unit with process-heat-supplied is remarkably different from that under the traditional methods. This is due to the fact that the action of the process-heat-supplied changes the heat and mass transfer inside the evaporating separation thermal process, whilst the evaporating separation stage of the droplets also experiences several changes. With experimentally measured inlet and outlet state parameters as validation and reliable process thermodynamic simulation results, it is possible to investigate the changes of brine droplets in this unique process. The temperature difference that affects the heat transfer of the evaporation process is firstly considered. Figure 4a–c demonstrate the variation of air temperature and droplet temperature along the effective evaporation height of the evaporating separation unit under the three experimental conditions of supply temperatures of 40.17 °C, 50.93 °C and 55.37 °C, respectively. In this novel evaporation process under process-heat-supplied, the droplets and air no longer rely on carrying their own heat, and the heat consumed in the evaporation process is supplied by the process-heat-supplied. Therefore, under all three conditions, the droplet temperature and air temperature tended to increase gradually after the short inlet effect (that is, the pre-adjustment stage of the droplets). However, it is worth noting that the specific variations of the three working conditions are not identical, which is due to the different evaporation and separation stages of droplets. Specifically, the thermodynamic process of brine evaporation and separation under the action of process heat supply can be divided into four stages: Stage of temperature and humidity adjustment for droplets, Stage of stable evaporation for droplets, Stage of droplets drying, and Drying completion stage. The stage of temperature and humidity adjustment for droplets mainly originates from the imbalance between the inlet droplet temperature and the air temperature, and the imbalance between the partial pressure of water vapor on the droplet surface and the partial pressure of water vapor in the air. In this stage, the droplet temperature and air temperature appear to cross several occasions, and finally reach the equilibrium of the temperature difference and partial pressure difference, then enter the stable evaporation stage of the droplet. In the stage of stable evaporation, since the latent heat consumed by evaporation has already been provided by the process-heat-supplied, the droplet temperature and the air temperature only require a minor temperature difference to realize the heat transfer requirements of the process. Here, the droplet temperature becomes slightly higher than the air temperature owing to the fact that the direction of mass transfer is from droplet to air. As the evaporation continues and the droplet concentration gradually increases, the droplets attain saturation (Fig. 4b–c) and precipitate solid salt shells on the surface of the droplets. Currently, the process enters the stage of droplet drying, due to the shell formation, the mass transfer rate of the evaporation process decreases, and the heat transfer is also limited, thus the temperature rise of the droplets is slowed down in this stage. Here in Fig. 4a, since the droplets still have not reached saturation when reaching the tower outlet, the two subsequent stages do not exist. Eventually, when the water in droplets is completely evaporated, the droplets drying completes. At this stage, the process-heat-supplied effect no longer supplies latent heat for evaporation, and the air and powder temperatures begin to accelerate the warming, and the air temperature becomes higher than the powder temperature due to the much lower specific heat of air (in Fig. 4b–c).
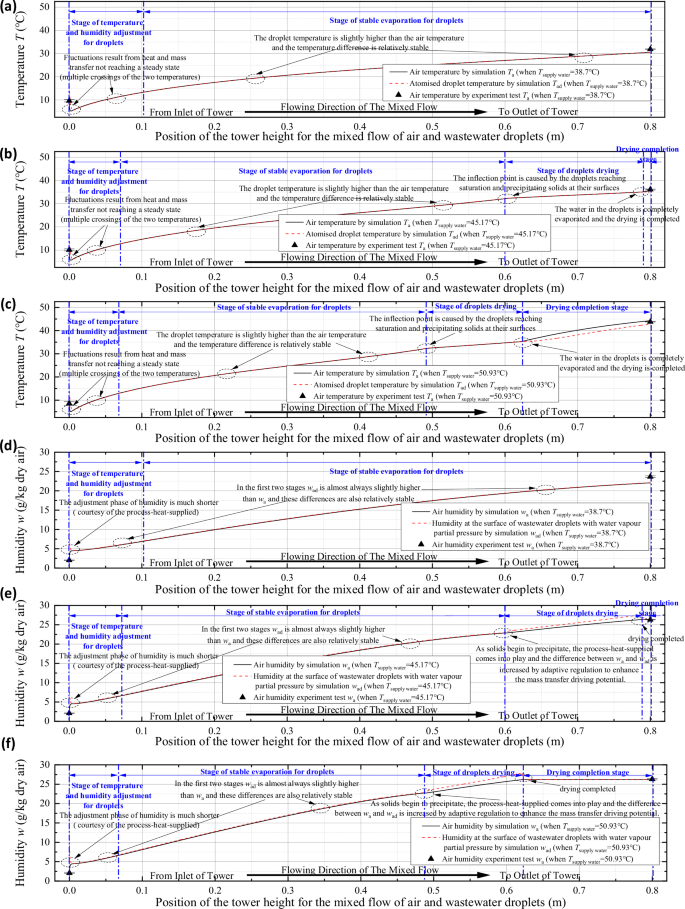
a Temperature variations (Tsupply = 38.7 °C); b Temperature variations (Tsupply = 45.17 °C); c: Temperature variations (Tsupply = 50.93 °C); d Humidity variations (Tsupply = 38.7 °C); e Humidity variations (Tsupply = 45.17 °C); f Humidity variations (Tsupply = 50.93 °C)).
The humidity variations reflect the mass-transfer evaporation, which is more intuitive to capture the impact of this novel thermodynamic process. The variation of the humidity corresponding to the partial pressure of water vapor on the surface of the droplet with respect to the air humidity is then indicated in Fig. 4d–f. In the droplet temperature and humidity adjustment stage and the stable evaporation stage of the droplet, the humidity corresponding to the partial pressure of water vapor on the surface of the droplet and the air humidity varies in a similar way as the temperature varies. Since the mass transfer coefficients of the droplets are relatively large in these two stages, the process heat transfer can be easily transferred to the whole heat and mass transfer. When entering the stage of droplet drying, the shell on the droplet surface hinders the mass transfer, and the mass transfer coefficient decreases rapidly, at which moment the positive effect of the process-heat-supplied emerges as well. As indicated in Fig. 4e, f, in the stage of droplet drying, wad rises rapidly and maintains a high gap with wa. This phenomenon is exactly from the feedback effect of process-heat-supplied. As the process-heat-supplied can provide enough thermal energy, when the mass transfer coefficient decreases rapidly, the mass transfer rate in this stage does not inevitably decrease as in traditional processes. The process-heat-supplied can compensate for the decrease in mass transfer rate by increasing the surface water vapor partial pressure of the droplets, which is to mitigate the decrease in mass transfer rate by increasing the mass transfer driving potential (water vapor partial pressure difference). This utilization of sufficient energy supply to achieve self-regulating mass transfer driving potential between droplets and air also directly explains why process-heat-supplied enables the complete separation of droplets at supply temperatures of only about 45 °C. In fact, from perspective of the underlying thermodynamic model, there is no limit to the heat and mass transfer in the evaporating separation process under process-heat-supplied. Because the supplied heat (total heat flux) is always sufficient, whether it is the latent heat of evaporation or the heating up of working fluids, when the heat or mass transfer coefficients decrease, it inevitably leads to the increase of the heat or mass transfer driving potential in order to maintain a steady and sufficient heat flux. Finally, when entering the drying completion stage, the evaporation is over and therefore the droplet and air humidity no longer variable.
Mechanism effect of evaporating separation processes facilitated by process-heat-supplied
In the above section, the analysis from the perspective of the thermodynamic process has been conducted and an essential conclusion has been found that the process-heat-supplied effect can overcome the decrease in the mass transfer rate by self-regulating the mass transfer driving potential when the mass transfer coefficient between droplet and air decreases. This important conclusion can be validated again in the thermodynamic mechanism analysis based on the local evaporation rate, as indicated in Fig. 5a–c. Actually, this phenomenon is caused by a combined effect of the temperature and humidity imbalance at the inlet of the unit and the gradual commencement of the process-heat-supplied. At the unit inlet, the temperature and humidity differences are large owing to extremely dry air. At this time, the tremendous heat and mass transfer driving potential between the droplets and the air plays a dominant role in the evaporation of the droplets, with large initial evaporation rate of the droplets. However, since droplets and air carry only little thermal energy, droplets and air rapidly cool down due to the great latent heat of evaporation in a remarkably short stroke, while the humidity difference also decreases rapidly. Therefore, in the preliminary portion of the stage of temperature and humidity regulation for droplets in Fig. 4a–c, the local evaporation rate decreases rapidly. However, it is encouraging to note that as the process unfolds further, the positive effects of the process-heat-supplied begin to come to the fore. The local evaporation rate gradually rebounds by replenishing the latent heat of evaporation through the process-heat-supplied, supplemented by self-adaptive regulation of the droplet temperature and the air temperature. At the end of this stage, a stable configuration of heat and mass transfer driving potentials can be reached and the process enters a stable evaporation stage.
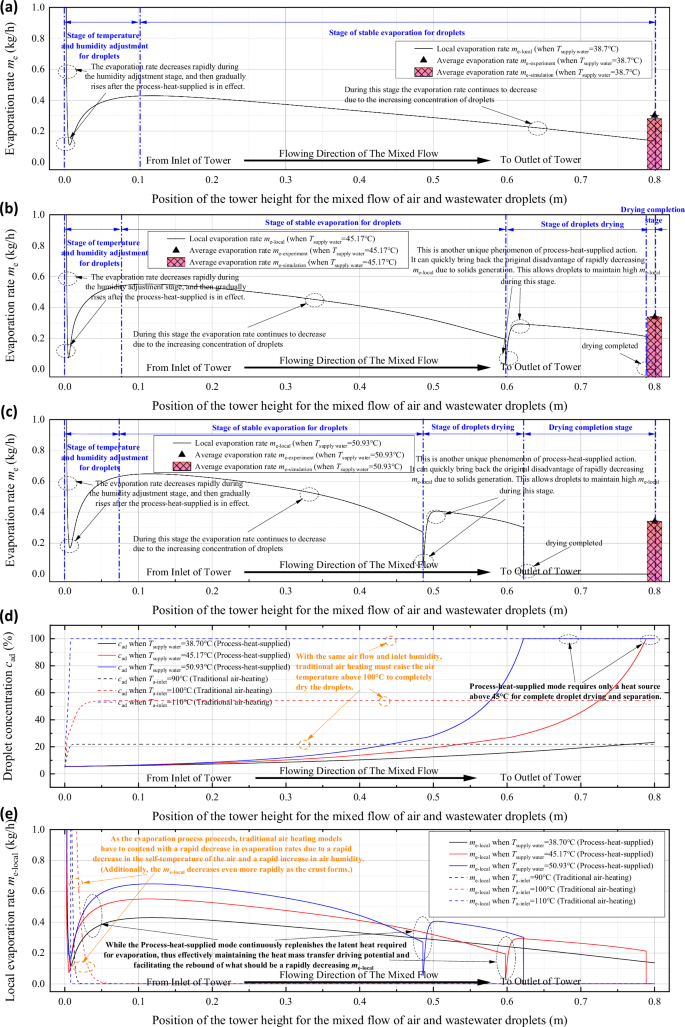
a Variation of local evaporation rate along the height of the unit under the action of process-heat-supplied (Tsupply = 38.7 °C); b Variation of local evaporation rate along the height of the unit under the action of process-heat-supplied (Tsupply = 45.17 °C); c Variation of local evaporation rate along the height of the unit under the action of process-heat-supplied (Tsupply = 50.93°C); d Comparison of the internal evaporation process in the unit with process-heat-supplied and the traditional process (comparison of changes in droplet concentration); e Comparison of the internal evaporation process in the unit with process-heat-supplied and the traditional process (comparison of changes in local evaporation rate)).
As the stable evaporation continues, the droplet concentration gradually increases, and the evaporation rate also decreases slowly as a result. When the droplet reaches saturation concentration, the process enters the stage of droplet drying. Solid crystalline salts will be precipitated on the surface of the droplets and form encapsulated shells, resulting in a rapid decrease in the mass transfer coefficient and a rapid decrease in the evaporation rate. At this moment, the contribution of the process-heat-supplied becomes prominent again. Due to the stable heat flux supply, the droplets and air become self-adaptively regulated again and enter into another set of stable heat and mass transfer driving potentials (which is numerically greater than the stable evaporation stage). The local evaporation rate thus rises up again, even slightly above the local evaporation rate before the saturation concentration arrived. Subsequently, the local evaporation rate decreases steadily as the solid crust gradually thickens until evaporation is finished completely. Overall, an increase in supply temperature can promote an increase in local evaporation rate, leading to a shorter distance for droplets to completely evaporate. At a supply temperature of 45.17 °C, an effective evaporation height of 0.8 m is sufficient for the droplets to achieve complete evaporating separation. The process-heat-supplied action is precisely by way of supplying a stable heat flux to induce the rapid formation of a stable heat and mass transfer driving potential between the droplets and the air within a short period, thus achieving complete evaporating separation at normal temperature (45~60 °C).
Moreover, as illustrated in Fig. 5d, under the same spray and air flow conditions, the traditional evaporating separation process with high temperature hot air carrying energy (based on the literature28) requires the air temperature to be elevated up to 110 °C to achieve the complete separation of droplets. In contrast, the evaporating separation process with process-heat-supplied requires only 45.17 °C to achieve complete evaporation, which reduces the operating temperature of the unit by nearly 65 °C. At the same inlet conditions (operating at same atmospheric pressure and with the same air inlet humidity), Despite the fact that the conventional process achieves more rapid evaporation, when the temperature of the supplied air is lowered to 100 °C, the droplets cannot evaporate completely. No matter how much the effective length of the tower is extended, evaporation cannot be completed. This can also be discovered from the comparison in Fig. 5e. The traditional process relies on the energy carried by the air itself, so when the air temperature is less than 110 °C, the local evaporation separation will also decrease rapidly after the air cools down rapidly, and eventually becomes almost 0, at which time the heat and mass transfer limit is reached, and no further evaporation separation can be completed. Nevertheless, the sufficient thermal energy provided by the process to the thermal action circumvents the problem of heat and mass transfer limit, so in this novel process, the heat and mass transfer which can be maintained at a high level is consistently ongoing until the droplets are completely evaporated. For example, the me is basically maintained above 0.2 kg/h for the case of Tsupply = 45.17 °C.
Analysis results of influencing factors
Due to the revolutionary alteration of the thermodynamic process, some variations in the influencing factors of the brine evaporation performance of the evaporating separation unit employing the process-heat-supplied have been observed. Integrating the thermodynamic simulation and the performance experiment of the unit, the novel process is mainly affected by the heat source supply temperature, the initial concentration of the brine and the atomization flow rate of the brine, as shown in Fig. 6a–f. The influence of the heat source supply temperature (Tsupply) is the most straightforward. As the Tsupply rises, the supplied thermal energy also increases, thus the outlet air temperature gradually increases and the relative humidity gradually decreases, as illustrated in Fig. 6a. The supply temperature increase also directly determines whether or not complete evaporation of brine can be achieved at the unit outlet. As shown in Fig. 6b, when the temperature reaches about 45 °C, the water in the droplets at the outlet of the unit has completely evaporated and the evaporation rate no longer varies. Certainly, Tsupply is not the higher the better, when completely evaporated, further increase in Tsupply rather cause reduction in the thermal efficiency of evaporation. Therefore, it can be controlled at just enough to completely evaporate, when a high thermal efficiency of evaporation can be maintained. For example, in Fig. 6b, when the Tsupply is 45.17 °C, the ηQ can reach 66.62%, which is much better than the 30% of the conventional spray drying.
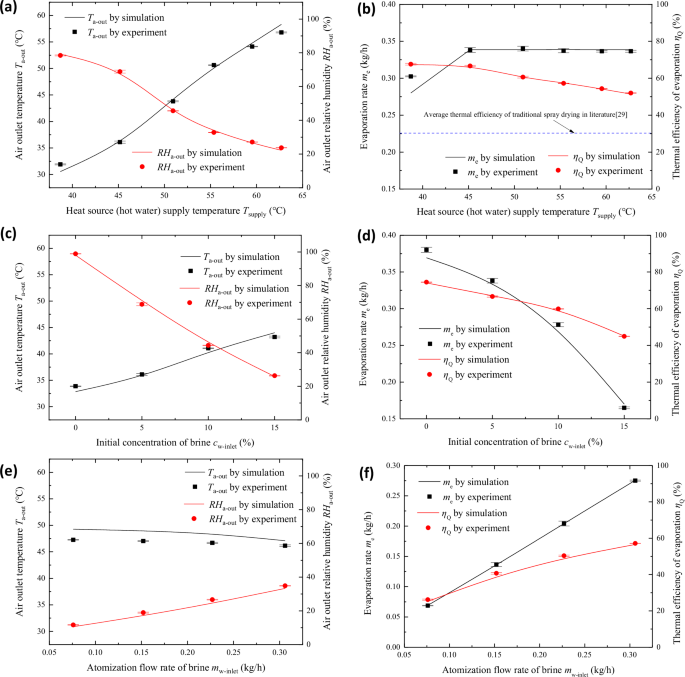
a Effect of heat source supply temperature on outlet air temperature and humidity; b Effect of heat source supply temperature on evaporation rate and thermal efficiency of evaporation; c Effect of initial concentration of brine on outlet air temperature and humidity; d Effect of initial concentration of brine on evaporation rate and thermal efficiency of evaporation; e Effect of brine atomization flow rate on outlet air temperature and humidity; f Effect of brine atomization flow rate on evaporation rate and thermal efficiency of evaporation).
In addition, the initial concentration of brine and the brine atomization flow rate also have a sub-level effect. The increase of the initial concentration of brine and the decrease of the brine atomization flow rate can lead to the decrease of the relative humidity of the air outlet and the increase of the air temperature, which limits the evaporation carrying capacity of the air, as indicated in Fig. 6c, f. The evaporation rate and the evaporation thermal efficiency of the device are also restricted as this result. Consequently, comprehensive actual processing requirements, choosing a relatively low processing concentration, as well as improving the atomization flow rate appropriately under the premise of ensuring complete drying and separation, can effectively maintain the evaporation and separation performance of the unit.
Exploration of the novel system adopting process-heat-supplied technology
In the above three sections, the feasibility of process-heat-supplied coupled air-carried evaporating separation (ACES) process, the thermodynamic mechanism of the new process, and the influencing factors are comprehensively analyzed from thermodynamic perspectives. The most prominent advantage is that a supply temperature of only about 45 °C, combined with the ACES cycle coupled process-heat-supplied, can achieve complete evaporation and separation of brine, while recovering the salt and water concomitantly. The reduction of working temperature brings not only the improvement of thermal efficiency, but more significantly reduces the difference between the brine evaporation temperature and the high humidity air condensation temperature, which directly determines whether most of the latent heat of evaporation can be effectively recovered. Conventional ACES cycles have a large temperature difference between evaporation and condensation recovery, with evaporation temperatures typically exceeding 110 °C and condensation recovery temperatures around 20 °C, which leads to traditional systems using heat pumps with low latent heat recovery efficiency. For example, between 110 °C and 20 °C, the coefficient of performance (COP) of the inverse Carnot heat pump cycle is only 4.26, and the actual cycle efficiency is even lower, frequently below 3.0, which causes the latent heat recovery efficiency of the solar heat pump as low. Even if the average photovoltaic efficiency of solar energy is taken as high as 20%, and the thermodynamical perfectness of the heat pump cycle reaches 70%, the energy recovery rate is only 55.3%. The poor recovery of evaporation latent heat is the biggest limitation of traditional solar ACES systems in achieving efficient complete brine separation. However, this problem is overcome by the ACES cycle couple process-heat-supplied with a supply temperature of only about 45 °C.
According to the above analyses, a novel solar ACES system coupled process-heat-supplied is designed as presented in Fig. 7a. This novel system extends the process-heat-supplied ACES cycle module of the experimental system in Fig. 1d, and then designs a heat pump air recovery module that recovers the latent heat from the evaporation phase and the water recovery phase of the ACES cycle. For ensuring the continuous and stable operation of the system, a solar thermo-electric storage module is lastly designed. Through the thermodynamic analysis of this unique system, it is discovered that the system can truly implement the comprehensive utilization of solar energy grades, as shown in Fig. 7b–c. If the heat pump loss is not considered (namely, the heat pump cycle is the theoretical compressed vapor cycle), the evaporation rate for unit area of solar irradiation me-solar can reach 2.23 kg/(m2·h), and the comprehensive utilization rate of solar irradiation energy ηi can reach 188%, which is far more than the existing solar brine evaporation system (including direct evaporation, interfacial evaporation and air-carried flow evaporation). Even if heat pump loss, flow resistance loss and other comprehensive factors are considered concurrently, the me-solar and ηi of this system can still reach 1.41 kg/(m2·h) and 95.2% respectively. This remarkable ηi is attributed to the fact that the heat pump is extremely efficient in converting high-grade electrical energy (from photovoltaics) into more low-grade thermal energy at low temperature differences to feed the evaporating separation process. With the addition of solar thermal storage, the system can ultimately convert one unit of collected solar energy into more than one unit of thermal energy. Consequently, the ACES cycle coupled with process-heat-supplied not only achieves the complete separation of brine at normal temperatures (45–60 °C), but also renders it possible to achieve a combined solar irradiation utilization efficiency of more than 100%. The process-heat-supplied technology also provides a reliable path for the complete settlement of “full recovery” and “high energy efficiency” of solar brine evaporation system.
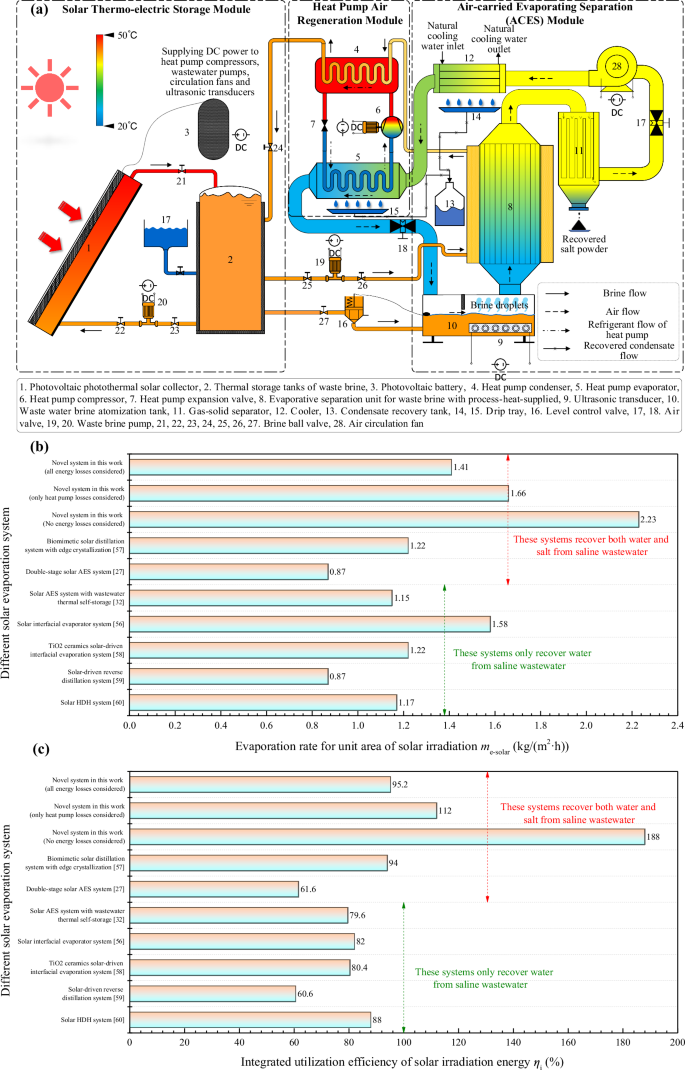
a Design of a novel solar ACES system with full recovery of brine based on the characteristics of the process-heat-supplied; b Comparison of various contemporary advanced solar brine recovery systems (Comparison of evaporation rate for unit area of solar irradiation); c Comparison of various contemporary advanced solar brine recovery systems (Comparison of integrated utilization efficiency of solar irradiated energy)).
Furthermore, the energy consumption and utilization efficiency of solar irradiation energy of this system is compared with the existing state-of-the-art various types of solar powered brine evaporation systems, as depicted in Table 4. The specific energy consumption SEC of this system is only 0.709 kWh/kg, which is lower than most of the existing state-of-the-art systems of various types, and is only higher than the membrane desalination system with vacuum technology adopted in the literature48. In addition, benefiting from the process-heat-supplied technology applied in this system to reduce the operating temperature of the system, the overall solar efficiency of the system is very high, up to 95.2%. Therefore, this system has its unique advantages even compared to the advanced systems with vacuum technology.
Certainly, even though the system operates at atmospheric pressure, the novel process-heat-supplied technology employed is not limited by the operating pressure. Because the core of this system to improve energy efficiency is based on process-heat-supplied in thermodynamics, which is not in conflict with vacuum technology to improve the mass transfer drive by lowering the pressure, and even the possibility of combining. As a result, there are possibilities for combining this system with vacuum technology.
Conclusively, the proposed process-heat-supplied for air-carried evaporating separation (ACES) cycle can indeed achieve complete evaporation and separation of brine at the heat source supply temperature of 45~60 °C, thus truly implementing the full recovery of brine at normal temperatures. Compared with the traditional process, the novel evaporating separation process with process-heat-supplied can attain self-adaptive regulation on the driving potential of heat and mass transfer between brine and air in the process through sufficient supply heat flux, avoiding the problem of the heat and mass transfer limit that inevitably occurs in the traditional process. The local evaporation rate in the whole process can be basically maintained at a high level (me-local can be basically sustained above 0.2 kg/h at a supply temperature of 45 °C). Furthermore, since the evaporating separation process with process-heat-supplied does not suffer from heat mass transfer limit, the process not only does not require a supply temperature of over 90 °C, but also the evaporation thermal efficiency can reach 67.81%, which is much higher than that of the conventional process. More importantly, the substantial decrease in the operating temperature also allows the solar ACES system coupled process-heat-supplied to recover the latent heat of evaporation efficiently by utilizing the solar heat pump with a small temperature difference. This heat pump with small temperature difference can really effectively make full advantage of the high-grade electrical energy obtained from solar photovoltaics and convert it into several times of low-grade thermal energy for the evaporation of process feed heat, which makes it possible for the integrated solar utilization efficiency of this system to be over 100%. Judging from the results of thermal analysis, the theoretical evaporation rate for unit area of solar irradiation can be up to 2.23 kg/(m2·h), and the comprehensive utilization rate of solar irradiation energy can be up to 188%, while both can be up to 1.41 kg/(m2·h) and 95.2%, respectively, when considering the overall losses. Accordingly, the process-heat-supplied technology proposed and investigated in this paper provides a feasible and efficient path for the development of brine separation systems at normal temperatures, and provides a novel research direction for the dual demands of “full recovery” and “ high energy efficiency “ in the treatment of saline wastewater.
Admittedly, the process-heat-supplied technology presented in this paper is not perfect. According to the conclusions of the current investigation. Further in-depth research and improvement can be implemented in the future from the following two aspects:
(1) The evaporating separation unit with process-heat-supplied designed in this paper has a large size and is not compact enough. In the future, intensive research is warranted to develop and design a more compact and efficient heat supply structure to reduce the manufacturing cost of the unit in response to this problem.
(2) The process-heat-supplied technology is based on thermodynamic, thus it has tremendous potential for technological combination with existing high-efficiency evaporation technologies (e.g., interfacial evaporation technology, vacuum evaporation technology, etc., which are not in conflict with this technology). The future research on the combination, matching and system coupling relationship for the high-efficiency evaporation and separation system of brine combined with multiple technologies also has a broad prospect.


Responses