GDP-mannose 4,6-dehydratase is a key driver of MYCN-amplified neuroblastoma core fucosylation and tumorigenesis

Introduction
Neuroblastomas (NB) are devastating childhood cancers that account for 15% of all childhood cancer deaths [1]. N-MYC is a key oncogenic transcription factor and driver of NB tumorigenesis [2]. MYCN-amplification is a feature of nearly 40% of all high-risk NBs and is sufficient for risk stratifying tumors as high-risk [3]. Children with high-risk disease have poor 5-year survival despite aggressive multimodal treatment [2, 4]. These features highlight the need to better understand drivers of NB disease progression to inform the design of novel therapeutic strategies.
The genetic landscape of NB is well defined, but little attention has been devoted to the role of post-translational modifications in NB development and progression [1, 2]. N-linked glycosylation is a major post-translational modification, whereby sugar complexes are added to asparagine residues [5]. Complex sugar conjugates can alter protein conformation, localization, stability, and activity [5, 6]. Although glycosylation patterns are different in many adult cancers, few studies have focused on glycosylation changes associated with pediatric solid tumors in situ [6,7,8,9]. In this study, matrix-assisted laser desorption ionization mass spectrometry imaging (MALDI-MSI) was performed on human NBs to identify increased core fucosylated glycan abundance within neuroblast-rich regions of MYCN-amplified NBs [10].
Fucosylation is the addition of L-fucose, a rare mammalian sugar, to proteins and lipids [5, 11]. Exogenous fucose can either be salvaged or synthesized de novo from GDP-mannose precursors [12]. Conversion of GDP-mannose to GDP-fucose in the de novo synthesis pathway is mediated by two enzymes: GDP-mannose 4,6-dehydratase (GMDS) and GDP-L fucose synthase (GFUS encoded by TSTA3) [13]. Core fucosylation is an important type of N-linked glycosylation, whereby fucose is added to the α1,6 position of the N-acetylglucosamine (GlcNAc) residue adjoining asparagine by fucosyltransferase 8 [5, 13]. In the current study, high GMDS expression was associated with poor patient survival, advanced-stage disease, and MYCN-amplification. These findings led us to hypothesize that GMDS is a key mediator of NB core fucosylation and is critical for NB progression.
Results
MALDI-MSI reveals increased abundance of core fucosylated N-linked glycans in neuroblast-rich regions of MYCN-amplified human NBs
The N-linked glycome of MYCN-amplified NB tumors was profiled using MALDI-MSI to compare MYCN-amplified and MYCN non-amplified Stage 4 human NB primary tumors. Five MYCN-amplified and four MYCN non-amplified human NB tumors were evaluated (Fig. 1). As anticipated, marked heterogeneity was noted in the histopathological analysis of human NB tumor tissues. Neuroblast-rich and schwannian cell-rich stroma regions were identified using slide-adjacent H&E sections and overlaid onto the MALDI-MSI spectra (Fig. 2A). MALDI-MSI identified 59 N-linked glycans in human NB samples, based on internal standards.

De-identified FFPE human NB tumors were sectioned at 4 µM. Adjacent slides underwent MALDI-MSI protocol and H&E staining. PNGase F application mediated enzymatic release into an α-Cyano-4-hydroxycinnamic acid (CHCA) matrix. MALDI-MSI was performed on a timsTOF fleX. H&E and acquired spectra were overlaid in SCiLSTM Lab.
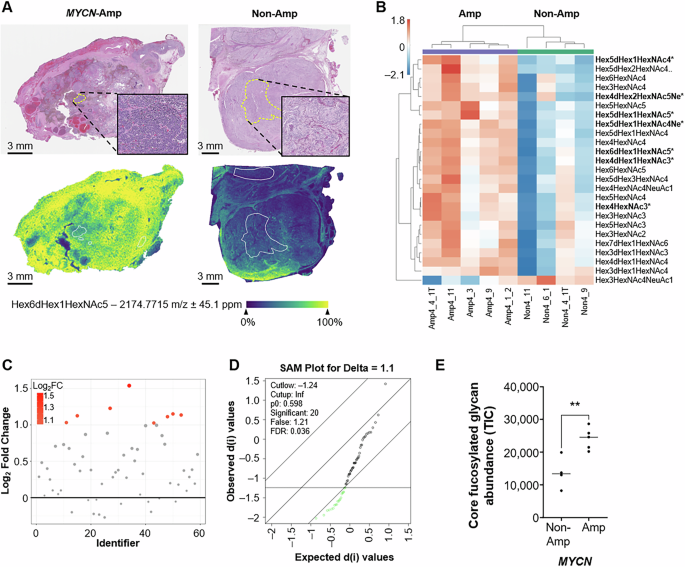
A Representative spectra for Hex6dHex1HexNAc5 (m/z 2174) with MYCN-amplified (left panel) and MYCN non-amplified (right panel) human NB tumors. Relative ion count is represented from blue (low) to yellow (high). Regions of interest were histologically annotated to identify neuroblast-rich regions within tumor specimens demonstrated in the upper panel inserts. B Heatmap for the top 25 differentially expressed N-linked glycans. Statistically significant N-linked glycans are highlighted in bold with an *. C Fold change analysis reveals eight unique N-linked glycans with log2 fold change >1. D Significance analysis of microarrays revealed 20 significant N-linked glycans with q values < 0.05. E Total abundance of core fucosylated N-linked glycans compared between MYCN-amplified and MYCN non-amplified human NB samples were calculated by summation of the total ion counts (TIC) and compared using an unpaired t test (p < 0.01).
Neuroblasts are neural crest-derived immature nerve cells that are the predominant cancer cell of NBs. Analysis of neuroblast-rich regions of human NB tissues revealed differential N-linked glycan abundance between MYCN-amplified and MYCN non-amplified tumors. A heatmap of the top 25 differentially expressed N-linked glycans between MYCN-amplified and MYCN non-amplified NBs is shown in Fig. 2B. The complete heatmap for the neuroblast-rich N-linked glycome is displayed in Supplementary Fig. S1A. Eight N-linked glycan species showed a twofold increase in abundance in MYCN-amplified NBs (Fig. 2C). Significance analysis of microarrays revealed 20 N-linked glycans that were significantly different between our two cohorts, featuring a q value < 0.05 (Fig. 2D). Overall, seven differentially abundant N-linked glycans met our fold change and statistical thresholds. All seven differentially abundant glycans were enriched in MYCN-amplified NBs. Six of these glycans feature core fucosylation and five are complex in nature (Table 1). MYCN-amplified tumors also showed an increased abundance of two sialylated N-linked glycan species. The total abundance of core fucosylated glycans was measured by the summation of all core fucosylated glycans for MYCN-amplified and MYCN non-amplified NBs. Notably, total core fucosylated glycans were increased within the neuroblast-rich regions of MYCN-amplified NBs (p < 0.01; Fig. 2E). The summation of all N-linked glycans without core fucosylation is featured in Supplementary Fig. S1B but was not significantly different between MYCN-amplified and MYCN non-amplified NB tumors. Overall, MALDI-MSI revealed an increase in a core fucosylated glycans within the neuroblast-rich regions of human MYCN-amplified NB specimens.
Schwannian cells are the principal glial component of the peripheral nervous system and can be a marker of NB tumor differentiation. Histologic review of our cohort revealed schwannian-rich stroma within three MYCN-amplified and three MYCN non-amplified NBs. Tumors were excluded from the larger cohort secondary to a predominance of treatment-effect necrosis and immune cell infiltration within the stroma. A heatmap of the top 25 differentially abundant N-linked glycans within the schwannian stroma is displayed in Supplementary Fig. 2A. Fold change analysis revealed eleven glycans with log2 fold changes >1 (Supplementary Fig. S2B). Significance analysis of microarrays revealed that two N-linked glycans featured raw p values less than 0.05 (Hex5dHex1HexNAc5 and Hex5HexNAc5), however calculated q-values accounting for multiple comparisons failed to reach our statistical threshold (q < 0.05; Supplementary Fig. S2C). Overall, MALDI-MSI enabled spatial resolution of the N-linked glycome of human NBs but the heterogeneity of human NBs limited the sample size and statistical power of our schwannian stroma analysis.
High de novo fucose synthetic gene expression is associated with advanced stage NB and poor overall survival
Identifying increased core fucosylated glycan species within neuroblast-rich regions of MYCN-amplified NBs prompted exploration of the Kocak and SEQC databases within the R2 microarray analysis and visualization platform (http://r2.amc.nl) [14, 15]. This study aimed to determine whether the expression levels of key drivers of de novo GDP-fucose synthesis genes (GMDS, TSTA3), GDP-fucose transport (SLC35C1), and fucose salvage pathway (FUK, FPGT) are associated with poor overall patient survival in human NB tumors [14, 16]. Fucosyltransferase 8 (FUT8) was also evaluated and mediates the final step of core fucosylation. Kaplan–Meier analysis demonstrated that high expression of both de novo GDP-fucose synthesis genes (GMDS and TSTA3) was associated with poor overall patient survival (Bonf p < 0.0001, Bonf p < 0.0001; Fig. 3A, D; Supplementary Fig. S3A). High levels of GMDS and TSTA3 were also observed in Stage 4 tumors (p < 0.0001, p < 0.0001; Fig. 3B, E; Supplementary Fig. S3D), and MYCN-amplified NBs (p < 0.001; Fig. 3C, F; Supplementary Fig. S3G). The expression level of SLC35C1, the GDP-fucose transporter in the Golgi, was not associated with poor patient survival (Data not shown). FPGT and FUK encode key fucose salvage pathway enzymes. Low FPGT expression was associated with poor patient survival (Bonf p < 0.001; Supplementary Fig. S3B). Lower FPGT levels were also observed in Stage 4 NBs (p < 0.001; Supplementary Fig. S3E) and within MYCN-amplified NBs (p < 0.0001; Supplementary Fig. S3H). Expression of FUK did not correlate with patient survival, stage of disease, or MYCN-amplification status (data not shown). High levels of FUT8 are associated with poor overall patient survival but was not associated with stage of disease or MYCN-amplification status (Supplementary Fig. S3C, F, I). In summary, high expression of de novo GDP-fucose synthetic genes is associated with advanced stage disease, MYCN-amplification, and poor overall survival in independent and robust human NB cohorts. GMDS was thus selected as a potential metabolic vulnerability for further investigation, given its association with adverse NB clinical features and its role as the first committed step of de novo GDP-fucose synthesis.
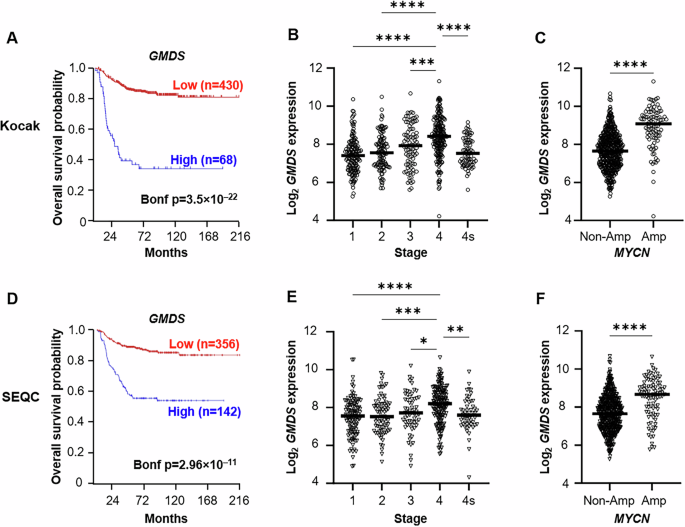
A, D Kaplan–Meier analysis of the Kocak (upper panels) and SEQC (lower panels) databases was performed using the scanning features with Bonferroni correction. B, E GMDS expression is increased in Stage 4 NBs. One-way ANOVA was performed with Tukey correction. C, F GMDS expression was enriched in MYCN-amplified (MYCN-amp) tumors. Significance determined by unpaired t test.
GMDS is a direct transcriptional target of N-MYC
Identifying that MYCN-amplified NBs have higher GMDS expression and a higher abundance of core fucosylated glycans led us to hypothesize that N-MYC may alter core fucosylation by directly regulating GMDS expression. First, GMDS protein expression was quantified across a panel of human NB cell lines featuring two MYCN non-amplified (SK-N-SH and SK-N-AS) and five MYCN-amplified (BE(2)-C, CHP-212, SK-N-DZ, IMR-32, and LAN-1) cell lines by western blotting (Supplementary Fig. 4A). Normalized GMDS expression quantification revealed a trend towards higher GMDS expression within MYCN-amplified cell lines in vitro (Supplementary Fig. 4B). Modulation of MYCN using MYCN tet-on and tet-off inducible SHEP cells showed a direct correlation between MYCN expression and both GMDS mRNA and protein expression (Fig. 4A, B). The activation of the GMDS promoter by high MYCN expression was assessed using a luciferase promoter assay. In brief, the GMDS promoter was adjoined to a luciferase reporter and transfected into MYCN tet-on SHEP cells, where induction of MYCN increased GMDS promoter activity six-fold (Fig. 4C). The GMDS promoter features 11 non-canonical E-boxes as candidate binding sites for N-MYC activation. To determine whether N-MYC directly interacts with the GMDS promoter, we conducted a ChIP assay targeting N-MYC in MYCN-amplified BE(2)-C cells. This assay revealed enrichment of the GMDS promoter sequence within the DNA fragments pulled down by N-MYC, supporting the hypothesis that there is a direct interaction between N-MYC and the GMDS promoter (Fig. 4D). APEX, a known N-MYC target gene, was used as the positive control. Together, these results support a direct mechanism through which N-MYC interacts with and activates the GMDS promoter.
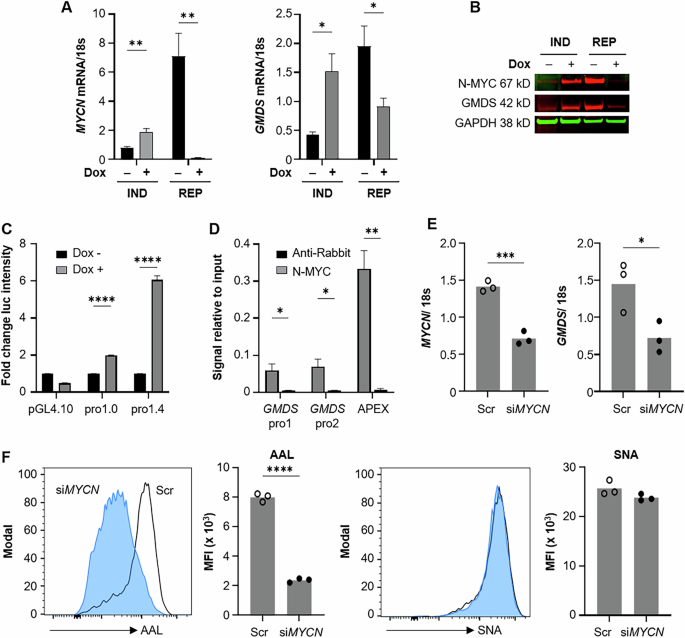
MYCN-regulatable SH-EP cells, labeled IND (inducible) or REP (repressible) were treated with 40 ng/mL doxycycline (Dox). GMDS and MYCN mRNA and protein were measured by qPCR (A) or western blot (B). C MYCN-inducible SH-EP cells were transfected with a GMDS promoter reporter, shortened promoter, or PGL4.10 vector as control, followed by 48 h treatment with 100 ng/mL doxycycline. Firefly and Renilla luminescence were measured; values shown are normalized to Renilla. D Chromatin from BE(2)-C cells was pulled down with anti-N-MYC or anti-rabbit antibody and purified genomic DNA was measured by qPCR with DNA from 2% input used as standard. E, F BE(2)-C cells were treated with scramble or MYCN siRNA and collected for rt-PCR to confirm the knockdown at 72 h as well as lectin-based flow cytometry at 96 h. Example histograms are normalized to mode; open histogram, scramble siRNA; closed blue histogram, siMYCN. Bar graphs indicate mean fluorescence intensity (MFI) with each dot representing one treated well. AAL Aleuria aurantia lectin (core fucose), SNA Sambucus nigra lectin (sialic acid). Significance determined by multiple t tests (A,C,D) or unpaired t test (E, F); bars indicate mean; error bars indicate SEM.
Transient MYCN knockdown and chemical blockade using bromodomain inhibition was used to evaluate whether oncogenic N-MYC signaling alters core fucosylated abundance in NBs. Transient knockdown of MYCN using siRNA in our MYCN-amplified BE(2)-C cell line resulted in significant reduction in GMDS mRNA, as well as a 75% reduction in core fucosylation (Fig. 4E, F). There was no concurrent change in sialylation, suggesting specificity of the N-MYC/GMDS interaction in modulating core fucosylation. Bromodomain inhibition via JQ1 similarly blocked N-MYC expression and GMDS expression in association with a 50% reduction of AAL fluorescence [17, 18] (Supplementary Fig. S5). These findings demonstrate that N-MYC is a direct activator of the GMDS promoter and provides a rationale for high GMDS expression and core fucosylated glycan abundance within human MYCN-amplified NB tumors.
GMDS is a key mediator of NB core fucosylation and promotes NB migration, adhesion, and tumor formation
Genetic knockdown of GMDS (shGMDS) was performed in MYCN-amplified BE(2)-C cells to evaluate whether de novo GDP-fucose synthesis was a key mediator of NB core fucosylation and survival (Fig. 5A). Lectin-based western blotting, flow cytometry, and ELISA revealed that GMDS-knockout cells had lower whole cell, cell surface, and secreted core fucosylated glycans (Fig. 5B–D). Exogenous L-fucose media supplementation (50 µM and 150 µM) rescued the cell surface and secreted core fucosylated glycan abundance (Fig. 5E), demonstrating that the salvage pathway is capable of compensating for de novo fucose synthetic defects. Knockdown of GMDS also altered NB cell attachment and migration. A two-fold decrease in cellular adhesion was observed in shGMDS cells using the VybrantTM adhesion assay (Fig. 5F). When migration was assessed via wound healing assay, shGMDS cells moved significantly slower than control cells, failing to close a uniform gap after 64 h (Fig. 5G; Supp Fig S6). Overexpression of GMDS within both MYCN-amplified BE(2)-C cells and MYCN non-amplified SK-N-SH cells resulted in increased whole cell core fucosylated glycan abundance detected via western blotting (Supplementary Fig. S7A, S7C). BE(2)-C cells stably selected for GMDS overexpression (pCMV-GMDS) also demonstrated enhanced adhesion compared to control-transfected cells (Supplementary Fig S7B). Overall, these features demonstrate that GMDS is a critical regulator of core fucosylation, cellular adhesion, and migration in vitro.
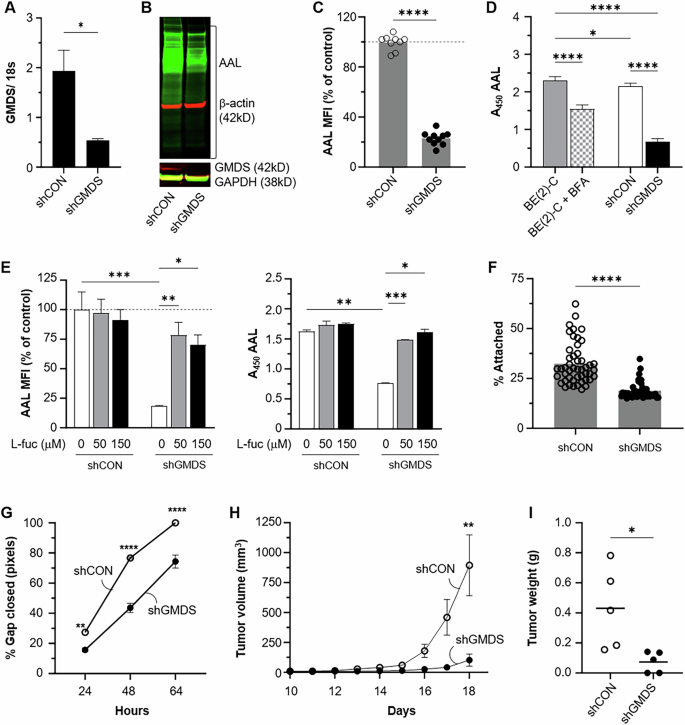
BE(2)-C cells were stably transfected with GMDS (shGMDS) or scramble (shCON) shRNA. A Quantitative PCR results (GMDS mRNA fold-difference) are shown for each transfection. B Cells were lysed and a western blot using Aleuria aurantia (AAL) and an anti-GMDS antibody was performed. C Cell surface core-fucosylation status was analyzed by lectin-based flow cytometry. AAL mean fluorescence intensity (MFI) for shGMDS cells was normalized to the average value for shCON cells (dashed line at 100). Pooled data from three independent experiments at different passages is shown. D AAL absorbance values are shown for supernatant collected from BE(2)-C, shCON, and shGMDS cells after 24 h incubation in serum free medium. Brefeldin A (BFA) is included as a positive control for secretory pathway blockade. E BE(2)-C shCON and shGMDS cells were grown for 3 d with indicated concentrations of L-fucose and then analyzed for AAL binding by flow cytometry (left panel) or ELISA (right panel). MFI of all samples was normalized to untreated shCON samples (gray dashed line at 100) for the top figure. F A Vybrant cell adhesion assay was performed, and percentage of cells attached at completion is shown (n = 48 samples per cell type). G Cell migration was measured via wound healing assay where a uniform gap was created at t = 0 h. Example images are provided in Supplementary Fig. S6. H Tumor induction using GMDS genetic knockdown cells (shGMDS) was completed by injection into the bilateral flanks of athymic nude mice. Daily tumor measurements were performed with linear mixed effects modeling (p = 0.009). I Tumor explant weight was also compared at sacrifice. Bars or points indicate mean ± SEM. Representative data from one of two (F) or three (C–E, G) independent experiments is shown, n = 3 biological replicates per condition. Significance determined by unpaired t test (A, C, F, I), two-way ANOVA (G) or one-way ANOVA (D, E); only significant comparisons are shown.
The role of GMDS in MYCN-amplified NB tumor formation was assessed by measuring subcutaneous tumor formation following shGMDS and shCON implantation in the flanks of athymic nude mice. Mixed-effects modeling revealed that the shGMDS tumor volume was significantly lower than that of control tumors (p = 0.009; Fig. 5H). Tumor explant masses were also decreased by three-fold within the shGMDS group (p < 0.05; Fig. 5I). Three out of five shGMDS inoculations formed tumors in the trial, whereas all shCON injections yielded tumors (p = 0.44). Interestingly, while the shGMDS tumors were small or failed to form, no gross histological differences or differences in AAL abundance were noted between shCON and shGMDS tumors (data not shown). Together, these data suggest that NBs are reliant upon GMDS and de novo GDP- fucose synthesis for core fucosylated glycan production, adhesion, and migration in vitro and that GMDS, while critical for tumor formation and growth in vivo, may be compensated for to preserve fucosylation within the tumor microenvironment. Nevertheless, these data indicated that GMDS is a key contributor to MYCN-amplified NB tumor development and invited further investigation into the efficacy of chemically blocking fucosylation in preclinical models of NB.
2-fluorofucose blocks NB core fucosylation and abrogates tumor growth in vivo
2-fluorofucose (2-FF) is a fucose analog that is passively taken up by the salvage pathway of GDP-fucose production and inhibits both de novo fucose biosynthesis as well as fucosyltransferase activity [19, 20]. Thus, 2-FF was used as a chemical tool to evaluate whether the small-molecule inhibition of fucosylation impacted NB viability and growth. This compound successfully blocked NB core fucosylation, as detected via western blotting, flow cytometry, and ELISA, demonstrating global depletion of core fucosylated glycans (Fig. 6A–C). Flow cytometry revealed a clear dose-dependent effect with 150 μM treatment resulting in a loss of as much as 90% of AAL binding intensity in live cells. Similar to GMDS genetic knockdown, 2-FF addition to BE(2)-C cells elicited a four-fold decrease in cellular adhesion compared to vehicle-treated controls (Fig. 6D). Five-day 2-FF incubation inhibited NB cell viability in MYCN-amplified BE(2)-C, SK-N-DZ, and CHP-212 cells (Supplementary Fig. S8A). Treatment of BE(2)-C cells induced cell death in vitro as evidenced by the induction of PARP cleavage at day 3, as well as a loss of Cyclin D1 at the same time point (Supplementary Fig. S8B). In summary, 2-FF is a fucosylation inhibitor that induces viability and adhesive defects similar to GMDS genetic knockdown and is an appropriate chemical probe for investigating whether fucosylation blockade is an effective strategy for blocking in vivo NB tumor growth.
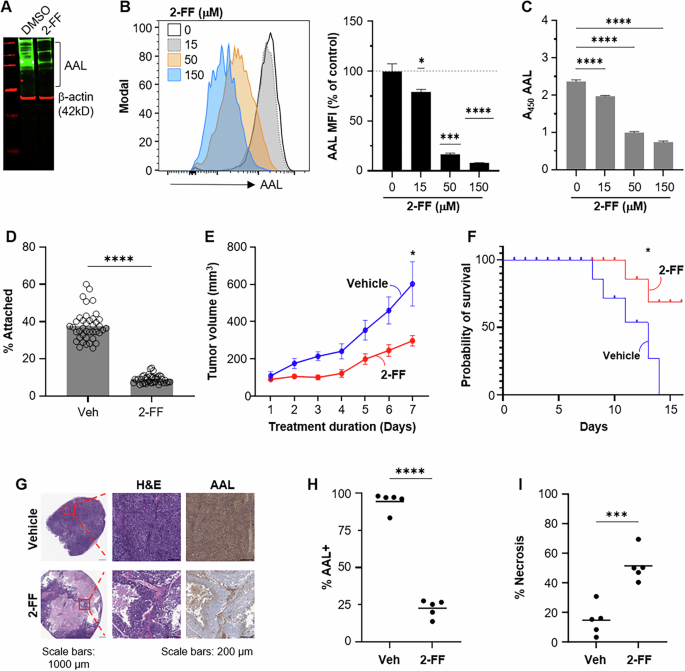
A BE(2)-C cells incubated with 100 μM 2-FF for 5 d were assessed for core fucosylation by Aleuria aurantia (AAL) western blot. BE(2)-C cells were grown for 3 d in the presence of DMSO or indicated concentrations of 2-FF and then analyzed by flow cytometry (B) or lectin-based ELISA (C) with AAL. An example histogram is shown for indicated concentrations of 2-FF. AAL mean fluorescence intensity (MFI) was normalized to DMSO control values (indicated by dotted line at 100). Representative data from one of three independent experiments is shown for each. D A Vybrant cell adhesion assay was performed using BE(2)-C cells treated for two days with 500 μM 2-FF (n = 40/ treatment). E–I Established BE(2)-C tumors were randomized to 2-FF or vehicle water supplementation. E Serial tumor measurements were compared by linear mixed effect modeling (p = 0.02). F Kaplan–Meier analysis with log-rank testing revealed 2-FF treatment prolonged survival (p = 0.02). G H&E staining reveals large areas of treatment-effect necrosis at low power (×20) magnification. High power magnification is shown in the red inset (center image). AAL IHC staining (H), and the total necrotic percentage of each tumor (I) were quantified in QuPath0.4.3. Significance determined by one-sample t test (B), one-way ANOVA (C), or unpaired t test (D, H, I); only significant comparisons are shown. Bars or lines indicate mean; error bars indicate SEM.
2-FF has previously been used to investigate the impact of chemical fucosylation blockade on tumor progression in established tumor models [19, 21]. To evaluate the effect of the pharmacological blockade of core fucosylation on NB tumor progression, MYCN-amplified tumors were established to 75 mm3 and then randomized to 2-FF supplemented (50 mM) water or vehicle control. 2-FF water supplementation decreased tumor volume by 2.5-fold compared to vehicle-treated control mice (p < 0.05; Fig. 6E). Kaplan–Meier analysis also revealed prolonged survival with 2-FF treatment using a humane endpoint of maximal tumor dimension >1.5 cm (p < 0.05; Fig. 6F). Treatment mice demonstrated no changes in behavior or adverse effects. Similar water consumption and body weight were observed in both groups throughout the trial. AAL IHC demonstrated that 2-FF treatment decreased the abundance of core fucosylated glycans by nearly 75%, and histological evaluation demonstrated large areas of treatment-effect necrosis encompassing over half of the examined tumor area, compared to less than 20% of total tumor area in vehicle controls (Fig. 6G–I). Venous thromboembolism has been observed within clinical trials of 2-FF in humans; however, pathologic review of 2-FF treated tumors revealed no evidence of thromboembolism within tumors. Although survival analysis of 2-FF-treated mice was terminated at day 18 due to compound expense, these data nonetheless show that 2-FF was well-tolerated and impeded MYCN-amplified tumor growth via the induction of tumor cell death within our established NB tumor model.
Discussion
Historically, glycome profiling of solid tumors has largely been performed on cell lines in vitro or using whole tissue homogenates that may obscure or mask differential glycan abundance within heterogeneous solid tumors, such as neuroblastomas. However, recent advances in imaging mass spectrometry have allowed tissue heterogeneity to be preserved, thus permitting comparison of unique histologically-comparable regions of interest across patient samples [22,23,24]. Herein, we performed MALDI-MSI to profile N-linked glycans in situ within human NBs. Given the master regulatory role of oncogenic MYC signaling, we sought to define the N-linked glycome differences between MYCN-amplified and non-amplified tumors and focused our initial characterization on the analysis of neuroblast-rich regions that feature this genetic signature [25]. Our analysis revealed an increased abundance of core fucosylated glycans as a unique feature within neuroblast-rich regions of human MYCN-amplified NBs. Heterogeneity of the stromal compartment featuring treatment-effect necrosis and immune cell infiltration led to select case exclusion, limiting the statistical power of our analysis of schwannian-rich stroma regions. Initial identification of unique metabolic end products within human MYCN-amplified tumors informed exploration of robust existing and publicly shared RNA sequencing repositories to guide selection of de novo fucose synthesis as a novel therapeutic target for further investigation [14, 16].
Although increased core fucosylation is a common feature of many advanced adult cancers, the role of aberrant fucosylation in NB development and progression has not been previously described [13, 26]. This is the first in situ characterization of the N-linked glycome of human NBs focusing on MYCN-amplification, a key genetic feature critical for NB risk stratification. Oncogenic MYC contributes to malignant transformation by driving glucose, glutamine, serine, essential amino acids, and fatty acid metabolism in cancer cells [27]. A guiding principle for our study design was that the metabolic transforming consequences of MYCN-amplification would elicit a unique N-linked glycan signature. Oncogenic MYC signaling has recently been reported as a driver of sialoglycan production [28]. Intriguingly, core fucosylated glycans were increased within the neuroblast-rich identified within our MYCN-amplified NB cohort. Given the described role of oncogenic MYC in regulating both glycolytic and glutamine-derived precursors of the hexosamine biosynthetic pathway, further investigation into how oncogenic MYC levels may alter glycan precursor pools to facilitate unique glycans profiles merits further study [29].
GMDS is the first of two enzymes necessary for the conversion of GDP-mannose to GDP-fucose in the de novo GDP-fucose biosynthetic pathway. N-MYC preferentially binds to E-boxes, and the GMDS promoter features 11 non-canonical E-boxes [30]. Induction and repression of N-MYC in NB cells directly correlated with GMDS expression, and promoter reporter and chromatin immunoprecipitation assays demonstrated that N-MYC has a direct role in activating the GMDS promoter. These findings provide a mechanistic link by which this high-risk NB genetic profile augments the critical mediators of de novo GDP-fucose synthesis. GMDS has previously been shown to be regulated by oncogenic C-MYC/Max signaling in Burkitt’s lymphoma [31]. Herein, we extend this link to aberrant N-MYC signaling and demonstrate in vitro that RNA interference and chemical inhibitors of MYC signaling can alter the abundance of core fucosylated glycans in MYCN-amplified NBs in vitro. Notably, genetic knockdown of GMDS within our MYCN-amplified tumor model limited MYCN-amplified tumor growth but did not significantly lower core fucosylated glycan abundance as detected by AAL IHC. This may suggest the capacity of the salvage pathway to at least in part compensate for de novo fucose synthesis blockade in vivo. N-MYC dysregulation is a key feature of subsets of several other pediatric (rhabdomyosarcoma, medulloblastoma, Wilms tumor, and retinoblastoma) and adult cancers (prostate cancer, small cell lung cancer, basal cell carcinomas, breast cancer, glioblastoma multiforme) [32]. Identifying whether increased core fucosylated glycan abundance is a consistent feature of N-MYC overexpression and MYCN-amplified cancers merits further investigation and may provide a rationale for the design of clinical trials to investigate the efficacy of drugs targeting de novo GDP-fucose production.
Recognition of aberrant glycosylation as a potential mediator of cancer progression has prompted considerable efforts to create small-molecule chemical tools to allow therapeutic manipulation of the glycome [33]. 2-FF is a commercially available fucose analog that is taken up through the salvage pathway but blocks fucosylation through the de novo pathway and fucosyltransferases [19]. Peroral bioavailability and tolerance in animal models make it an appealing drug candidate. However, these compounds have low potency, and a phase I adult clinical trial was stopped due to a high risk of thromboembolic events [34]. Contrary to the results of our in vivo GMDS knockdown animal studies, treatment of MYCN-amplified NB tumors with 2-FF both decreased core fucosylation abundance detected by AAL IHC and demonstrated large islands of necrosis on gross pathology. Given that 2-FF blocks both de novo GDP-fucose synthesis and fucosyltransferases, 2-FF may be more effective in blocking core fucosylation in vivo due to its ability to block the downstream activity of fucosyltransferases. Several other groups have recently reported new fucose derivatives that potently inhibit de novo fucose synthesis and/or fucosyltransferases, including fucostatin, Fucotrim I, 6-alkynyl fucose, and FDW028 [35,36,37,38]. Future investigations will seek to evaluate the utility of these fucosylation inhibitors in advanced preclinical NB models.
A key limitation of our study was the limited number of clinical samples and access to clinical features in our MALDI-MSI analysis of human NBs. Correlating GMDS expression with NB patient survival, stage of disease, and MYCN-amplification within large, independent human NB cohorts strengthens our confidence that de novo fucose synthesis is critical for human NB tumor progression. However, validating our MALDI-MSI observations within larger cohorts correlated with patient outcomes is an essential next step in exploring a potential new field of pediatric solid tumor biology. FFPE tissue microarrays are a rare resource for studying pediatric solid tumors but are well-suited for interrogation with MALDI-MSI [22]. Another limitation of our bench investigations was the use of an immunodeficient animal model to assess the impact of de novo fucose synthesis blockade on NB progression. We demonstrated that NB cells have decreased adhesion in our in vitro assays but have not elucidated the implications of these cell surface changes within advanced in vivo models of NB featuring competent cancer-stroma and cancer–immune cell interactions.
Materials/subjects and methods
Human samples
Formalin-fixed paraffin-embedded (FFPE) NBs were obtained from residual tumor samples archived at Cincinnati Children’s Hospital Medical Center (Cincinnati, OH). Nine patients with Stage 4 primary neuroblastomas were included in our analysis. Four of these neuroblastomas were MYCN non-amplified, and five were MYCN-amplified. All NB samples were Stage 4 primary tumors previously treated with chemotherapy and available clinical data is summarized in Supplementary Table S1.
Tissue preparation and enzyme digestion
FFPE NB samples were prepared for MALDI-MSI analysis as previously described (Fig. 1) [10]. Briefly, 4 µm slices were cut onto positively charged slides, dewaxed, and deparaffinized. Slides were then submerged in citraconic anhydride buffer (50 mL HPLC water, 25 µL citraconic anhydride, and 2 µL of 36.5–38% HCl) and boiled for antigen retrieval. Buffer was then exchanged with water prior to final full water submersion. Slides were dried in a vacuum desiccator prior to enzymatic digestion.
MALDI-MSI
For the enzymatic cleavage of N-linked glycans and glycogen, an HTX M5 robotic sprayer was used to dual spray 14 passes of PNGaseF prime (N-glycan cleavage from asparagine residue) and isoamylase (α1,6 branch cleavage for glycogen) per slide, at a concentration of approximately 0.1 µg/µL PNGaseF prime and 3 U isoamylase as previously described [10]. A timsTOF fleX (Bruker) with a NyGU laser operating at 1000 Hz and 90% laser energy with 200 AU energy was used to obtain N-linked glycan spectra. Laser spot size was set to 50 µm, raster size was 50 µm, and 300 shots per pixel were collected and averaged per 50 µm pixel. Mass acquisition was set to 500 m/z-3500 m/z and tuned between runs. Files were analyzed and filtered using feature lists containing m/z values for ~150 glycans. Neuroblast-rich and schwannian-rich stromal regions of interest (ROI) were identified by H&E staining from an adjacent slide with our team pathologists using QuPath-V0.4.3 [39]. Annotated ROIs were imported and aligned using SCiLSTM Lab (Bruker). Average total ion count for each specimen was analyzed using MetaboAnalyst 5.0 [22, 40]. Significant n-linked glycans were identified by significance analysis of microarrays (SAM) with a q value < 0.05 and log2 fold change >1 [40].
Cell culture
Cell line sources and validation information is provided in Supplementary Table S2. Cells were maintained in DMEM or RPMI 1640 containing 1% Pen/Strep (Cytiva, Marlborough, MA) and 10% FBS (Biowest, Bradenton, FL) in a humidified 37 °C/5% CO2 environment. Cells were passaged at 75% confluency, and experiments were performed before passage ten. All cell lines were either newly purchased or tested for Mycoplasma (MycoStrip; Invivogen) and verified by STR analysis (LabCorp).
Transfection
Human GMDS 4 unique 29-mer shRNA constructs in retroviral untagged vector (OriGene Technologies, Rockville, MD) or scramble shRNA were transfected into BE(2)-C cells with Lipofectamine 3000 (Thermo Fisher, Waltham, MA). Cells were selected in growth medium with puromycin to generate stable GMDS-downregulated (shGMDS) and scramble control (shCON) cell lines. For GMDS overexpression, human GMDS (NM_001500, # RC200471) and pCMV6 entry vector (# PS100001; OriGene Technologies, Rockville, MD) were transfected into Be2C and SK-N-SH cells. BE(2)-C cells were stably selected with G418 selection. For MYCN silencing, 50 pmol/well of ON-TARGETplus MYCN siRNA (Dharmacon, Lafayette, CO) or non-silencing control siRNA were transfected into BE(2)-C cells using Lipofectamine RNAiMax (Thermo Fisher).
mRNA quantification
Total RNA from cultured cells was isolated using the RNAqueous Total RNA Isolation Kit (Thermo Fisher). RNA was reverse-transcribed using the qScript cDNA Synthesis Kit (Quanta, Houston, TX). Reverse-transcribed RNA was amplified using Powerup SYBR Green PCR Master Mix (Applied Biosystems, Foster City, CA). All data are presented relative to 18S RNA. Primer sequences used are listed in Supplementary Table S3.
Immunohistochemistry
For lectin-based glycan detection, slides were deparaffinized and antigen retrieval was performed using Dako low-pH Target Retrieval Solution (Carpinteria, CA) at 95 °C for 20 min using a Biocare Medical Decloaking Chamber. Endogenous streptavidin-biotin was blocked using Vector Labs Streptavidin/Biotin Blocking Kit (Newark, CA), followed by endogenous peroxidase quenching (Dako) and incubation with Carbo-Free Blocking Solution (CFB; Vector Labs). Slides were incubated with biotin-conjugated Aleuria aurantia lectin (AAL) at room temperature, followed by Peroxidase Streptavidin (Vector Labs), and visualized with DAB (Dako). Specificity was confirmed by pre-incubation of AAL with L-fucose and negative staining in control mouse kidney tissue.
Immunohistochemistry scoring
Slides were scanned at ×20 brightfield at 0.5 μm/pixel using a Leica Aperio AT2 scanner. SVS files were annotated using QuPath [39]. The necrotic percentage of each tumor was determined by specifying the necrotic areas in each tumor and dividing the sum of the necrotic area by the total area of the tumor [41]. Histological interpretations were reviewed by team pathologists. The percentage of AAL-positive cells was determined using QuPath’s positive cell detection with a single threshold over the entirety of each tumor.
Immunoblotting
Cells were lysed in LSD buffer with complete Protease Inhibitor Cocktail (Roche, Basel, Switzerland). Lysate was then centrifuged to remove cellular debris, resolved on a 4–12% NuPAGE gel, transferred to nitrocellulose, and immunoblotted as follows. Membranes were blocked with 0.1% casein, incubated with the primary antibody or AAL overnight, washed, incubated with secondary, washed again, and then quantified using an Odyssey imaging system (LI-COR Biosciences, Lincoln, NE). Floating and adherent cells were collected to assess levels of cleaved PARP and cyclin D1. Reagents are further described in Supplementary Table S4.
Lectin-based flow cytometry
Cells were lifted using Versene (Gibco, Billings, MT), pelleted, resuspended in ice-cold PBS, aliquoted into individual tubes, and incubated with Zombie fixable dead cell dye (BioLegend, San Diego, CA). Non-specific binding was then blocked by incubation with CFB, and biotinylated lectins (AAL and SNA) were diluted in CFB prior to incubation with cells at room temperature. An excess of CFB was then added to each tube before cells were pelleted and incubated with avidin-conjugated Cy5 diluted in flow cytometry buffer (Hanks buffered salt solution without Ca2+/Mg2+, 1% heat-inactivated FBS, 25 mM HEPES, 5 mM EDTA). Cells were then washed and briefly fixed with 4% paraformaldehyde. Each experiment was performed at least three times with three technical replicates per sample. Fluorescence was measured on a BD Symphony, and analysis was performed using FlowJo v.10 (Treestar, Woodburn, OR).
Lectin-based ELISA
To quantify core fucosylated proteins in cell supernatants, 1 × 10⁵ cells were seeded in serum-free medium in a 24-well tissue culture plate and incubated for 20 h. Floating cells were then pelleted, and the cell-free medium was frozen at –20 °C.
Thawed supernatants were added in duplicate to each well of a high binding plate (Greiner Bio-One, Kremsmünster, Austria), and incubated overnight at 4 °C. Serum-free medium was used as a negative control. Plates were washed using PBS/0.05% Tween (PBS-T) and blocked with CFB/0.05% Tween. AAL diluted in CFB was added to each well and incubated for 1 h. Plates were washed and incubated with avidin-HRP diluted in PBS before washing and development with TMB.
Dual luciferase reporter assay
Human genomic DNA was extracted from BE(2)-C cells, and the GMDS gene promoter was amplified from the extracted genomic DNA using a Taq Red Master Mix kit (APExBIO). The PCR product was cloned 5’-upstream of a luciferase reporter gene into pGL4.10[luc2] (Promega, Madison, WI) by restriction enzyme digestion using NheI, HindIII, and T4 ligase (New England BioLabs, Ipswich, MA). The constructed promoter plasmid was sequenced by ACGT. SH-EP MYCN-inducible cells were transfected with the GMDS promoter reporter and pGL4.73[hRluc/SV40] vector. After 24 h, MYCN was induced with doxycycline (100 ng/mL) for 48 h. Cell lysates were used to measure relative luciferase activity using the Dual Luciferase Reporter Assay System (Promega), and Renilla luciferase was used as a control.
ChIP assay
Chromatin immunoprecipitation (ChIP) was performed using a Simple ChIP kit (Cell Signaling Technology, Danvers, MA). In brief, BE(2)-C cells were fixed with 1% formaldehyde; after cross-linking DNA to protein, nuclei preparation, and chromatin digestion, 10 µg of chromatin was incubated with 2 µg anti-N-MYC (Santa Cruz Biotechnology, Dallas, TX), histone H3 antibody (Cell Signaling Technology) or normal rabbit IgG (Cell Signaling Technology) at 4 °C overnight. Protein G beads were used for immunoprecipitation. The DNA was purified by immunoprecipitation and quantified by qPCR. APEX promoter was used as a positive control for N-MYC pulldown [42].
Viability determination
Viability was determined using the Cell Titer Glo Luminescent Viability Assay (Promega) in accordance with manufacturer’s instructions.
Adhesion assay
Vybrant cell adhesion assays were performed according to the manufacturer’s instructions (Invitrogen) using a monolayer of BE(2)-C shCON cells.
Wound healing assay
BE(2)-C cells were seeded in each chamber of an ibidi 2-well 35 mm µ-Dish in complete medium and allowed to adhere overnight. The silicone insert was then removed and serial brightfield images were obtained using an Evos FL (Life Technologies, Carlsbad, CA) at ×4. Images were analyzed using ImageJ with the wound healing size tool, and the percentage of each gap closed was compared [43].
In vitro treatments
Cells were incubated with either 2-FF (SynChem; Elk Grove Village, IL) or equivalent DMSO control. To analyze the effect of 2-FF on the secretion of core-fucosylated proteins, BE(2)-C cells were treated in complete medium with indicated concentrations of 2-FF for 48 h, lifted using Versene, seeded in serum-free medium containing additional 2-FF, and incubated for another 20 h before freezing the supernatant. Brefeldin A (BFA; BioLegend) was added as a control for the final 20 h of culture.
L-fucose was purchased from Vector Laboratories. For rescue trials, cells were incubated for three days in normal medium supplemented with L-fucose (50 and 150 µM).
For pharmacological MYC downregulation, BE(2)-C Cells were seeded and allowed to adhere overnight. The following day, medium was replaced with fresh growth medium containing either 100 nM JQ1 (Selleck Chemicals, Houston, TX) or 0.01% DMSO. Cells were incubated for 5 days before the total cell lysate was harvested for western blotting.
Subcutaneous xenograft trials
Athymic nude mice (Hsd:Athymic Nude-Foxn1nu) were purchased from Inotiv (West Lafayette, IN) and maintained at a barrier facility at the University of Kentucky. Tumors were initiated at 6–8 weeks of age, and mice were humanely euthanized when tumor diameter exceeded 1.5 cm in the greatest dimension.
For our genetic knockdown model, 1 × 10⁵ shCON or shGMDS cells were resuspended in Matrigel (Corning, Corning, NY) and injected into the flank of male athymic nude male mice (n = 5 per group) using a 27-gauge needle. Mice were monitored daily. Xenograft volume was estimated using the following formula [(length × width2)/2] [44]. Serial tumor volume measurements were compared using a mixed-effects model in GraphPad Prism v.10 using fixed effects of treatment and day with a random effect of mouse.
For 2-FF trials, 1 × 10⁵ BE(2)-C cells were implanted with Matrigel into athymic female mice, and tumors were allowed to reach a volume of 75 mm3. Tumor-bearing mice were then randomized to receive 2-FF (50 mM)-supplemented water or vehicle control (n = 5 mice each) [19] and monitored daily to assess tumor volume, water intake, activity, and body mass. No blinding was completed for our animal trials.
Statistical analysis
Graph Pad Prism was used to perform statistical analyses, and the tests are indicated in each figure legend. In all cases, p values < 0.05 were considered significant and are indicated in the figures by asterisks: *, p < 0.05; **, p < 0.01; ***, p < 0.001; ****, p < 0.0001.

Responses