Genetic analyses identify circulating genes related to brain structures associated with Parkinson’s disease
Introduction
Parkinson’s disease (PD) is a neurodegenerative disorder primarily characterized by motor dysfunction, resulting from the loss of dopamine-producing neurons in the substantia nigra region of the brain1. While the exact causes of PD remain unclear, a combination of genetic and environmental factors is believed to contribute to the disease1. Traditional diagnostic methods for PD primarily rely on clinical evaluation. However, in advanced PD, patients often experience non-motor symptoms, such as cognitive decline and mood disorders, which are challenging to assess using conventional clinical evaluations2.
Magnetic resonance imaging (MRI) is a non-invasive imaging technique which has been increasingly employed to identify structural abnormalities and brain changes associated with PD3,4. The advanced MRI techniques, such as diffusion tensor imaging and functional MRI (fMRI), not only capture alterations in brain volume and gray matter density, but also provide insights into the microstructural integrity of brain tissues and the functional connectivity between different brain regions which may associated with PD progression5. However, MRI alone is still insufficient for early-stage or conclusive diagnosis, as the structural changes may overlap with other neurological disease such as essential tremor or multiple system atrophy6. Integrating MRI and circulating gene analysis could enhance the accuracy of early diagnosis and provide insights into disease progression. MRI can reveal structural or functional changes in the brain4, while circulating gene profiles offer molecular-level insights into these changes. For example, pro-aggregating forms of α-synuclein in the blood are considered a biomarker for PD7, while α-synuclein in the brain can mediate neuronal loss, affecting substantia nigra, basal ganglia and cortical area8.
Genome-wide association studies (GWAS) play a pivotal role in identifying genetic variants associated with complex traits and diseases, including PD9,10. Moreover, GWAS summary statistics provides a foundational resource for large-scale population analyzes. For instance, using Linkage Disequilibrium Score Regression (LDSC), these data can estimate genetic correlations between traits and calculate the heritability of complex diseases, while accounting for confounding factors such as population stratification. This enables us to understand the shared genetic basis across different traits and further refine the genetic architecture of diseases11. Additionally, joint analysis expression quantitative trait loci (eQTL) and GWAS summary statistics can bridge the gap between genetic variation and biological function, which enable the identification of specific genes or biological pathways involved in disease progression. For example, methods such as summary-based Mendelian Randomization (SMR)12 and transcriptome-wide association studies (TWAS)13 can pinpoint genes whose expression levels significantly associated with complex traits. While co-localization analysis can further refine these findings by determining whether the same genetic variants influence both gene expression and the trait, thus confirming the shared genetic architecture at specific loci14.
In this study, we integrated GWAS summary statistics for PD, brain IDPs, and circulating eQTLs to perform a comprehensive genetic analysis, incorporating methods such as LDSC, SMR, TWAS, and co-localization. We aimed to identify PD associated IDPs and their underlying driving genes, with results could potentially aiding in diagnosis and treatment of PD in future clinical practice.
Methods
Overall study design
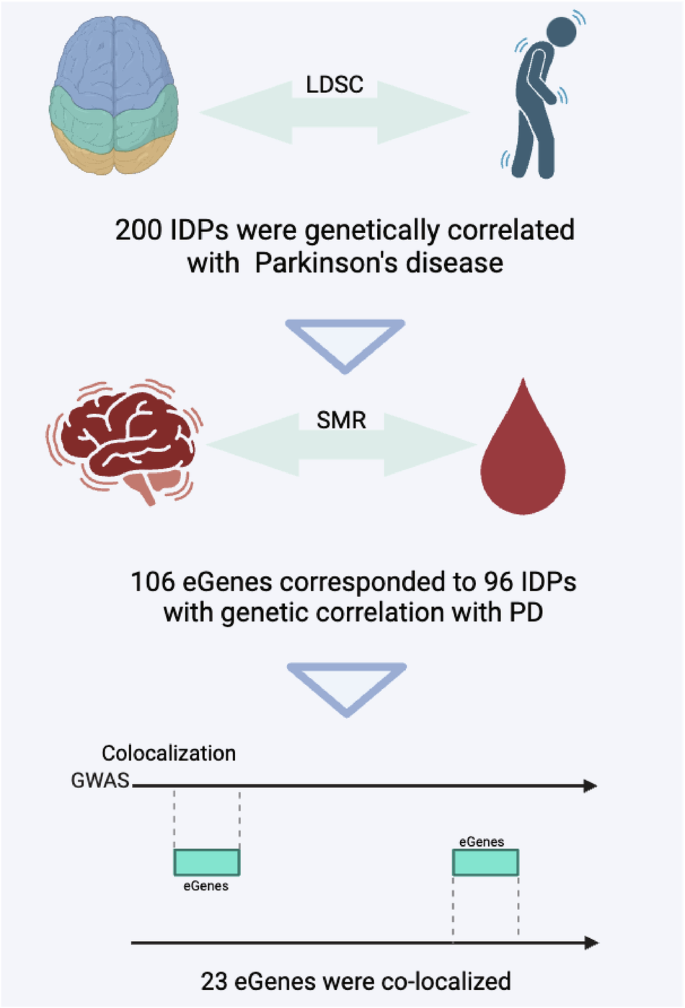
In this study, we first conducted SMR analysis to investigate the causal associations between circulating genes with both brain IDPs and PD. Subsequently, we investigated the genetic correlations between PD and brain IDPs. Through a multi-step intersection approach, we identified a subset where circulating genes, IDPs, and PD were concurrently associated. Finally, co-localization analysis was employed to pinpoint genes simultaneously associated with all three factors. TWAS was used to determine the traits associated with the circulating genes we identified (Fig. 1).
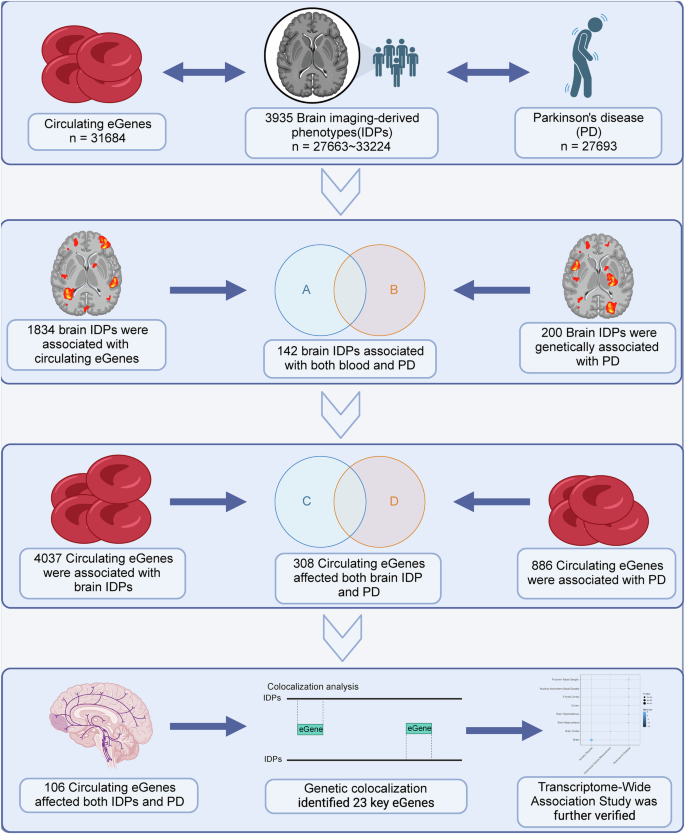
In this study, an initial summary data-based mendelian randomization analysis was conducted to examine circulating genes for causal associations with both brain imaging-derived phenotypes (IDPs) and Parkinson’s disease (PD), followed by an investigation into the genetic correlations between PD and brain IDPs. Using a multi-step intersection approach, a subset was identified where circulating genes, IDPs, and PD showed concurrent associations. Subsequently, co-localization analysis was employed to pinpoint genes associated with all three factors simultaneously. Additionally, transcriptome-wide association study (TWAS) was utilized to determine the traits linked to the identified circulating genes. Created in BioRender. Han, Z. (2024) https://BioRender.com/w23u490.
Data sources
In this study, we used GWAS summary-level data from three databases, including brain IDPs, PD, and circulating gene cis-eQTLs. The eQTL data were obtained from the eQTLGen Consortium15, which includes 31,684 individuals and provides summary statistics for 19,960 circulating genes (p-value < 5e-8). This dataset, comprising 37 studies, is one of the largest available for circulating gene cis-QTLs.
For brain IDPs, data were sourced the Oxford Brain Imaging Genetics Server, which contains GWAS results for nearly 4000 IDPs in multimodal brain imaging from the UK Biobank, with data from ~33,000 individuals16. This data set have undergone quality control and confounding adjustment, represent the largest and most comprehensive MRI dataset currently available. The brain IDPs encompass a total of 17 categories, including measures like resting-state functional magnetic resonance imaging connectivity (rfMRIc, 1701), regional and tissue volume (RTV, 647), cortical area (CA, 372), cortical thickness (CT, 306), white matter tract mean diffusivity (MD, 300), rfMRI node amplitude (rfMRIna, 76), and each of WM tract Fractional Anisotropy (FA) / Intracellular Volume Fraction (ICVF) / Isotropic volume fraction (ISOVF) / Mode of Anisotropy (MO) / Orientation Dispersion (OD) (75), cortical gray-white contrast (CGWC, 70), regional and tissue intensity (RTI, 41), QC and tfMRI activation (tfMRIa) both have 16, regional T2* (RT2*, 14), and white matter hyperintensity volume (WMHV, 1).
The PD summary statistics was downloaded from the GWAS Catalog17 (GCST009324). This study18 involves 27,693 individuals, including 15,056 cases and 12,637 controls.
All three datasets derived from European populations. This consistency could eliminate potential confounding factors raised from population structure.
SMR analysis
By integrating GWAS and eQTL summary statistics, SMR uses genetic variants as instrumental variables to test for pleiotropic effects, assessing whether the association between a genetic variant and a trait is mediated by gene expression12. It also includes the Heterogeneity in Dependent Instruments (HEIDI) test to account for potential pleiotropy, ensuring that variant affect both gene expression and the trait through the same pathway. In this study, SMR (V1.3.1) was used to explore the causal relationship between circulating genes, brain IDPs, and PD. The ‘–bfile’ option reads individual-level single nucleotide polymorphism (SNP) genotype data (in PLINK binary format) from a reference sample for LD estimation, including .bed, .bim, and .fam files. The reference genome used was from the 1000 Genomes Project (European population), based on GRCh37. ‘–gwas-summary’ reads summary-level data from PD GWAS, ‘–beqtl-summary’ reads summary-level data from a circulating genes eQTL study in binary format. The maximum proportion of SNPs with an allele frequency quality control (QC) threshold of 0.2 and the maximum proportion of allowed allele frequency differences was 0.05. In the analysis of circulating genes and brain IDPs, we adjusted the SMR p–value using the Benjamini–Hochberg method, padj < 0.05 were considered to be significant (Supplementary Table 1). For the association between circulating genes and PD, SMR p–value < 0.05 were considered significant (Supplementary Table 1). All results with heterogeneity (HEIDI p-value > 0.05) were excluded.
Genetic correlation analysis
LDSC provides a framework to estimate the genetic architecture of complex traits using summary-level data from GWAS, the core principle is to regress the GWAS results on linkage disequilibrium (LD) scores to estimate heritability and genetic correlation between traits11. In this study, we used LDSC software (V1.0.1) to explore which brain IDPs are genetically correlated with PD. The reference LD scores are from the 1000 Genomes Project European data based on the GRCh37 version19. The ‘munge_sumstats.py’ was used to convert the summary statistics to LDSC format, then the genetic correlation analysis was performed between the two traits using the ‘ldsc.py’, with all parameters were set as default values. Genetic correlation was considered significant at p-value < 0.05, with ‘rg’ denoting the genetic correlation coefficient.
Colocalization analysis
Co-localization analysis is a statistical approach used to determine whether two traits share a common genetic basis at a particular genomic locus. This analysis is especially valuable in identifying genetic regions where traits like disease risk and gene expression overlap, indicating a potential causal relationship14. It reports four posterior probabilities: PP.H0, where both phenotypes 1 and 2 show no significant association with any SNP in a genomic region; PP.H1/H2, where either phenotype 1 or phenotype 2 is significantly associated with SNPs in a genomic region; PP.H3, where both phenotypes 1 and 2 are significantly associated with SNPs in a genomic region, but driven by different causal variants; and PP.H4, where both phenotypes 1 and 2 are significantly associated with SNPs in the same genomic region, driven by the same causal variant.
In this study, we performed co-localization analysis using the R package coloc (V5.2.3)20 to determine whether brain IDPs share the same causal variants with circulating genes, with input data formatted to include SNP positions, beta values, variance of the beta values, minor allele frequency, and sample size. we selected ‘quant’ as the ‘type’ option as both the circulating genes and IDPs were not binary traits. Colocalization was considered significant with PPH4 > 0.80, indicating that both traits are driven by the same causal variant within a ± 500 kb region.
TWAS analysis
TWAS investigates the association between gene expression and diseases or phenotypes by integrating transcriptomic data with genetic association data21,22. In this study, we utilized TWAS Atlas23 to explore the circulating genes of interest. TWAS Atlas integrated trait-associated transcriptomic signals from previous studies and constructed a TWAS knowledge graph to provide a reliable and practical resource.
Gene association network construction
We used STRING, a database of known and predicted protein–protein interactions24, to construct a gene interaction network for the colocalized circulating genes we identified. The results were visualized using Cytoscape software (V3.7.2).
Gene function enrichment analysis
Gene Ontology (GO), Kyoto Encyclopedia of Genes and Genomes (KEGG), and Human Phenotype Ontology (HPO) enrichment analyzes were performed for selected circulating genes using WebGestalt25 to explore their possible involvement in functional regulation. Results with padj < 0.05 were considered statistically significant.
Ethical statement
This study uses data exclusively from publicly accessible databases, ensuring that all datasets are openly available and free from ethical concerns associated with personal or confidential information. Consequently, no additional ethical approval is required for the analysis conducted in this research.
Results
Effects of circulating genes on 3935 brain IDPs
To investigate the associations between the circulating genes and 17 category brain IDPs, we conducted an SMR analysis using 19,960 cis-circulating genes and 3935 IDPs. As a result, 4037 circulating genes were found to be causally associated with 1834 unique brain IDPs (Fig. 2A, Supplementary Table 1). Notably, the greatest number of gene-IDP pairs was found in MD IDPs (11,126), followed by 7796 in RTV IDPs. Further HPO enrichment analysis of those genes associated with MD IDPs revealed their relevance to neurodegenerative diseases (ND) related symptoms, such as muscle weakness, abnormal muscle physiology, and26. In addition, Immune signaling pathways in GO and insulin signaling pathways and islet resistance in KEGG were also enriched. Those pathways have been implicated in PD development27,28 (Fig. 2B).
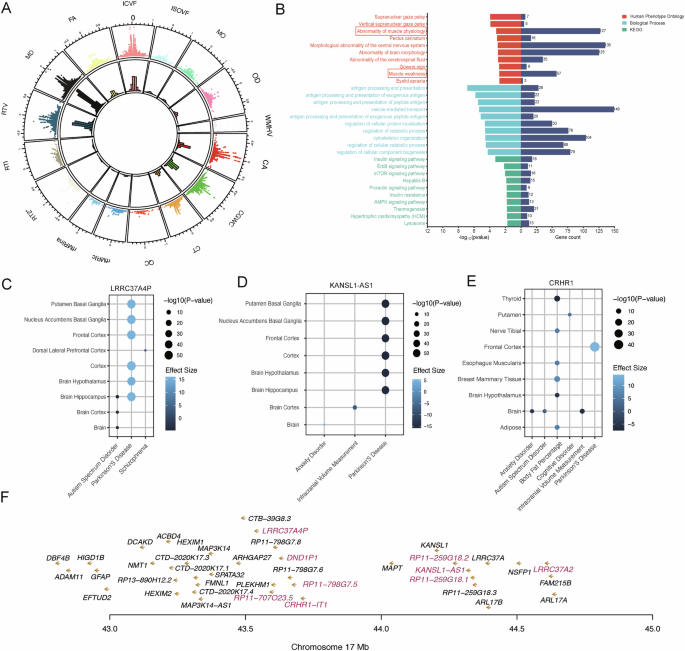
A Mendelian randomization analysis for circulating genes and 3935 brain IDPs. In the scatter plot on the outer ring, the x-axis represents the gene effect on brain IDP (β value), and the y-axis represents −log10 (padj) (all displayed points have padj greater than 0.05). Each point represents a causal relationship between a circulating gene and a IDP. The inner ring’s bar chart represents the density of points, with different colors indicating different types of brain IDPs. B Three different gene functional enrichment analyzes are depicted, with the y-axis representing pathways. The x-axis is divided into two parts, with the significance of enrichment results on the left and the number of genes falling within each pathway on the right. C–E The TWAS results are presented in a bubble plot, with the x-axis representing the mapping trait and the y-axis representing the tissue. The bubble color indicates effect size, while the bubble size reflects significance. F Magenta indicates the physical locations of the cis-regulatory sites associated with the top nine circulating genes that are causally linked to the highest number of MD IDPs.
Among the top 10 circulating genes most significantly associated with MD IDPs, six of them are non-coding genes. LRRC37A4P, KANSL1-AS1, and CRHR1-IT1, were associated with 171, 160, and 153 MD IDPs, respectively, and causally linked to 661, 649, and 514 brain IDPs overall. Notably, LRRC37A4P (β =15.7, p-value = 1.23E-55) and KANSL1-AS1 (β = −15.3, p-value = 1.13E-52) were directly associated with PD in TWAS (Fig. 2C, D). CRHR1-IT1 as a non-coding gene of CRHR1 may be equally associated with PD (Fig. 2E). Importantly, those findings were consistent with their correspondence with βICVF as shown in SMR analysis (βLRRC37A4P > 0, βCRHR1-IT1 < 0). While the three remaining non-coding genes RP11-259G18.1, RP11-707O23.5, and RP11-259G18.2 are pseudogenes, with RP11-259G18.1 has been proven to be associated with a variety of psychiatric disorders, such as schizophrenia29, autism29, and anxiety disorders30. It’s noteworthy that those non-coding genes were all located within the Chr17:43-45 Mb region (Fig. 2F).
Effects of circulating genes on PD
PD is an inheritable ND31 influenced by both single-gene mutations and multiple genetic factors32. Through SMR analysis, we identified 886 circulating genes that are causally associated with PD (p–value_SMR < 0.05, p–value_ HEIDI > 0.05, Fig. 3A, B, Supplementary Table 1). Functional enrichment analysis of these genes indicated their significant involvement in nucleotide metabolism and repair (p < 0.01, Fig. 3C). Additionally, TWAS analysis identified two genes—EIF3CL (p-value = 8.28E-06, β = −4.46) and RANGAP1 (p-value = 3.54E-05, β = 4.14)—within the RNA transport pathway (Fig. 3C were associated with PD in various brain regions (Fig. 3D, E). In the context of nucleotide excision repair and purine metabolism (Fig. 3C), two genes ERCC2 (p-value < 1E-10, β > 4.69) and DGUOK (p-value = 2.18E-05, β = 1.28) were also found to be associated with Alzheimer’s disease (Fig. 3F, G).
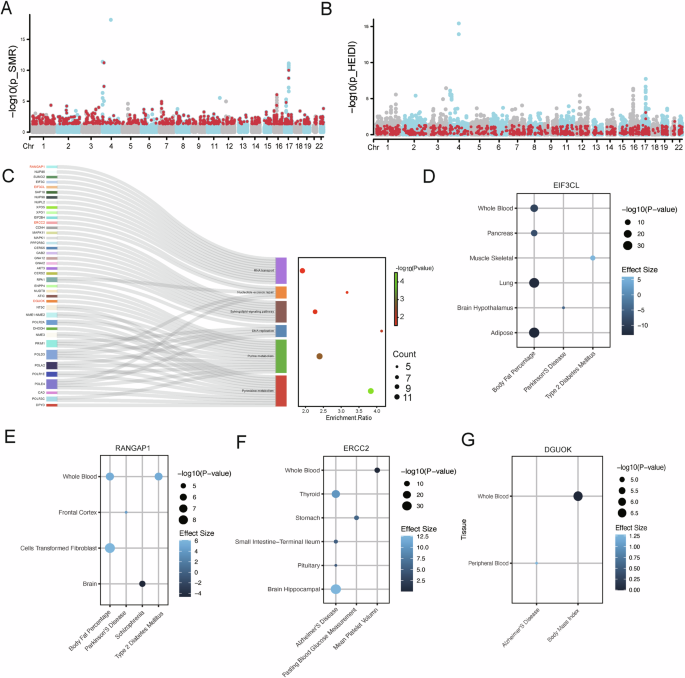
A Identification of the PD associated genes based on SMR p-values. The x-axis represents the chromosomal physical positions of the top cis-eQTL genes in the blood, and the y-axis denotes −log10(p_SMR). Genes meeting the criterion p_SMR < 0.05 are represented by red points. B Identification of the PD associated genes based on SMR heterogeneity. The red points represent circulatory genes’ top cis-eQTLs that only satisfy p_HEIDI > 0.05. C The Sankey diagram illustrates the gene enrichment within pathways, showing the connections between genes and pathways. The bubble chart displays the enrichment ratio, gene count, and significance for each enriched pathway. D–G The TWAS results are presented in a bubble plot, with the x-axis representing the mapping trait and the y-axis representing the tissue. The bubble color indicates effect size, while the bubble size reflects significance.
Genetic correlation between PD and brain IDPs
To further investigate the genetic links between PD and brain IDPs, we conducted LDSC analysis11 and identified a total of 200 brain IDPs that were significantly genetically correlated with PD (p-value < 0.05, Fig. 4A). most of them belonged to RTV (25%), rfMRIc (21%), MD (21%), and ICVF (11%) categories (Fig. 4B). A Hypergeometric test further confirmed a significant overrepresentation of certain IDP categories, particularly MD (Hypergeometric test p–value = 4.5e-10) and ICVF (Hypergeometric test p–value = 5.29e-12) (Fig. 4C). Interestingly, PD was negatively correlated with MD IDPs and positively correlated with ICVF IDPs (Fig. 4A). MD and ICVF, as indicators of white matter structure, have been shown in previous study to be closely associated with the onset and progression of PD due to white matter abnormalities33.
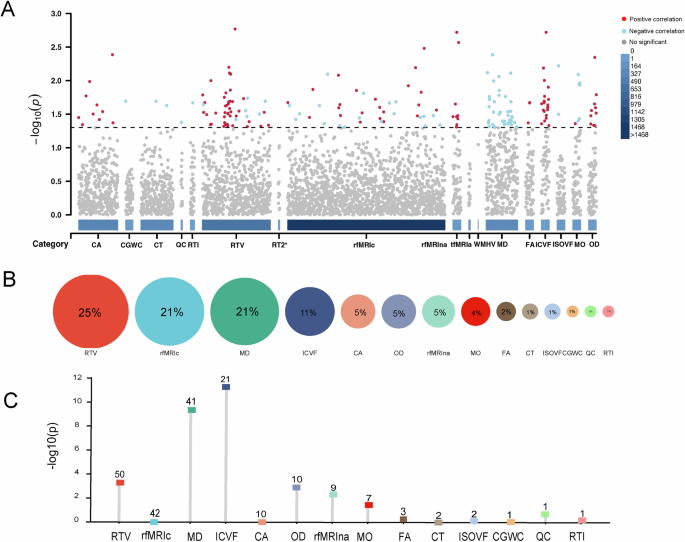
A Manhattan plot illustrates the genetic correlations between PD and 3935 IDPs. The x-axis represents the categories of IDPs, while the y-axis represents the significance of the correlation. Each point represents the correlation result between PD and a brain IDP, with red indicating a positive correlation, blue indicating a negative correlation, and gray indicating no significant correlation between them. B The proportion of different categories of IDPs genetically correlated with PD. The size of the circles represents the proportion. C The bar chart shows the enrichment significance of different categories of IDPs. The numbers within the squares indicate the respective counts of different IDPs that are significantly genetically correlated with PD, and the y-axis represents the -log10(p) values from the hypergeometric distribution test.
Identification of circulating genes associated with PD and linked to IDPs
Through the integration of SMR and genetic correlation results, we identified 106 circulating genes that were causally linked to both 96 brain IDPs and PD (Fig. 5). These genes were enriched in pathways related to insulin resistance, insulin signaling, and neurotrophin signaling (Fig. 6A), all of which are relevant to PD pathophysiology34.
Created in BioRender. Han, Z. (2024) https://BioRender.com/e51v735.
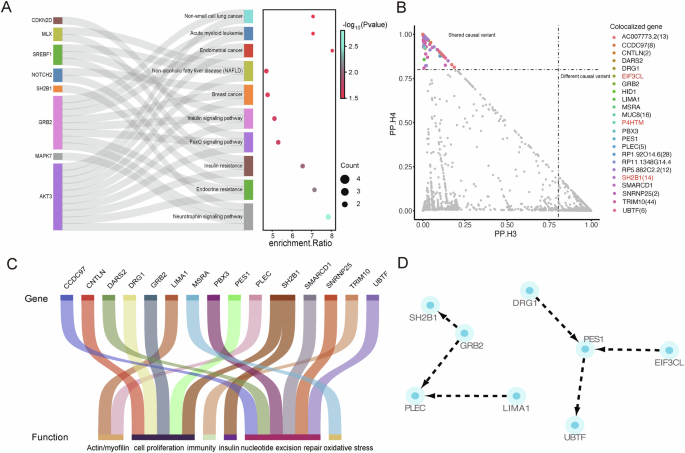
A KEGG pathway enrichment analysis of 106 co-localized circulating genes, the sankey diagram showing the connections between genes and pathways, the bubble chart displays the enrichment ratio, gene count, and significance for each enriched pathway. B The co-localization results of 106 circulating genes with 142 brain imaging-derived phenotypes are depicted, with the horizontal axis representing PP.H3 probability and the vertical axis representing PP.H4 probability. C Functional classification of circulating genes. D The network of associations among the co-localized circulating genes.
Among 106 genes, 23 circulating genes were co-localized with 71 brain IDPs (PP.H4 > 0.8) (Fig. 6B, Table 1), with SH2B1 colocalizing with 14 brain IDPs. Meanwhile, TWAS analysis revealed that SH2B1 was associated with PD in the frontal cortex and was implicated in various diseases, including type 2 diabetes mellitus (Table 1). SH2B1 was also involved in the neurotrophin signaling pathway (Fig. 6A). Other genes like GRB2 was involved in both islet and the neurotrophin signaling pathway (Fig. 6A), and linked to body mass index in whole blood by TWAS (Table 1), which have confirmed related to the prevalence of PD35,36. Additionally, genes such as EIF3CL and P4HTM were also showed strong associations with PD (Table 1). Notably, TRIM10 was co-localized with nearly 48% of the 71 IDPs, and although it was not shown to be directly associated with PD in TWAS analysis, it has been linked to body fat percentage, multiple sclerosis, and systemic lupus erythematosus (Table 1). The association of PD formation with autoimmunity37,38 and lipoproteins39,40 has been demonstrated by several studies.
In addition, we searched biological open-access databases such as GeneCards41, NCBI, and UniProtKB42 for the remaining co-localized genes. Interestingly, aside from the non-coding genes RP1-92O14.6, RP11-1348G14.4, RP5-882C2.2, and AC007773.2, as well as the protein-coding genes HID1 and MUC8, which are currently under-researched, the other genes are related to factors involved in PD development. These include motor dysfunction/muscle atrophy (PLEC, LIMA1), oxidative stress (MSRA), nucleotide excision repair (CCDC97, PBX3, SMARCD1, SNRNP25, UBTF, DARS2), cell proliferation (CNTLN, GRB2, DRG1, PES1), and immunity (TRIM10) (Fig. 6C). Meanwhile, we used STRING to investigate whether there is an interaction network among these 23 genes (Fig. 6D) and found that, aside from the genes previously identified as participating in the same pathway, PES1 occupies a central position among DRG1, EIF3CL, and UBTF. Although the TWAS analysis did not show any results for PES1 and DRG1, the direct association of EIF3CL with PD and the correlation of UBTF with body mass index suggest a potential link between PES1 and PD.
Discussion
Clinical observational studies and extensive genetic analyzes have consistently confirmed the hereditary nature of PD and its association with brain structure43. However, due to the complex influence of environmental and genetic factors on PD onset, coupled with inherent individual variations in brain structure, understanding these relationships has become increasingly complex.
Our study demonstrated a significant genetic correlation between PD and white matter integrity, particularly a negative correlation with MD and a positive correlation with ICVF. MD refers to the average rate of water diffusion in tissue, provides important insights into the microstructural integrity of white matter. Increased MD is typically associated with tissue degeneration or the loss of cellular structure in specific brain regions44. Changes in MD have been observed in PD patients in a heterogeneous manner, with lower MD found in motor pathways shortly after diagnosis, whereas higher MD is observed in frontal, temporal, and callosal regions in more advanced stages of the disease45,46,47. The reduced MD often linked to compensatory changes in PD, which has been showing increases in white matter fiber density early in the disorder47. On the other hand, ICVF represents the proportion of tissue volume occupied by cells, such as neurons and glial cells, offering insights into cellular integrity. In early stages of PD, ICVF was observed elevated, and this may reflect adaptive changes, such as increased dendritic or axonal density, as the brain attempts to compensate for neuronal loss48,49. Thus, our results suggest that individuals with lower MD and higher ICVF may have a higher risk for developing early-stage PD.
The genetic correlations between PD and MD IDPs were also evidenced in molecular level, as the circulating genes that exhibit a causal relationship with MD IDPs also indicated a significant link to PD-related symptoms (Fig. 2B). Moreover, the top associated genes, including noncoding genes LRRC37A4P, KANSL1-AS1, CRHR1-IT1, P11-259G18.1, RP11-707O23.5, and RP11-259G18.2, were all clustered around Chr17:44 ± 1 Mb, a genomic region previously associated with PD18, Alzheimer’s disease50, and lipoproteins, especially high-density lipoprotein51 and very low-density lipoprotein52. Dysregulation of lipoproteins can adversely impact white matter integrity in the brain, as these molecules play a critical role in maintaining myelin sheaths53, which in turn influence the progression and severity of PD. Therefore, we speculate that these non-coding genes may influence white matter by regulating the expression of lipoprotein-related genes54,55, ultimately contributing to the regulation of PD.
Our results indicated that insulin signaling/resistance pathway significantly involved in modulating both white matter damage and PD progression. This pathway is closely linked to neurodegenerative processes in PD, particularly in the context of mitochondrial dysfunction and oxidative stress56,57. Moreover, research suggests that impaired insulin signaling in the brain can exacerbate white matter damage, thereby accelerating PD progression by increasing neuroinflammation and neuronal dysfunction58,59, Additionally, we observed that genes associated with PD are significantly enriched in pathways related to nucleotide metabolism and DNA repair. Beyond dopaminergic neurons, DNA damage in other neuronal populations appears to be a crucial factor in the development of PD60, and a recent study also found that PD patients display a DNA damage signature in blood which could serve as a predictive biomarker for disease progression61, particularly for genes identified from the TWAS analysis. Notable genes within this DNA damage-related profile include EIF3CL, RANGAP1, ERCC2, and DGUOK (Fig. 3D–G).
By integrating multiple genetic analyzes, we ultimately identified 23 circulating genes that were associated with genetically correlated PD-IDP pairs. Consistently, those genes were involved in insulin singling (SH2B1, GRB2) and nucleotide excision repair (CCDC97, PBX3, SMARCD1, SNRNP25, UBTF, DARS2) pathways. SH2B1 co-localizes within multiple IDPs that are genetically connected to PD. SH2B1 is an adapter protein that enhances insulin receptor signaling by binding to the insulin receptor62. It plays a role in regulating body weight, glucose metabolism, and neuronal survival63. GRB2 (Growth factor receptor-bound protein 2) is another adapter protein that connects activated insulin receptors to downstream signaling pathways, such as the mitogen activated protein kinase pathway64. This pathway is important for cell growth, differentiation, and survival, which are critical for maintaining the health of neurons65. Thus, alterations in SH2B1 and GRB2 can disrupt insulin signaling, which may contribute to PD through mechanisms such as impaired energy metabolism, oxidative stress, neuroinflammation, and neuronal death.
In addition, those genes were also involved in regulating pathways including immunity (TRIM10), oxidative stress (MSRA), motor dysfunction/muscle atrophy (PLEC, LIMA1), and cell proliferation (CNTLN, GRB2, DRG1, PES1), which have been implicated PD pathology66,67,68. Notably, TRIM10 shares a common genetic variant site with 44 IDPs. The variant p.R65H in TRIM10 has been nominally associated with PD at the allelic level. TRIM10 is part of the tripartite motif family involved in immune responses69. Dysregulation could lead to chronic neuroinflammation, which is implicated in PD pathology70. MSRA encodes methionine sulfoxide reductase, an enzyme that repairs oxidatively damaged proteins71. Insufficient MSRA activity may lead to an accumulation of oxidative damage, increasing neuronal vulnerability in PD. PLEC encodes plectin, a protein essential for muscle fiber integrity71, while LIMA1 is involved in actin-binding, crucial for muscle structure and function72. Alterations in these genes could exacerbate muscle weakness and atrophy, worsening PD symptoms71.
Notably, all the candidate genes identified in our analysis are cis-regulated in blood. cis-eQTLs typically exhibit larger effect sizes, implying even minor genomic variations can lead to significant changes in gene expression73. The close physical proximity of cis-regulated genes to their regulatory elements minimizes c the impact of other genes or environmental confounders, offering a distinct advantage for therapeutic drug development74. Moreover, clinical blood tests may also provide serve an effective approach for assessing an individual’s genetic susceptibility to PD. For instance, the A/A genotype of SH2B1, as shown in the GTEx database75, demonstrates the highest expression levels in both blood (gene expression fold change log2FC = 2.86) and brain tissues (gene expression fold change log2FC = 1.14), with a beta value of 0.96, highlighting its association with PD.
However, our study has some limitations. First, the data used in our analysis were exclusively from European populations, which may limit the generalizability of our findings to other populations. Second, we did not apply multiple test corrections for LDSC and SMR analyzes, which could potentially lead to false positives. To address this, we employed a hypergeometric test to evaluate the overall genetic correlations between PD and IDP categories, ensuring that the associations were not merely due to the random chance. In addition, we also utilized TWAS and co-localization methods to further refine the list of candidate genes generated from the SMR analysis. Despite these efforts, further research in diverse populations and functional validation of the identified genes are still necessary.
In conclusion, our study revealed strong genetic correlations between PD and white matter IDPs, particularly MD and ICVF, and identified key driving genes. This research bridges the gap between molecular genetics, neuroimaging, and PD pathology, highlighting potential biomarkers for earlier accurate diagnosis and improved monitoring of disease progression.


Responses