Genome data based deep learning identified new genes predicting pharmacological treatment response of attention deficit hyperactivity disorder

Introduction
Attention deficit hyperactivity disorder (ADHD) is a highly prevalent and debilitating condition that affects individuals across the lifespan. Pharmacological treatment is often recommended as a key component of ADHD management [1, 2]. Although both stimulants methylphenidate (MPH) and non-stimulants atomoxetine (ATX) could reduce clinical symptoms of children with ADHD, the responses to medication vary widely among individuals. Nearly 30–40% of children with ADHD show poor response to stimulants and a higher proportion for non-stimulants [3, 4]. Therefore, identifying factors that contribute to treatment response may help clinicians tailor treatment to the individual patient and reduce unnecessary side effects, potentially enhancing treatment compliance and improving outcomes and quality of life [5].
ADHD is highly heritable, with a heritability between 70–80% [6], which suggested that Identifying genetic factors associated with pharmacological response in ADHD could shed light on the underlying neurobiological mechanisms of the condition [5]. Previous candidate gene-based studies showed that ADHD treatment responses were probably regulated by genes involved in neurotransmitter system [7], including dopamine pathway (DRD4, SLC6A3), norepinephrine pathway (SLC6A2, ADRA2A), and catecholamines metabolism (COMT); and cytochrome P450 isoenzyme [8, 9], including CYP2D6 and CES1. On the other hand, polygenetic risk scores (PRSs) based on our Han Chinese ADHD genome-wide association study (GWAS) only explained 2% variance of medication response [10]. Hegvik and his colleagues concluded that ADHD drugs might act on different mechanisms other than the etiology of ADHD [11].
For complex traits, such as medication response, association signals tend to spread across the genome, emphasizing the importance of genome-wide study [12]. A GWAS from Denmark, which utilized “switching medications from methylphenidate” as a phenotype, reported significant SNPs [13]. However, it’s hard to speculate whether ADHD patients discontinued or switched from stimulants due to poor response or other reasons.
While GWAS has significantly enhanced our knowledge of the genetic basis of complex traits, it also has inherent limitations, as “significant SNPs” often explain only a small fraction of the underlying complexity [12, 14]. Thus, considering the aforementioned findings, machine learning (ML) has the potential to further contribute to our understanding. ML models have shown promise in predicting ADHD treatment response using clinical information [15]. In other psychiatric disorders, such as Alzheimer’s disease, ML models have been successful in identifying new gene targets [16]. Moreover, deep learning (DL) models have demonstrated good performance in ADHD diagnosis and have the ability to capture nominal SNPs that may have been overlooked by GWAS studies [17].
In summary, previous studies have emphasized the genetic underpinnings of ADHD treatment response, particularly using candidate genes in neurotransmitter and drug metabolism systems. However, the limitations of candidate gene-based approaches necessitate a transition to GWAS and ML methodologies. GWAS provides a comprehensive genome-wide perspective, meanwhile ML models have the potential to complement GWAS findings and build clinic-informative prediction models.
Based on the above background, the current study aims to achieve two objectives: Firstly, identify SNPs associated with ADHD pharmacological treatment response using GWAS; secondly, develop a DL model to predict treatment response based on genomic data, validate the model using an independent dataset, and interpret the trained model to identify relevant SNPs. By combining GWAS and DL approaches, we hope to advance our understanding of ADHD treatment response and its underlying genetic architecture.
Patients and methods
Study population
Subject recruitment
Dataset 1 (discovery/training & validation set)
Dataset 1 was used in the GWAS analysis as well as training and validating the deep learning models. Two hundred and forty-one children with ADHD are included in this set and are from a previous clinical study conducted by our team between 2001 and 2010. The details about the inclusion and exclusion criteria for these participants can see our previous publications [10, 18].
Dataset 2 (replication/testing set)
This dataset was used to test the DL model. Sixty-four children with ADHD are included in this set, and part of the subjects overlapped with the subjects of our previous publication and can found the recruitment details [19].
Detailed procedure was shown in Fig. 1. The study was approved by the Institutional Review Board of the Peking University Health Science Center (2010–19; 2018–21). After complete description of the study to the subjects, written informed consent was obtained from parents of the ADHD individuals. The current research was registered in ClinicalTrials.gov (NCT01065259).

Study flow of the current research.
Treatment and efficacy evaluation
After baseline evaluation and blood collecting (T0), all the participants accepted open-label treatment with either intermediate-release MPH (Ritalin), oral osmotic MPH (OROS MPH, Concentra), or ATX (Strattera) for 8–12 weeks. All participants in the independent testing set accepted the pharmacological treatment under a naturalistic circumstance after baseline evaluation. In this part, the medication (OROS MPH or ATX) was chosen based on a discussion between the clinical child psychiatrist and parents. The details about titration process can be found in Fu et al. [19]. After standardized titration and maintenance treatment, the clinical symptoms of the subjects were evaluated again (T1), usually 12 weeks after initial treatment. The clinical symptoms were evaluated by parent-rated ADHD-rating scale (ADHD-RS) [20, 21], with each item on a four-grade scale of 0–3. The change rate of ADHD-RS score between follow up (T1) and baseline (T0) was adopted to evaluate the efficacy of the pharmacological treatment as following.
(The Score in this equation means parent-rated ADHD-RS overall score)
The current study classified participants into responders and non-responders based on a threshold of 25% [22], defined robust and not robust responders using 40% as threshold [23, 24].
Genetic analyses
Genotyping
The samples in dataset 1 were genotyped using the Affymetrix6.0 array from CapitalBio Ltd. (Beijing, China) following the standard Affymetrix protocol. The Affymetrix6.0 array consisted of 906,600 probes targeting single nucleotide polymorphisms (SNPs).
For quality control (QC), the current study implemented the following procedures: (1) Individuals with per-individual autosomal heterozygosity >3 SD larger than the mean, without age or sex information, or with a per-individual call rate <98% were excluded; (2) the SNPs with low call rate (<95%), significant deviation from Hardy–Weinberg equilibrium (P < 1e–04), or a minor allele frequency (MAF) lower than 5% were excluded. After quality control, 241 samples with 516,369 SNPs remained for subsequent analysis.
The dataset 2 was genotyped using different array, i.e., the InfiniumPsychArray-24 array by CapitalBio Ltd. (Beijing). Considering these two arrays covered different sets of SNPs, we performed pre-phase and imputation after QC in dataset 2 to cover as many SNPs detected by dataset 1 as possible. Finally, 64 samples and 2,727,614 variants were included.
GWAS analysis
The association study between SNPs and the pharmacological treatment outcomes (percentage changes of ADHD-RS) was conducted using the additive linear regression model implemented in PLINK version 1.9, controlling age, sex, and IQ as covariates [25,26,27]. The genome-wide significant threshold was set as 1E-08.
To fully assess the confounding effects of different medications, MPH and ATX, we performed GWAS separately for each medication, and utilized interaction analyses and Cochrane’s Q test to determine the potential heterogeneity across these medications.
Gene-based and pathway-based analyses
Gene-level and pathway-level analyses were implemented by Multi-marker Analysis of GenoMic Annotation (MAGMA 1.05) with the GWAS summary statistics [28]. MAGMA assigned SNPs to genes based on the NCBI 37.3 definitions, and generated gene-level P-values using a SNP-wise mean model in which the sum of –log (SNP P-value) is used as a test statistic, then calculated gene P-value using a known approximation of the sampling distribution. 1000 Genomes Project Phase 3 Asian samples were used as reference for correcting LD [29]. After SNP annotation, there were 13,157 genes that were covered by at least one SNP. To account for multiple testing, a Bonferroni correction was applied, with a significance threshold set at 3.80E-06.
We used Hi-C coupled MAGMA (H-MAGMA) [30], an analytic tool based on MAGMA which assigns noncoding SNPs to cognate genes based on the chromatin interaction profiles; and assigns exonic and promoter SNPs based on physical position. Five Hi-C datasets were used (Adult dorsolateral prefrontal cortex, fetal paracentral cortex, iPSC-derived astrocyte cells, cortical neuron, midbrain dopaminergic system) [12, 31,32,33,34,35,36]. Bonferroni method was applied for multiple testing.
After obtaining gene-based P values, enrichment of association signals in genes belonging to specific biological pathways or processes were tested. In the current study, we used the gene sets identified by Biological Pathways in the Gene-ontology (GO) datasets (Num of gene sets = 7300, Bonferroni corrected P = 6.85E-06) [37, 38].
Mapping risk genes and enrichment analyses
To link variants to potential genes, three methods for gene mapping were leveraged: positional mapping, eQTL mapping, and chromatin interaction mapping. For positional mapping, we used a maximum distance of 10 kb. The eQTL data and chromatin interaction data were utilized to identify genes through the implementation of FUMA [39] (details of the datasets utilized in this study can be found in the Supplementary materials).
To gain further insights into the biological implications, enrichment analyses were performed using the over-representation analysis in WebGestalt [40, 41], utilizing four datasets (GO, KEGG, DisGeNET, and GLAD4U) [37, 38, 42,43,44]. Phenome-wide association analyses (PheWAS) were performed for top genes using GWAS-ATLAS [45]. These analyses aimed to identify any significant enrichment of gene sets or functional categories associated with the identified variants.
DL model
Feature selection using GWAS p-value
SNPs were chosen based on the GWAS analysis described above. Four different P value thresholds were applied: P < 1E-02 (NSNP = 5516); P < 1E-03 (NSNP = 1055); P < 1E-04 NSNP = 282; P < 1E-05 NSNP = 99). The SNPs were input into the DL models following the location orders.
DL model training
We trained and evaluated four types of prediction DL models each: Convolutional neural networks (CNN), Long-short term memory (LSTM), CNN+LSTM, and Dense neural network (DNN) with training, validation, and test datasets, using four sets of SNPs selected by GWAS P-value which was described above as inputs. Similar to GWAS analysis, the change rates of ADHD-RS scores were used as predicted phenotype. We also compared the performance between our DL model and machine learning models, including Support Vector Regression (SVR) and the Random Forest (RF) model. All the codes were implemented using python with Keras and scikit-learn [46,47,48].
Each SNP was encoded to represent the number of major alleles (A) it contains, resulting into a one-dimensional vector (n × 1) with values of 1 (aa), 2 (Aa), 3 (AA), or 0 (missing). For CNN and CNN-LSTM model, we further transformed the (n ×1) vector to a (n × 4) one-hot vector representation, i.e., aa to (1, 0, 0, 0), Aa to (0, 1, 0, 0), AA to (0, 0, 1, 0), NA to (0, 0, 0, 1).
The samples were randomly divided into a training set (85%) and a validation set (15%). All the DL models were initialized using the Xavier method [49]; the mean squared loss (MSE) was employed as loss function [50]. For activation functions, the hidden layers were activated by the Rectified Linear Unit (ReLU), while the Sigmoid function was applied in the output layer. To further evaluate the performance of DL models in classification tasks, we assessed accuracy, sensitivity, and specificity metrics, using a 25% change in ADHD-RS scores as the threshold to distinguish between responders and non-responders.
The “Weights and biases” (Wandb) platform was used for hyperparameter tuning [51]. Sweeps with 200 runs was performed using a “random” strategy for every DL model, and the model with lowest validation loss was selected as the best.
According to the “sweep” results, A CNN model using E2 SNP-set as inputs outperformed other models. The hyperparameters were chosen as follows: Batch size = 64; Adam method for optimize [52]; learning rate = 1 × 10⁻²; 600 epochs; dropout layers with a dropout rate of 0.5; two convolutional layers both with 64 neurons, kernel size = 3. (Details were shown in the supplementary file).
Interpretation of the DL model
We interpreted the model using DeepExplain package [53]. Contributions of each SNP to the trained model were calculated using “Saliency” method. Then, gene variants with top 300 saliency scores were manually checked and mapped to putative genes using the methods described above (Section “Mapping risk genes and enrichment analyses”).
Independent dataset: test the consistency of GWAS results and test the performance of DL models
To validate the GWAS findings and assess the performance of the DL model, an independent replication/test dataset consisting of 64 ADHD samples (dataset 2) was utilized. The recruitment and data quality control procedures for this dataset were identical to those of the discovery set, with the exception of the genotype procedure (Details see Section “Study population”).
Referring to a previous GWAS study, we evaluated the consistency of GWAS locus by (1) examining the direction and magnitude of effect sizes [54]. Concordance of direction was assessed using a one-sample test of the proportion with Yates’ continuity correction, with a null hypothesis of a proportion of 0.50. Linear regression analyses were performed to determine the relationship between effect sizes in the two datasets, with a significance threshold set at α < 0.05. (2) perform association tests within the significant genes detected by GWAS, Monte Carlo permutation test was used with 500 times permutation, setting significance threshold as 0.05.
We also compared our GWAS findings with the results from a previous study focusing on stimulant-dependence by Cox et al. [55], which included Western and African populations, to compare consistencies across diverse ethnic groups.
The dataset 2 was also utilized as an independent test dataset to evaluate the performance of the trained DL mode. Due to disparities in genotyping procedures, only a subset of SNPs could be included from dataset 2. In this study, there are 4099 out of 5516 SNPs (E-02), 770 out of 1055 SNPs (E-03), 215 out of 282 SNPs (E-04), and 69 out of 99 SNPs (E-05) were included by dataset 2 for model testing, with any uncovered SNPs coded as ‘NA’.
Results
Demographic characteristics
As mentioned above (Section “Study population”), the current study leveraged two datasets (Table 1). The first dataset comprised 241 samples (39 girls and 202 boys), with a mean age of 9.16 years old (±2.14). In the current cohort, 130 samples comorbid with other psychiatric disorders (More details about comorbidity were shown in the Supplementary Table 1). The first dataset was used for GWAS analysis, training and validating the machine learning models. 169 (70%) participants were classified as responders (percentage changes >25%), 114 (49%) participants were robust responders (>40%).
The second data set comprised 64 samples (8 girls and 56 boys), with a mean age of 10.34 (±2.24). The second dataset was used for replication of GWAS results and testing the trained DL models. 43 (67%) individuals were responders, and 29 (44%) were classified as robust responders.
Genome-wide significant loci
Two SNPs surpassed the threshold for genome-wide significance (P < 1e-08, Fig. 2A, Table 2). The QQ plot is presented in Fig. 2B, with a genomic inflation factor of 1.00604, indicating a negligible influence of systematic bias on the obtained results. Notably, both loci maintained statistical significance even after adjustment using Genomic Control (PGC_adj < 1e-08). To assess the potential effects of comorbidities on our findings, we conducted supplementary analyses, incorporating comorbidity status as a covariate and separately analyzing data after removing participants with comorbid conditions. Both analyses consistently identified the significance of two loci (rs10880574 P = 3.28E-10, 3.54E-09; rs2000900 P = 3.35E-09, 1.30E-08), suggested no confounding effect of comorbidities on our results.
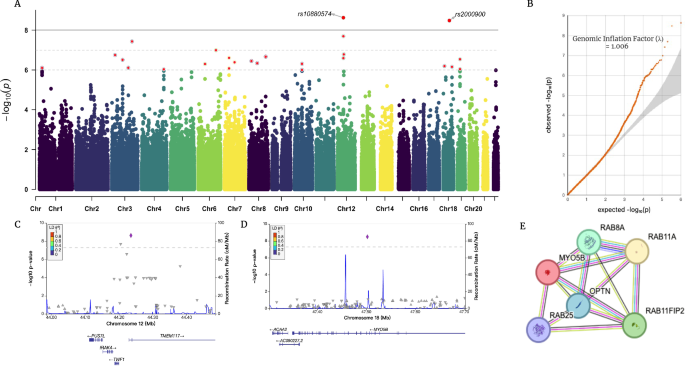
A Manhattan plot and B QQ plot of the current GWAS; C, D regional plots of two significant locus (rs10880574; rs2000900); E. PPI network of gene MYO5B.
The first locus is located on chromosome 12 (lead SNP: rs10880574, CHR12: 44235427 [GRCh37], P = 2.39E-09, beta = −0.5134, PGC_adj = 2.645E-09), located in the 5-prime UTR intron region of the gene TMEM117 (Transmembrane Protein 117). TMEM117 is a protein-coding gene, mainly expressed in the brain (LifeMap [56]). TMEM117 was involved in intrinsic apoptotic signaling pathway in response to endoplasmic reticulum stress, located in the endoplasmic reticulum and plasma membrane. Using GWAS catalog [57], we identified prior-reported associations between TMEM117 and electroencephalogram measurement and inflammatory bowel disease [58, 59]. Gene PUS7L (pseudouridine Synthase 7 Like) was identified as putative by eQTL data. Interestingly, gene PUS7L is also previously detected as responsible for both brain measurement and inflammatory bowel disease [59, 60].
The second locus is located on the chromosome 18 (lead SNP: rs2000900, CHR18:47502338, P = 3.31e-09, beta = −0.4648, PGC_adj = 3.664E-09). The nearest gene is MYO5B (Myosin 5 B), which is a protein-coding gene, involved in vesicular trafficking and is required in a complex with RAB11A and RAB11FIP2 for the transport of NPC1L1 to the plasma membrane, essential for several neural processes [61,62,63,64]. MYO5B is mainly expressed in digestive organs, including esophagus, minor salivary gland, colon, and intestine (GTEx) [65], as well as liver, and kidney (LifeMap). MYO5B was previously identified to be responsible for lipid metabolic processes, associated with several cholesterol measurements [66,67,68,69]. PheWAS results suggested that both TMEM117 and MYO5B were related to psychiatry and metabolism phenotypes (Pbon < 0.05), gene PUS7L potentially related to lipid metabolism (Supplementary Fig. 2).
To test the heterogenous effects between MPH and ATX, we separately performed GWAS for each medication and meta-analyzed them. The meta-analysis result confirmed two loci at P < 1E-06 level (rs10880574 P = 5.553E-08; rs2000900 P = 1.438E-07) (Supplementary Fig. 2). No significant heterogenous effects (P < 1E-05) between two medications were identified (Q = 0.0122, 0.0033), which were confirmed by interaction analyses (P = 0.06; 0.0163) (Supplementary Fig. 2).
Results identified rs10880574 and rs2000900 at P < 1E-06 level (P = 2.098E-07; 7.613E-08) in MPH GWAS (Supplementary Fig. 3). No SNP with P value less than 1E-06 was detected in ATX GWAS (rs10880574 P = 0.01439; rs2000900 P = 0.03735), which might suggest that the SNPs affected ATX responses to a smaller extent than MPH; and the more limited sample size of ATX (N = 80) might prevent us from identifying statistically significant loci.
Gene-based results
MAGMA identified the gene CTD-2561J22.3 (P = 3.67E-06; Pbon = 0.048; CHR19: 21587961-21674068) as significantly associated with ADHD pharmacological treatment (Supplementary Fig. 2). Nominal significance was identified for TMEM117 (P = 5.60E-05; Pbon = 0.737). Novel RNA gene ENSG00000226664 (P = 1.39E-06; Pbon = 0.0455) was tested using cortical neurons and iPSC-derived astrocytes based Hi-C data (Supplementary Fig. 3); gene ENSG00000222121 (P = 1.01E-07; Pbon = 0.0326) was suggested by Hi-C data in the fetal brain tissues (Supplementary Fig. 3).
Replication of the current GWAS results
We further tested the reliability of GWAS results by an independent dataset (dataset 2). Our results indicated some consistencies between two cohorts. A locus in TMEM117 was identified in the dataset 2 (12:44544253, rs117799886, Pperm = 0.036), which provide further validation of our GWAS results. Sign test suggested same direction of SNPs with a GWAS-P less than E-05 (P = 0.019, concordance rate = 0.833), however, SNPs under E-03 and E-04 threshold did not show significance (P = 0.19; P = 0.17, Supplementary Table 2).
Comparing with a previous GWAS results reported stimulant dependence associated loci [55], we found moderate consistencies. Specifically, we observed one SNP s61915073 (P = 7.35E-05, OR = 0.63, 12q12) with P-value less than 1E-04 locating within 500 kb of the current significant loci rs10880574; and five SNPs locating with P values less than 1E-03 (18q21.1) within the 250 kb of the loci rs2000900. Our results suggested there are consistencies of genetic background among different ethnic groups underlying stimulant associated response.
Deep learning prediction model
The CNN model using SNPs with GWAS-P value less than E-02 presented best performance (MSE = 0.043, 0.012, 0.081; Acc = 0.99, 0.83, 0.61; Sen = 1.0, 0.90, 0.81; Specificity = 0.98, 0.75, 0.26 in training, validation, and test datasets). The architecture of model was showed in the Fig. 3A, and the hyperparameters and architecture in other DL models were shown in Supplementary Table 2.
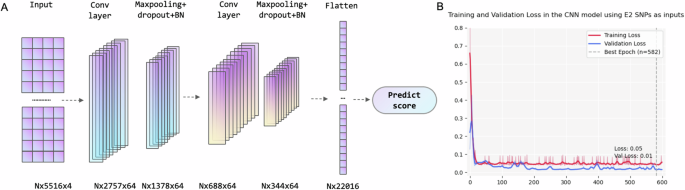
A architecture and B Training and validation loss of the E2-CNN model (N represents batch size).
Compared with other DL models and traditional machine learning method, our CNN model had a better performance (Table 3).
Interpret the DL model
The current study identified relevant variants through calculating saliency scores. Top 20 SNPs were shown in the Supplementary Table 4.
The variant contributed most to the DL model locate within the intronic region of the gene NKAIN2 (rs535492, 6:124863962, P = 0.00193), which is a brain-expressed gene associated with externalizing traits (ADHD, substance use disorder, and others [70]. NKAIN2 mainly expressed in multiple brain tissues, including substantial nigra; hippocampus; amygdala; anterior cingulate cortex; thalamus; cerebellum, and oligodendrocyte cells (GTE v8 & LifeMap). PheWAS analysis also indicated its involvement in both psychiatric disorder/cognitive functions and metabolic processes (Supplementary table 5 and Supplementary Fig. 5).
Then, FUMA was applied to explore the functional consequences of the top 300 SNPs, which lead to a total of 920 genes. Subsequent enrichment analysis was performed using WebGestalt.
The analyses based on GO Cellular Component (CC) terms suggested these genes were significantly enriched in the intrinsic component of plasma membrane (P = 1.92E-05; PFDR = 0.023). Analyses based on biological pathways (BP) and molecular function (MF) terms failed to show any significant results.
Analysis based on the GLAD4U database identified the phenotype Methamphetamine dependence (P = 1.78E-05; PFDR = 0.03) was significantly enriched in the mapped genes (Supplementary Fig. 5).
Discussion
Understanding the heterogeneity in pharmacological treatment response among individuals with ADHD has long been a challenging yet crucial issue in the field, as it holds significance for personalized treatment. Aiming to deepen our understanding of the underlying genetic basis by integrating genome data with innovative DL techniques, the current study revealed novel genes, including TMEM117, MYO5B, NKAIN2, PUS7L, and CTD-2561J22.3. Furthermore, we developed a CNN-based prediction model that demonstrated favorable performance in an independent test dataset, suggesting its potential utility in clinical settings. The current results contribute to advancing our knowledge of the genetic factors involved in ADHD treatment response and provide a basis for future individualized treatment.
In the current genome-wide analyses, we identified two significant loci, i.e., rs10880574 and rs2000900, located within the genes TMEM117 and MYO5B, respectively. The gene TMEM117 is primarily expressed in the brain, meanwhile, previous GWAS have linked TMEM117 to brain activity and digestive disorders [58, 59]. On the other hand, MYO5B is predominantly expressed in digestive organs, with its role in metabolic processes. GWAS have shown associations between MYO5B and various lipid and cholesterol measurements, such as total cholesterol, low-density lipoprotein, high-density lipoprotein, and apolipoprotein A1 [66,67,68,69]. Furthermore, we identified gene PUS7L as the target gene of rs10880574, which is also associated with brain measurement and digestive disorder [59, 60]. PheWAS results of TMEM117 and MYO5B suggested involvements in metabolism/nutrition and psychiatric disorders (Supplementary Fig. 1). Meanwhile, MYO5B was identified as related to schizophrenia in a Chinese sample and subsequently replicated in a later study [71, 72], which might be attributed to the essential role of MYO5B in BDNF/TrkB-induced dendritic branching and its involvement in various neurotransmitter circuits [62,63,64]. The PheWAS results suggested significant associations between MYO5B with lithium response in bipolar I patients, might support the possible role of this gene on psychopharmacological response (Supplementary Fig. 1). However, it also needs to notice that the signal detected in rs2000900 was somewhat isolated, and could not exclude possibilities of false positive, future investigations and validations would be warranted. Taken together, the GWAS findings suggested consistency with previous findings in psychopharmacology, highlighted the complex interplay between neural, gut and metabolic pathways in the context of ADHD pharmacological treatment response and provide new avenues for further investigation.
In the current study, we combined the treatment responses to ATX and MPH. It’s worth noting although there are different mechanisms, substantial shared pathways underlying two medications have also been identified [18, 73,74,75]. Both medications target monoaminergic circuits, especially NE pathway. Neuroimaging studies also underscored similar effects of both medications in normalizing compromised brain activation in fronto-striatal and fronto-parietal circuits [76,77,78]. Additionally, an animal study highlighted lipid metabolism as another shared pathway between MPH and ATX, corroborating our findings [67, 79,80,81]. The methodology of combing different phenotypes that share a genetic architecture has previously been shown to offer numerous benefits, such as augmenting the statistical power of GWAS, uncovering common genetic loci, and clarifying shared biological pathways. Thus, by combining the outcomes of MPH and ATX, our current results provided reliable evidence about common genetic basis underlying the effects of these two medications.
It’s worth mention that the two significant loci are both intronic variants. Although this kind of variants typically not directly cause protein variations, growing evidence has suggested their critical roles in gene regulation, including expression and splicing. The influence of intronic variants on pharmacological responses in mental disorders has also been identified, including associations with antidepressant responses and antipsychotic-induced weight gain through intronic variants rs4884091 in RNF219-AS1, rs4955665 in MECOM, and rs10422861 in PRPD, and others (Li et al., 2020; Liao et al., 2024). Our results further foregrounded the pivotal role of intronic variants in mediating the pharmacological treatment responses for ADHD, aligning with existing literature in this field.
Previous studies demonstrated several remarkable contributions of DL models in the field of psychiatry, including identifying “nominal” variants which tend to be ignored in GWAS and capturing the real-world complex non-linear relationship, which could lead to more accurate prediction model and new target genes. Here we proposed a CNN-based regression model using 5516 variants with P-values less than 1E-02 in genome-wide analyses as inputs (E2-CNN model), which outperformed other DL models and traditional ML models, also in the prediction of an independent test dataset, highlighting its promise in precise treatment. However, it is important to acknowledge that due to the limited size of the dataset and the heterogeneity in gene arrays between the training and testing datasets, our deep learning model achieved only moderate accuracy on the test dataset (61%). Further research is required to enhance the model’s generalization. Potential improvements could involve incorporating larger and more diverse datasets, integrating SNP data with other omics data, and utilizing transfer learning techniques to increase the clinical utility of DL models in predicting responses to ADHD pharmacological treatments.
Interpretations of the E2-CNN model highlighted a brain-expressed gene, NKAIN2, which is responsible for the externalizing disorders, including substance use disorder and ADHD. By linking the gene to functions, we found it mainly involved in brain disorders/measurements and metabolic processes (Supplementary table 5). Taking these findings together, our DL-identified genes further validated our above hypothesis, i.e., metabolism and brain-related genes collaboratively regulate the pharmacological treatment response.
Enrichment analyses of the genes identified by the DL model revealed the involvement of two pathways, i.e., the plasma membrane and Methamphetamine dependence. It is noteworthy that Methamphetamine, similar to MPH, is also a central nervous system (CNS) stimulant that mainly achieves its functions through competitively inhibiting dopamine and norepinephrine transporters, thereby increasing catecholamine transmission [1, 82]. This finding provides rational explanation for our results. Additionally, the stability of the plasma membrane is closely associated with lipid metabolic processes, suggesting a potential link between the identified genes and lipid metabolism.
Emerging evidence has highlighted the intricate connections between ADHD and metabolic processes. Individuals with ADHD often exhibit a higher prevalence of obesity and gastrointestinal symptoms; and the brain-gut axis was regarded as a crucial pathway in ADHD etiology [83,84,85]. Meanwhile, the administration of ADHD medications has also been shown to influence metabolic processes, with animal studies suggesting that MPH could impact the levels of lipoproteins in axon and glial cells [86]. Our findings identified that genes associated with treatment response, were meanwhile involved in the metabolic processes or digestive system, which implied a dynamic and reciprocal interplay between medication and metabolism. To conclude, our results encouraged further investigations to explore the impact of metabolic processes on the pharmacological treatment response in ADHD, especially regarding the lipid-related processes; and our results suggested that clinical practice should take the metabolic factors into consideration when tailor the specific treatment plans for individuals.
Conclusion
In summary, our study represents the first genome-wide analyses to identify significant variants associated with ADHD pharmacological treatment response. We discovered possible associated genes, included TMEM117, MYO5B, and PUS7L. Additionally, this is the first study to utilize genetic data constructing a DL model for ADHD pharmacological treatment prediction, which demonstrated promising performance. Through the interpretation of the DL model, we further identified NKAIN2 as a potential associated gene. Functional analyses further supported the involvement of genes related to neural and metabolism systems in the modulation of ADHD pharmacological treatment responses. These findings contribute to a better understanding of the genetic and biological mechanisms underlying medication response in ADHD.


Responses