Genome-wide analysis identifies novel shared loci between depression and white matter microstructure
Introduction
The brain’s white matter, composed of extensive networks of myelinated axons, supports the integrated functioning of neural circuits that underlie cognition and emotion [1, 2]. The microstructure of white matter, including axonal density, diameter, and myelination, is critical for understanding the neural mechanisms behind these functions [3, 4]. Diffusion tensor imaging (DTI) quantitatively assesses this microstructure, using metrics such as fractional anisotropy (FA) and mean diffusivity (MD) to measure directional water diffusion and the overall mobility of water molecules [5], respectively. These DTI metrics are crucial for revealing alterations in the structural integrity of white matter pathways associated with psychiatric disorders [6,7,8].
Depression is a prevalent psychiatric disorder characterized by pervasive sadness, loss of interest in enjoyable activities, and a range of cognitive and physical symptoms that impair daily functioning [9]. Neuroimaging research has consistently demonstrated alterations in the white matter microstructure among individuals with depression, evidenced by changes in FA and MD. For example, reductions in FA or increases in MD have been observed in regions such as the superior longitudinal fasciculus [10], corpus callosum [11, 12], corona radiata [13, 14], and anterior thalamic radiation [15, 16], potentially indicating compromised myelination or axonal damage. Such structural anomalies can disrupt effective neural communication, exacerbating the clinical manifestations of depression [17]. Furthermore, the extent and characteristics of these microstructural changes often correlate with the severity and duration of depressive symptoms [15], suggesting their possible role in the disorder’s pathophysiology. Patterns of white matter abnormalities in depression have also been linked to different symptom profiles, such as impaired cognitive processing, emotional regulation difficulties, and susceptibility to recurrent depressive episode [18, 19]. Despite the established clinical and epidemiological associations between white matter microstructure and depression, elucidating their genetic overlap could offer valuable insights into the biological mechanisms underlying depression and its related white matter alterations.
Genome-wide association studies (GWASs) have identified numerous single nucleotide polymorphisms (SNPs) associated with white matter microstructure and depression, highlighting the polygenic nature of these traits [20, 21]. Evidence increasingly suggests a genetic overlap between white matter microstructure and depression. For instance, Zhao and colleagues utilized linkage disequilibrium score regression (LDSR) to explore global genetic correlations between these two traits [21]. Additionally, a previous study using polygenic risk score (PRS) analysis demonstrated a significant negative correlation between the risk score for depression in healthy individuals and widespread reductions in white matter FA [22]. Despite their ability to provide valuable insights, these methods cannot identify specific variants, genes, or biological pathways shared between depression and white matter traits. They also tend to underestimate the genetic overlap because these methods aggregate effects from variants across the genome and can only detect consistent directions of allelic effects—either concordant or discordant—without accounting for mixed patterns of directional effects [23,24,25].
New powerful statistical approaches, such as local analysis of [co]variant association (LAVA) [26] and conditional/conjunctional false discovery rate (cond/conjFDR) [27, 28], have been developed to investigate the genetic overlap between complex phenotypes. LAVA can identify genomic regions with local genetic correlations, revealing shared biological mechanisms that global methods like LDSR and PRS might overlook [26]. In contrast, cond/conjFDR allows for the discovery of genetic variants significantly associated with two phenotypes simultaneously, capturing a mixture of antagonistic and agonistic directional effects among the shared variants [29,30,31]. Recently, Parker and colleagues employed conjFDR to explore the genetic overlap between depression and white matter microstructure, shedding new light on the shared variants, genes, and pathways between these traits [32]. Despite these advancements, the comprehensive genetic architecture linking DTI parameters and depression remains largely unexplored. This is partly due to the relatively modest sample sizes used in previous depression GWAS (N = 420,359) and the exclusive focus on FA in their study. A larger sample size and a variety of DTI metrics are essential to achieve a more accurate understanding of the genetic factors that link depression to changes in white matter microstructure. Additionally, using DTI metrics averaged across both hemispheres may obscure important information, as depression-related white matter microstructural variations can exhibit distinct patterns between the left and right hemispheres [33].
Building upon these insights, we conducted a comprehensive exploration of the shared genetic architecture between depression and 96 bilateral white matter traits by analyzing summary data from the largest existing GWAS on depression (N = 674,452) and from two commonly used DTI metrics: FA and MD (N = 33,224). Leveraging these extensive datasets, we employed a multi-faceted analytical strategy to address our objectives, focusing on genetic overlap at global, local, and variant levels. Specifically, genome-wide genetic correlations between depression and DTI-derived metrics were assessed using LDSR [34], providing robust global estimates. Subsequently, local genetic correlations within specific chromosomal regions were explored using LAVA [26], identifying smaller, region-specific effects. Finally, at the variant level, we used conjFDR [27, 28] to identify specific genetic variants associated with both depression and white matter microstructure, revealing potential genes and biological pathways implicated in both traits. This integrative approach not only enhances our understanding of the genetic underpinnings shared between depression and white matter microstructure but also provides a foundation for identifying potential therapeutic targets and biomarkers for these interconnected traits.
Methods
Study design
This study investigated the shared genetic architecture between depression and white matter microstructure. To achieve this, we estimated global genetic correlations using LDSR, identified local genetic correlations with LAVA, and detected shared genetic variants through conjFDR analysis. Independent genomic loci were identified, followed by functional annotation, gene mapping, and enrichment analysis to explore underlying biological mechanisms. This study utilized publicly available GWAS summary statistics, without direct involvement of human participants or live animals. All methods were performed in accordance with the relevant guidelines and regulations, and the included GWAS datasets had received approval from their respective ethics committees or institutional review boards, with informed consent obtained from participants in the original studies.
GWAS data
Depression GWAS
The GWAS summary statistics for depression were sourced from Als TD et al. [20], which included an extensive meta-analysis with 371,184 cases and 978,703 controls of European ancestry from the iPSYCH, FinnGen, Psychiatric Genomics Consortium, UK Biobank, 23andMe, and Million Veteran Program cohorts. To ensure sample independence across all analyses—particularly since the white matter microstructure data are entirely derived from UK Biobank (see immediately below)—we excluded UK Biobank participants from the depression dataset. Although LDSR and LAVA do not require independent datasets, this exclusion is essential for condFDR and conjFDR analyses, as sample overlap could introduce bias by inflating shared trait associations. Additionally, samples from 23andMe were omitted due to access restrictions, resulting in a final dataset of 166,773 cases and 507,679 controls [20]. Further information on the GWAS summary statistics is available in the Supplementary Methods.
White matter microstructure GWAS
The summary statistics for a total of 96 tract-level phenotypes, specifically 48 FA and 48 MD measurements, were derived from Smith et al. [35], encompassing 33,224 individuals of European ancestry from the UK Biobank. Details of the GWAS summary statistics and the 96 DTI phenotypes are provided in the Supplementary Methods and Supplementary Table 1, respectively.
Genetic overlap analysis
Global-level
Based on GWAS summary statistics, LDSR [34] was employed to estimate cross-trait global genetic correlations (rg) between white matter phenotypes and depression. Precomputed linkage disequilibrium (LD) scores from the 1000 Genomes Project European reference panel [36] supported these estimates, with analyses restricted to HapMap3 SNPs. LDSR calculates the rg of additive genetic effects between two traits, with the sign indicating whether the shared genetic effects primarily influence both traits in the same or opposite directions. If the shared genetic variants exhibit a balanced mix of effect directions, LDSR yields a non-significant correlation. Therefore, a non-significant global genetic correlation should not be interpreted as an absence of shared SNP associations between traits, as associations may still exist at the local or variant level. Adjustments for multiple testing in LDSR analysis were made using the Benjamini-Hochberg false discovery rate (FDR) correction (q < 0.05). For further technical details, see Supplementary Methods.
Local-level
Local genetic correlations were examined using LAVA [26], focusing on 2495 genomic loci for each depression-white matter phenotype pair. These loci were pre-defined by the LAVA framework, which partitions the genome into approximately independent regions of about 1 Mb each, based on LD structure. Segmenting the genome into these relatively independent regions allows for the detection of genetic correlations that may be overlooked in global-level analyses, offering a more detailed understanding of complex genetic relationships. Specifically, univariate tests were initially conducted to estimate local genetic signals (h2SNP) for each trait (e.g., depression and white matter microstructures). Loci without significant local h2SNP (p < 0.05/2495) were filtered out, retaining only those significantly associated with the relevant phenotypes to ensure the detection of stable and meaningful associations. Bivariate analyses were then performed to assess the local genetic correlation between depression and white matter microstructure for loci that displayed significant local h2SNP in both traits. The Benjamini-Hochberg FDR correction (q < 0.05) was applied in bivariate analysis across all pairwise comparisons. For additional methodological details, please refer to the Supplementary Methods.
Variant-level
We applied the conjFDR method [27, 28] to identify shared genetic variants between depression and white matter microstructure. The conjFDR approach builds upon the condFDR method, utilizing an empirical Bayesian statistical framework as its foundation. CondFDR enhances the identification of genomic variants by leveraging cross-trait enrichment from two GWAS datasets, considering SNP associations with both the primary and secondary traits. This approach allows for the detection of variants that are more likely to represent true associations, even if they do not meet the genome-wide significance thresholds. For each pair of traits, condFDR re-ranks the test statistics for the primary trait (e.g., depression) by adjusting for SNP associations with the secondary trait (e.g., white matter microstructure). Conditional quantile-quantile (Q-Q) plots were used to visually represent this cross-trait enrichment, illustrating the distribution of P-values for the primary trait within SNP strata defined by their association with the secondary trait. The conjFDR method extends this analysis by performing two separate condFDR analyses—conditioning depression on white matter microstructure phenotype and vice versa—and defining the conjFDR value as the maximum of the two mutual condFDR values to provide a conservative estimate of the FDR for shared variants between the two traits. Significance thresholds were set at 0.05 for conjFDR and 0.01 for condFDR, consistent with previous studies [37,38,39]. To mitigate bias from complex regional LD, SNPs located within the major histocompatibility complex (chr6:25119106–33854733) and chromosome 8p23.1 (chr8:7200000–12500000) were excluded before fitting the FDR model. For a detailed description of the variant-level methods, please refer to Supplementary Methods.
Genetic loci definition
For the cond/conjFDR results of each depression-white matter phenotype pair, independent genomic loci were defined by the “sumstats.py” script (https://github.com/precimed/python_convert/blob/master/sumstats.py), which follows a methodology similar to the FUMA SNP2GENE process [40]. SNPs were considered independent if they were not in LD with each other (r2 < 0.6) and met the significance thresholds of condFDR < 0.01 or conjFDR < 0.05. Among these SNPs, those with LD r2 < 0.1 were further identified as lead SNPs. Candidate SNPs were identified as those with a cond/conjFDR < 0.1 [41,42,43] and an LD r2 > 0.6 with at least one independent significant SNP. The boundaries of each locus were established by including all such candidate SNPs, and those within 250 kb of each other were combined. LD information used in the analysis was sourced from the European reference panel of the 1000 Genomes Project [36]. Subsequently, independent loci from all 48 depression-white matter phenotype pairs were merged into distinct loci, with overlapping genetic borders merged into a single locus [38]. The lead SNP with the lowest cond/conjFDR value was identified as the final lead SNP in the merged locus.
Loci were defined as novel if they (1) extended beyond 500 kb from loci identified in the respective original GWAS (p < 1E–6) [20, 35], (2) extended beyond 500 kb from loci identified in Parker et al.’s study [32] for conjFDR analysis, and (3) did not overlap with any SNPs in the GWAS catalog [44] associated with depression or white matter microstructure. Of note, for comparison with Parker et al., who analyzed variant-level overlap using GWAS summary statistics for major depression (N = 420,359) and 21 tract-level FA measures (N = 33,292), we focused exclusively on FA-related loci from our conjFDR findings, as their study did not include condFDR results or MD metrics. Additionally, since Parker et al. did not specify precise start and end positions for these loci, we defined the boundaries by extending 1000 kb upstream and downstream from the lead SNP to ensure a thorough comparison.
Functional annotation and enrichment analyses
Using the FUMA online annotation platform [40], all candidate SNPs within the genomic loci underwent functional annotation, including combined annotation dependent depletion (CADD) scores [45], RegulomeDB scores [46], and chromatin states [47, 48]. This annotation information predicted the detrimental impact of SNPs on disease susceptibility, the likelihood of regulatory functionality, and reflected genomic region accessibility [40], respectively. Additionally, all candidate SNPs were mapped to protein-coding genes through positional mapping, expression quantitative trait locus (eQTL) mapping, and chromatin interaction mapping [40]. Finally, g:Profiler [49] was employed to conduct enrichment analyses for biological processes associated with the genes identified through any of these mapping strategies, using the Benjamini-Hochberg FDR correction with a significance threshold of 0.05. For a complete description of the procedures employed, please refer to Supplementary Methods.
Validation analyses
To validate our findings, we conducted several experiments. First, we used GWAS summary statistics from Zhao et al. [21], which included 21 non-lateralized white matter tracts, to assess the impact of different white matter atlases on the conjFDR results. Specifically, we applied the same conjFDR and genetic loci definition procedures as in our main analysis, considering loci replicable if they were within 500 kb of the borders of any loci that detected in the primary analysis. Second, we compared our findings with those of Parker et al., who identified 65 genomic loci shared between major depression and FA [32]. As previously described, we defined the borders of Parker et al.’s loci as extending 1000 kb upstream and downstream from the lead SNP to ensure consistent comparison. Similarly, a locus was considered replicable if it was within 500 kb of the borders of any loci identified in our primary analysis.
Results
Global-level genetic overlap
The global genetic correlations between depression and 96 white matter phenotypes were evaluated, with rg ranging from −0.0826 to 0.0920 (Supplementary Table 2). After applying the Benjamini-Hochberg FDR correction, no significant global genetic correlations were detected. However, two FA and five MD traits showed genetic correlations with depression at a nominal significance level (Fig. 1A). Specifically, there were negative genetic correlations between depression and FA of the bilateral posterior thalamic radiation (left: rg = −0.0826, p = 1.32E–2; right: rg = −0.0817, p = 1.83E–2; Supplementary Table 2). Conversely, positive genetic correlations were observed between depression and MD of the bilateral superior fronto-occipital fasciculus (left: rg = 0.0745, p = 4.42E–2; right: rg = 0.0918, p = 1.23E–2), MD of the right anterior limb of the internal capsule (rg = 0.0920, p = 1.38E–2), MD of the right superior corona radiata (rg = 0.0781, p = 1.52E–2), and MD of the right external capsule (rg = 0.0862, p = 1.73E–2, Supplementary Table 2).
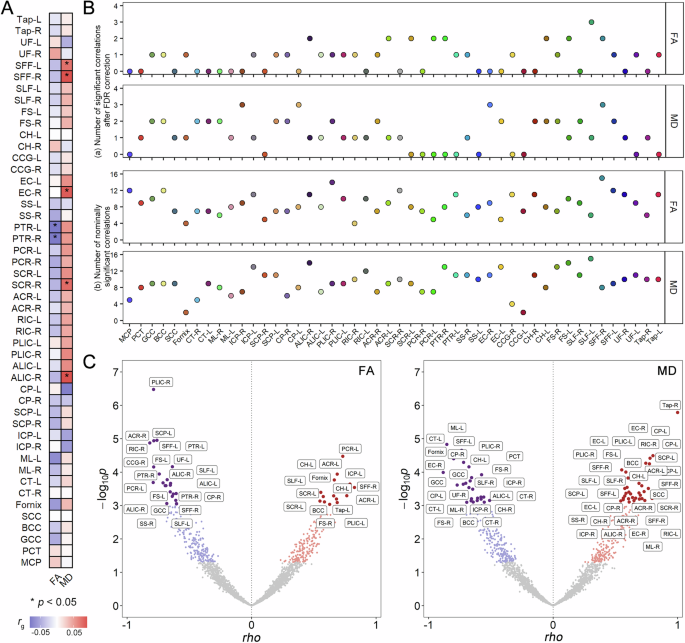
A Results of global genetic correlations calculated using LDSR analysis. The heatmap colors represent the magnitude of genetic correlations, with positive correlations shown in red and negative correlations in blue. Asterisks (*) indicate correlations with nominal p < 0.05. B The number of local genetic correlations for each depression-white matter phenotype pair identified at (a) Benjamini-Hochberg FDR correction and (b) nominal significance levels. The x-axis represents 48 white matter tracts, and the y-axis indicates the number of genomic regions with significant local genetic correlations. Colors represent different white matter tracts. The upper two panels depict results for FA, while the lower two panels show results for MD. C Local genetic correlation results showing positive (red) and negative (blue) correlations across genomic loci for 48 white matter phenotype pairs (each represented by one point). The left panel displays results for FA, and the right panel shows results for MD. The x-axis represents the local genetic correlation values (rho), while the y-axis represents the negative logarithm of the p-values (-log10(p)). Grey points indicate correlations with p > 0.05. Points with nominal p < 0.05 are shown in red or blue based on the direction of effect, while those surviving FDR correction are represented as larger, darker points. The full names and corresponding abbreviations for the white matter phenotypes are shown in Supplementary Table 1. FA fractional anisotropy, FDR false discovery rate, MD mean diffusivity, rg genetic correlation, rho local genetic correlation.
Local-level genetic overlap
Using the LAVA approach, we identified several genomic loci exhibiting significant local genetic correlations between depression and white matter phenotypes. Specifically, a total of 37 loci for FA and 59 loci for MD demonstrated significant associations after Benjamini-Hochberg FDR correction, with mixed directional effects across different genomic regions (Fig. 1B(a)). Among these, 15 positive (ranging from 0.55 to 0.83) and 22 negative correlations (ranging from −0.60 to −0.82) were observed between FA and depression (Supplementary Table 3 and Fig. 1C), and 34 positive (ranging from 0.54 to 1.00) and 25 negative correlations (ranging from −0.51 to −0.88) were found between MD and depression (Supplementary Table 4 and Fig. 1C). The most significant positive local genetic correlation was observed at chr13:107037865–108521978 between depression and FA of the left posterior corona radiata (rho = 0.73, FDR q = 1.84E–2), and chr2:100202437–101556799 between depression and MD of the right tapetum (rho = 1.00, FDR q = 4.18E–3). In contrast, the most significant negative local genetic correlation was identified between depression and FA of the right posterior limb of the internal capsule at chr13:30068526–31433218 (rho = −0.79, FDR q = 1.71E–3), and between depression and MD of the left medial lemniscus at chr14:56206431–57460781 (rho = −0.85, FDR q = 1.26E–2). When the significance threshold was relaxed to the nominal level, 187 positive and 227 negative correlations were identified for FA, and 221 positive and 220 negative correlations for MD (Supplementary Tables 3, 4 and Fig. 1B(b)).
Variant-level genetic overlap
The condFDR and conjFDR analyses were employed to identify novel loci for each trait and shared loci between depression and white matter microstructure, respectively. The stratified conditional Q-Q plots demonstrated SNP enrichment for depression as a function of their associations with white matter microstructure, and vice versa (Supplementary Figs. 1A–48A, Supplementary Figs. 1B–48B), suggesting the existence of polygenic overlap.
In the condFDR analysis, 2372 genomic loci associated with depression conditioned on FA, and 2270 genomic loci associated with depression conditioned on MD, were identified (Fig. 2A, B, Supplementary Tables 5, 6, and Supplementary Figs. 49, 50). A combination of these loci across depression-FA pairs revealed 123 distinct loci for depression, including 15 novel ones (Supplementary Table 7, Supplementary Fig. 51). Likewise, combinations across depression-MD pairs uncovered 105 distinct loci for depression, with 14 novel ones (Supplementary Table 8, Supplementary Fig. 51). Additionally, merging the FA- and MD-conditioned results yielded a total of 129 distinct loci for depression across all white matter phenotypes, including 20 novel loci (Supplementary Table 9). Conversely, 1113 loci associated with FA and 1242 associated with MD, conditioned on depression, were identified (Fig. 2C, D, Supplementary Tables 10, 11, and Supplementary Figs. 52, 53). Merging these loci yielded 447 distinct loci for FA, including 50 novel ones, and 342 for MD, with 41 novel ones (Supplementary Tables 12, 13, Supplementary Fig. 54).
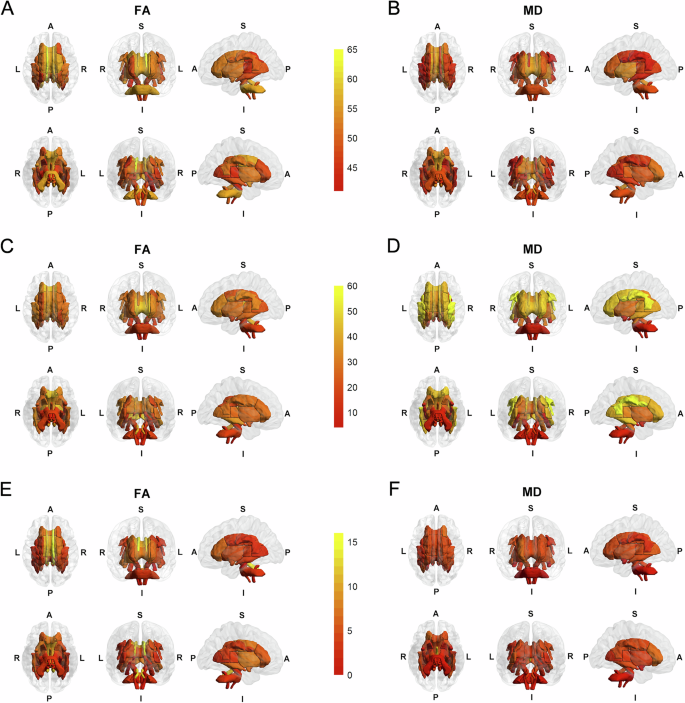
A, B Brain maps showing the distribution of genomic loci for depression conditioned on FA and MD at condFDR < 0.01. C, D Brain maps showing the distribution of genomic loci for FA phenotypes and MD phenotypes conditioned on depression at condFDR < 0.01. E, F Brain maps showing the distribution of shared loci between FA and depression and between MD and depression at conjFDR < 0.05. The color gradient from red to yellow indicates the increasing number of loci. A anterior, FA fractional anisotropy, I inferior, L left, MD mean diffusivity, P posterior, R right, S superior.
In the conjFDR analysis, 218 loci were identified as associated with both depression and FA, and 130 loci with both depression and MD, as shown in Supplementary Tables 14, 15 and Supplementary Figs. 1C–48C. The number of shared loci for each white matter phenotype is presented in Fig. 2E, F, and the genomic distributions of these conjFDR results are shown in Fig. 3A. From the original GWAS summary statistics, the effect directions of the top lead SNPs at the shared loci were extracted and compared. It was found that 68.3% (149/218) top lead SNPs exhibited opposite effect directions and 31.7% (69/218) had the same effect direction between depression and FA (Supplementary Table 14). Similarly, 33.1% (43/130) top lead SNPs showed opposite effect directions and 66.9% (87/130) had the same effect directions between depression and MD (Supplementary Table 15). Among the DTI phenotypes, the FA of the left cingulum cingulate gyrus exhibited the highest number of shared genomic loci with depression (n = 16), while the MD of the fornix had the largest number of shared loci (n = 12). Notably, the most significant genomic locus, chr17:65771016–66098979, was linked to both depression and FA in the bilateral superior longitudinal fasciculus (right: rs6504548, conjFDR = 2.66E–07, Fig. 3B; left: rs62086045, conjFDR = 1.41E–05, Fig. 3C). A similar pattern was observed for chr17:65772600–66098979, associated with both depression and MD in the bilateral superior longitudinal fasciculus (left: rs8072225, conjFDR = 2.32E–07; right: rs8072225, conjFDR = 2.41E–07; Supplementary Fig. 55).
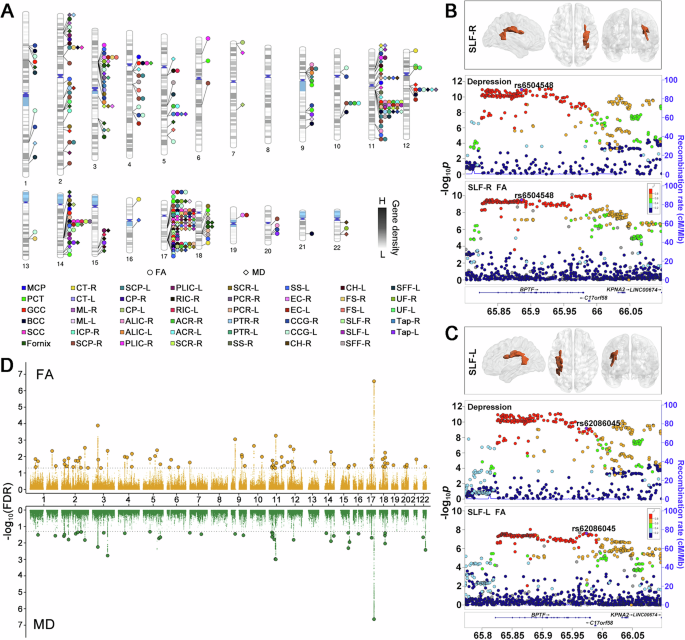
A Distribution of the top lead SNPs within loci shared between depression and FA or MD across the genomic landscape of chromosomes. Each color represents a different white matter microstructure phenotype, as listed in the legend. B LocusZoom plots of a genomic locus (chr17:65771016–66098979, top lead SNP: rs6504548) showing regional SNP associations for depression and FA in the right superior longitudinal fasciculus (SLF-R). The y-axis represents the negative logarithm of the p-values (-log10(p)), while the colors indicate recombination rates. C LocusZoom plots of a genomic locus (chr17:65771016–66098979, top lead SNP: rs62086045) showing regional SNP associations for depression and FA in the left superior longitudinal fasciculus (SLF-L). The y-axis represents the negative logarithm of the p-values (-log10(p)), while the colors indicate recombination rates. D Manhattan plot displaying the distinct shared loci between depression and white matter microstructure phenotypes identified at conjFDR < 0.05 after combining results. The top panel shows results for FA, and the bottom panel shows results for MD. Each point represents a SNP, with larger points and black borders indicating lead SNPs. The y-axis represents the negative logarithm of the conjFDR values (-log10(conjFDR)) for each SNP, and the x-axis reflects chromosomal positions. The dashed line represents the threshold of conjFDR = 0.05. FA fractional anisotropy, MD mean diffusivity, SLF-L left superior longitudinal fasciculus, SLF-R right superior longitudinal fasciculus. The full names and corresponding abbreviations for the white matter phenotypes are shown in Supplementary Table 1.
To examine hemispheric distinctions in shared genetic loci between depression and white matter microstructure, we focused on 42 white matter tracts (21 paired tracts) as left and right hemisphere counterparts. For each type of white matter phenotype (FA or MD), we created distinct loci sets for the left and right hemispheres by combining independent loci from depression-white matter phenotype pairs within each hemisphere. Across these 21 paired tracts, we identified 55 distinct loci shared between depression and FA in the left hemisphere, with 24 (43.6%) specific to the left; and 45 loci in the right hemisphere, with 16 (35.6%) specific to the right (Supplementary Fig. 56). For loci shared between depression and MD, we found 26 distinct loci in the left hemisphere, 14 (53.8%) of which were specific to the left; and 21 loci in the right, 9 (42.9%) of which were specific to the right (Supplementary Fig. 57). These findings highlight the importance of examining hemisphere-specific genetic architecture, as distinct and shared loci in each hemisphere may contribute differently to the relationship between depression and white matter microstructure.
For loci identified in the conjFDR analysis, 35 genomic loci were linked to depression and at least two FA phenotypes (Supplementary Table 16), while 18 were linked to depression and at least two MD phenotypes (Supplementary Table 17), resulting in 78 distinct loci for FA and 41 for MD (Supplementary Tables 18, 19, Fig. 3D). Among the FA-related findings, 25 loci were newly discovered for depression, 35 for FA, and 16 for both (Supplementary Table 18). Similarly, among the MD-related findings, 17 loci were newly identified for depression, 25 for MD, and 11 for both (Supplementary Table 19). Furthermore, merging the FA and MD results revealed 93 distinct loci shared with depression across all white matter traits (Supplementary Table 20).
Functional annotation and enrichment analyses
There were 5071 candidate SNPs across 78 distinct genomic loci shared between depression and FA, and 3456 candidate SNPs across 41 distinct genomic loci shared between depression and MD (Supplementary Tables 21, 22). The distribution of annotations for these SNPs within shared loci is illustrated in Fig. 4A, B, showing that most candidate SNPs were located in intronic and ncRNA intronic regions. Specifically, for depression and FA, 51.63% (2618/5071) of SNPs were in intronic regions, and 21.48% (1089/5071) were in ncRNA intronic regions (Fig. 4A). For depression and MD, 51.56% (1782/3456) SNPs were intronic, and 24.05% (831/3456) were ncRNA intronic (Fig. 4B). Additionally, we identified 30 non-synonymous exonic variants jointly associated with depression and FA, and 32 non-synonymous exonic variants jointly linked with depression and MD (Supplementary Tables 21, 22). For the genomic loci shared between depression and FA, 4.30% (218/5071) of the candidate SNPs had a CADD score above 12.37, suggesting high deleterious potential. Approximately 7.39% (375/5071) of SNPs exhibited RegulomeDB scores below 2, indicating a higher probability of regulatory function based on evidence from eQTLs and chromatin marks (Fig. 4A). Furthermore, 86.63% (4393/5071) of SNPs were located within open chromatin regions, with chromatin states ranging from 1–7, which are associated with active regulatory elements and transcriptional activity (Fig. 4A). For the genomic loci shared between depression and MD, 3.99% (138/3456) of the candidate SNPs were identified as potentially pathogenic, 9.11% (315/3456) were likely to have regulatory potential (Fig. 4B), and 90.77% (3137/3456) were found in open chromatin state regions (Fig. 4B).
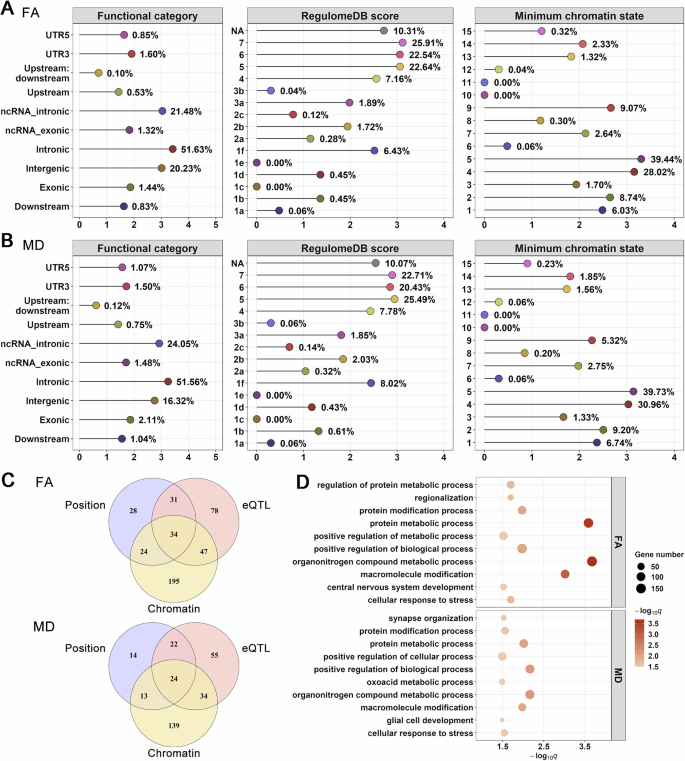
A Distribution of functional categories, RegulomeDB scores, and minimum chromatin states for candidate SNPs in shared loci associated with depression and FA. B Distribution of functional categories, RegulomeDB scores, and minimum chromatin states for candidate SNPs in shared loci associated with depression and MD. In panels A and B, the y-axis represents the functional categories used for classifying candidate SNPs, while the x-axis shows log10-transformed number of candidate SNPs in each category. C Venn diagram illustrating the number of genes mapped by three different strategies—positional (blue), eQTL (pink), and chromatin interaction mapping (orange). Results are shown separately for depression and FA (top) as well as depression and MD (bottom). D Bubble plot showing enriched GO biological process terms for genes mapped from shared loci. The x-axis indicates the negative logarithm of the FDR-adjusted q-values (-log10(q)), and the y-axis lists the biological processes. Bubble’s size indicates the number of genes associated with each process, while bubble color reflects significance, with darker colors indicating higher significance. FA fractional anisotropy, MD mean diffusivity, eQTL expression quantitative trait locus.
For the top lead SNPs in distinct genomic loci shared between depression and FA, 82.1% (64/78) were found in intergenic and intronic regions, and 14.1% (11/78) in non-coding RNA regions (Supplementary Table 18). Five of these 78 SNPs—rs12118183, rs1043029, rs10767734, rs813043, and rs2075678—exhibited high deleterious potential, with CADD scores exceeding 12.37. One SNP, rs199500, had potential to impact on regulatory function, as suggested by a RegulomeDB score of 1 f. Additionally, 82.1% (64/78) of these SNPs displayed active transcriptional activity, as evidenced by chromatin states of less than 8. For the distinct loci associated with depression and MD, 78% (32/41) of the top lead SNPs were located in intergenic and intronic regions, with 14.6% (6/41) in non-coding RNA regions (Supplementary Table 19). Among these, five SNPs—rs1868600, rs67216675, rs3909436, rs62618693, and rs12434646—were recognized as pathogenic. Notably, rs62618693 is a non-synonymous exonic variant within the QSER1. Three SNPs—rs10769253, rs199500, and rs1894401—were found to potentially regulatory impact. Additionally, 90.2% (37/41) of these SNPs were located in regions of open chromatin states.
Candidate SNPs within loci shared between depression and FA were mapped to 437 genes using at least one mapping strategy (Supplementary Table 23), and 34 genes were identified by all three mapping strategies (Fig. 4C). The enrichment analysis of these 437 genes revealed significant associations with 18 GO biological process terms, with the significant terms mainly related to organonitrogen compound metabolic process (FDR q = 2.12E–4), protein metabolic process (FDR q = 2.58E–4), and macromolecule modification (FDR q = 9.63E–4, Supplementary Table 24, Fig. 4D). Similarly, candidate SNPs within loci shared between depression and MD were mapped to 301 genes (Supplementary Table 25), and 24 were found to be associated with all three mapping strategies (Fig. 4C). Enrichment analysis of these 301 genes showed associations with 20 GO biological process terms, primarily related to the positive regulation of biological process (FDR q = 6.87E–3), organonitrogen compound metabolic process (FDR q = 6.87E–3), and protein metabolic process (FDR q = 9.76E–3, Supplementary Table 26, Fig. 4D). Detailed results of the functional annotation (Supplementary Tables 7, 8, Supplementary Tables 12, 13), gene mapping (Supplementary Tables 27, 28, Supplementary Tables 31, 32), and enrichment analyses (Supplementary Tables 29, 30, Supplementary Tables 33, 34, Supplementary Figs. 58, 59) obtained from the condFDR analyses are provided in the Supplementary Results.
Validation analyses
The validation analyses demonstrated the robustness of our findings. First, using the GWAS summary statistics from Zhao et al. [21], which included 21 non-lateralized white matter tracts, we assessed the consistency of the conjFDR results with different white matter atlases. Sixty-two distinct loci shared between depression and FA were identified using the Zhao et al. dataset (Supplementary Table 35), with 43 loci falling within the 500 kb range of those identified in our main analysis. Additionally, 31 distinct loci were found to be shared between depression and MD (Supplementary Table 36), with 15 loci falling within the 500 kb range of our main analysis findings, indicating the robustness of these loci to variations in white matter atlas definitions. Second, we compared our significant genomic loci with those reported in Parker et al.’s study [32], which investigated the genetic overlap between major depression and white matter FA. Twenty-nine out of the 65 genomic loci identified by Parker et al. fell within the 500 kb range of loci identified in our main analysis (Supplementary Table 37), confirming the validity and reliability of our findings across different datasets and study designs.
Discussion
Our study explored the shared genetic architecture between depression and white matter microstructure, leveraging the largest GWAS datasets available for both traits. Despite the lack of significant global genetic correlations, our comprehensive approach uncovered significant local- and variant-level genetic overlaps. The identification of specific genomic loci through the LAVA and conjFDR methods demonstrated the complexity and heterogeneity of these relationships, highlighting the importance of examining genetic overlap at multiple levels. Furthermore, functional annotation of the identified shared loci suggested the involvement of genes related to metabolic and regulatory processes, providing potential targets for further research into the pathophysiology of depression. These results provide compelling evidence of a shared genetic basis between depression and white matter microstructure, offering new insights into the biological mechanisms underlying depression and its neural correlates.
The observed global genetic correlations between depression and white matter microstructure were relatively low, ranging from −0.0826 to 0.0920, consistent with findings from prior studies [21, 50]. After FDR correction, these correlations did not reach statistical significance (Supplementary Table 2). The traditional global method, such as LDSR, estimates genetic correlations across the entire genome, which may overlook localized signals or local correlations in opposite directions [26]. To address this issue, we conducted a more detailed examination of genetic correlations at specific genomic regions, revealing both positive and negative associations. This refined analysis enables us to detect more subtle relationships and potential shared biological mechanisms between traits that might be obscured in global evaluations. By focusing on local genetic correlations, we identified distinct patterns of genetic influence that vary by genomic region, suggesting that the genetic architecture of these traits is more complex than previously understood. These findings emphasize the importance of considering both global and local genetic correlations to better capture the full spectrum of genetic influences on phenotypes.
The conjFDR method was used to identify variant-level genetic overlap between depression and white matter microstructure. Stratified conditional Q-Q plots indicated SNP enrichment between depression and FA, as well as between depression and MD, suggesting considerable polygenic overlap. Among the shared loci, the effect directions of the top lead SNPs were analyzed, revealing a mixture of concordant and discordant effects. The presence of mixed effect directions suggests that depression has different impacts on white matter microstructure. Negative effects on FA or positive effects on MD reflect white matter damage or degeneration associated with depression risk, while positive effects on FA or negative effects on MD may involve enhancement or compensatory mechanisms in the white matter microstructure of individuals at risk of depression. In the conjFDR analysis, the most significant shared genetic loci were identified between depression and the bilateral superior longitudinal fasciculus at chr17:65771016–66098979 for FA and chr17:65772600–66098979 for MD. These loci are located within an intronic region of the BPTF gene, which encodes a transcriptional regulator involved in chromatin remodeling and neurodevelopmental processes, and has been associated with neurodevelopmental disorders [51, 52] and potentially linked to depression [20]. Additionally, the superior longitudinal fasciculus plays a critical role in linking various cortical regions involved in cognitive and emotional processing, making it a key structure for studying depression [22, 32, 50].
Among the 218 loci shared between depression and FA and the 130 loci shared between depression and MD, 35 genomic loci were associated with depression and at least two FA phenotypes, while 18 loci were associated with depression and at least two MD phenotypes. This suggests that tract-level white matter phenotypes share a common genetic basis while also exhibiting distinct genetic characteristics. Notably, out of the 35 overlapping loci associated with FA (Supplementary Table 16), locus 11:61542006–61624181 is linked to the largest number of FA phenotypes, affecting 22 in total. Similarly, within the 18 loci linked to MD (Supplementary Table 17), locus 17:43463493–44865498 is associated with the greatest number of MD phenotypes, involving 35 in total. The impacted white matter tracts primarily include the genu and body of the corpus callosum, bilateral anterior limbs of the internal capsule, and bilateral superior corona radiata, regions critical for emotional regulation, cognitive processing, and inter-regional neural connectivity [17, 53, 54]. These extensive associations suggest that these loci are likely involved in regulating the microstructural integrity of multiple white matter tracts, thereby contributing to the neurobiology of depression. Furthermore, both common and distinct genetic loci were identified across FA and MD phenotypes (Supplementary Table 20). The common loci suggest that certain genetic factors influence both the directional coherence and the overall magnitude of water diffusion in white matter, reflecting a shared genetic foundation affecting multiple aspects of white matter microstructure. Conversely, the distinct loci indicate genetic factors that specifically influence particular microstructural properties of white matter. By incorporating these diverse DTI measures, this study provides a comprehensive understanding of the shared and distinct genetic basis linking white matter microstructure and depression.
Candidate SNPs associated with both depression and FA were mapped to 437 genes, while those associated with MD were mapped to 301 genes. Functional enrichment analysis demonstrated that these genes are involved in various biological processes. In particular, several biological processes identified through the enrichment of shared genes between depression and FA—such as the organonitrogen compound metabolic process, protein metabolic process, macromolecule modification, and positive regulation of biological processes—were also confirmed through the enrichment of shared genes between depression and MD. Additionally, these processes are closely associated with psychiatric disorders and white matter microstructure. For instance, disruptions in organonitrogen compound metabolism are known to affect mood disorders [55, 56]. Changes in protein metabolic processes, which are essential for neurotransmission and myelin maintenance, have been linked to depression [57, 58]. Similarly, dysregulation of protein metabolism can impact neural circuits and compromise the structural integrity of brain white matter [59, 60]. The genetic associations and identified biological processes provide crucial insights into the relationships between depression and white matter microstructure, suggesting that these conditions may share common pathophysiological pathways.
The validation analyses highlight the robustness and replicability of our findings across various datasets and methodologies. Consistent identification of loci across different white matter atlases reinforces the reliability of our results. Notably, a substantial proportion of loci (69.35% [43/62] for FA and 48.39% [15/31] for MD) identified using the Zhao et al. dataset were also found in our main analysis, suggesting that the shared genetic architecture between depression and white matter microstructure is stable and reproducible, regardless of the specific atlas used. Additionally, 44.62% (29/65) genomic loci identified by Parker et al. were replicated in our main analysis. While this replication supports the validity of our findings, some loci were not replicated, which may be due to differences in the GWAS summary statistics used, highlighting two main distinctions between our study and that of Parker et al. First, Parker et al. focused on major depression (N = 420,359), whereas we included a larger sample size for depression (N = 674,452). Using a broader definition of depression captures a wider range of symptoms and severities, making our findings more representative of the general population and enabling the identification of genetic loci relevant across the full spectrum of depressive disorders, rather than being limited to the more severe cases classified as major depression. The large sample size also enhances the statistical power of our study, allowing us to detect loci that might be missed in smaller cohorts. Second, unlike Parker et al.’s study, which did not differentiate between the left and right hemispheres in the white matter atlas, our approach preserves these hemispheric distinctions. Previous studies have demonstrated that white matter microstructure can exhibit heterogeneous variation patterns between the left and right hemispheres [61, 62]. By preserving these distinctions, our approach offers a more detailed characterization of white matter microstructure, facilitating the precise identification of genetic loci.
Several limitations should be acknowledged in this study. First, the use of GWAS datasets, which predominantly focus on common variants, may not capture the full spectrum of genetic variations. Rare variants and structural variants, which could also play significant roles, were not included in our analysis. Second, our study relied on FA and MD as the primary DTI metrics. While these measures provide important insights into white matter integrity, they do not encompass all aspects of white matter microstructure. Additional DTI metrics, such as axial diffusivity and radial diffusivity, may offer complementary information and warrant consideration in future studies. Third, our analysis was restricted to individuals of European ancestry, limiting the generalizability of our findings to other populations. Including more diverse populations in future research will be crucial for ensuring the broader applicability of these results. Finally, although our study identified genetic correlations and shared loci, the functional interpretation of these findings remains complex. Further experimental validation and functional studies are essential to elucidate the specific biological mechanisms underlying the observed genetic associations.
In conclusion, this study investigated the complex genetic relationships between depression and white matter microstructure, utilizing cutting-edge analytical techniques to uncover genetic overlaps at multiple levels. Our findings provide compelling evidence for a shared genetic basis between these traits, contributing to a broader understanding of how genetic factors influence white matter integrity in the context of depressive disorders. By identifying key genetic loci associated with both depression and white matter microstructure metrics, such as FA and MD, our results highlight the potential of these genetic markers as targets for novel therapeutic strategies. Furthermore, the functional relevance of these loci was explored, revealing genes and pathways that may play critical roles in mediating the observed associations. Collectively, this study establishes a foundation for future research into the biological mechanisms underlying depression and whiter matter alterations, offering valuable insights into the pathophysiology of depressive disorders.
Responses